Estimated zip code population in 2022: 16,023 Zip code population in 2010: 16,135 Zip code population in 2000: 15,871
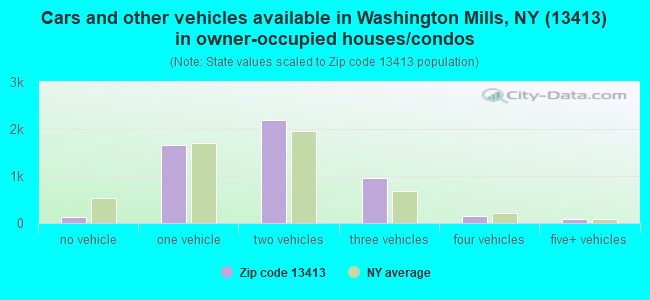
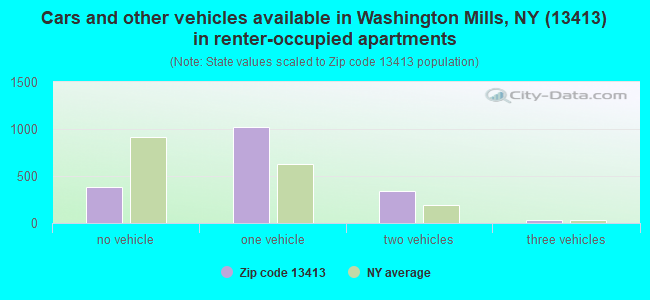
Houses and condos: 7,399 Renter-occupied apartments: 1,778
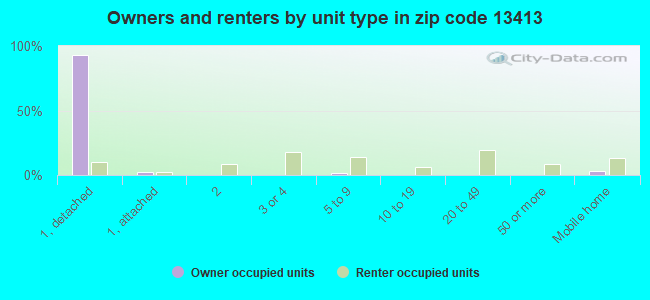
% of renters here:
26%
State:
46%
March 2022 cost of living index in zip code 13413: 99.9 (near average, U.S. average is 100)
Land area: 19.9 sq. mi. Water area: 0.1 sq. mi.
Population density: 806 people per square mile
(low).
OSM Map
General Map
Google Map
MSN Map
OSM Map
General Map
Google Map
MSN Map
OSM Map
General Map
Google Map
MSN Map
OSM Map
General Map
Google Map
MSN Map
Please wait while loading the map...
Real estate property taxes paid for housing units in 2022:
This zip code:
2.1% ($4,536)
New York:
1.5% ($6,180)
Median real estate property taxes paid for housing units with mortgages in 2022: $5,342 (2.2%) Median real estate property taxes paid for housing units with no mortgage in 2022: $3,960 (2.2%)
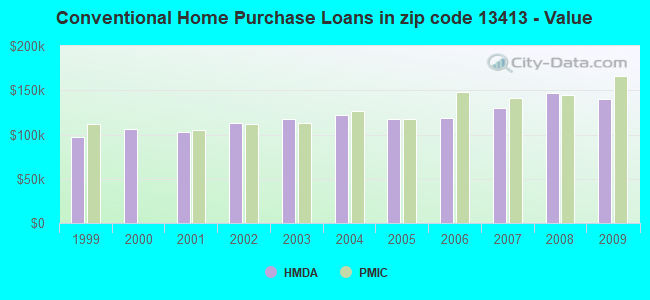
Estimated median house/condo value in 2022: $214,221
13413:
$214,221
New York:
$400,400
According to our research of New York and other state lists, there were 3 registered sex offenders living in 13413 zip code as of April 19, 2024. The ratio of all residents to sex offenders in zip code 13413 is 5,535 to 1. The ratio of registered sex offenders to all residents in this zip code is much lower than the state average.
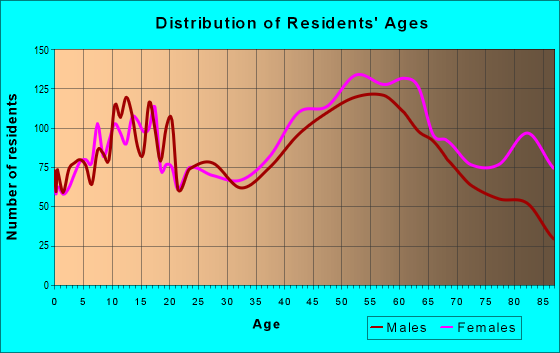
Median resident age:
This zip code:
49.0 years
New York median age:
40.0 years
Average household size:
This zip code:
2.2 people
New York:
2.5 people
Averages for the 2020 tax year for zip code 13413, filed in 2021:
Average Adjusted Gross Income (AGI) in 2020: $98,081 (Individual Income Tax Returns)
Here:
$98,081
State:
$90,930
Salary/wage: $76,230 (reported on 76.9% of returns)
Here:
$76,230
State:
$72,104
(% of AGI for various income ranges: 1099.5% for AGIs below $25k, 3436.5% for AGIs $25k-50k, 6283.4% for AGIs $50k-75k, 9530.0% for AGIs $75k-100k, 17907.7% for AGIs $100k-200k, 94680.6% for AGIs over 200k)
Taxable interest for individuals: $2,190 (reported on 55.5% of returns)
This zip code:
$2,190
New York:
$3,075
(% of AGI for various income ranges: 36.6% for AGIs below $25k, 38.8% for AGIs $25k-50k, 115.5% for AGIs $50k-75k, 87.0% for AGIs $75k-100k, 226.1% for AGIs $100k-200k, 3211.2% for AGIs over 200k)
Ordinary dividends: $8,344 (reported on 32.9% of returns)
Here:
$8,344
State:
$11,095
(% of AGI for various income ranges: 58.5% for AGIs below $25k, 77.0% for AGIs $25k-50k, 172.1% for AGIs $50k-75k, 233.8% for AGIs $75k-100k, 596.9% for AGIs $100k-200k, 7354.7% for AGIs over 200k)
Net capital gain/loss in AGI: +$22,963 (reported on 27.7% of returns)
Here:
+$22,963
State:
+$44,925
(% of AGI for various income ranges: 23.7% for AGIs below $25k, 51.8% for AGIs $25k-50k, 167.0% for AGIs $50k-75k, 299.1% for AGIs $75k-100k, 639.3% for AGIs $100k-200k, 24117.6% for AGIs over 200k)
Profit/loss from business: +$24,506 (reported on 13.5% of returns)
Here:
+$24,506
State:
+$14,940
(% of AGI for various income ranges: 92.6% for AGIs below $25k, 95.9% for AGIs $25k-50k, 123.4% for AGIs $50k-75k, 202.1% for AGIs $75k-100k, 655.3% for AGIs $100k-200k, 9584.7% for AGIs over 200k)
Taxable individual retirement arrangement distribution: $20,259 (reported on 14.3% of returns)
13413:
$20,259
New York:
$19,609
(% of AGI for various income ranges: 110.9% for AGIs below $25k, 153.2% for AGIs $25k-50k, 382.6% for AGIs $50k-75k, 452.3% for AGIs $75k-100k, 937.7% for AGIs $100k-200k, 3922.9% for AGIs over 200k)
Self-employed (Keogh) retirement plans: $35,970 (reported on 1.3% of returns)
13413:
$35,970
New York:
$32,497
(% of AGI for various income ranges: 100.5% for AGIs $100k-200k, 1625.3% for AGIs over 200k)
Total itemized deductions: $39,758 (reported on 7.2% of returns)
Here:
$39,758
State:
$39,326
(% of AGI for various income ranges: 70.8% for AGIs below $25k, 91.4% for AGIs $25k-50k, 240.0% for AGIs $50k-75k, 295.3% for AGIs $75k-100k, 571.4% for AGIs $100k-200k, 7414.7% for AGIs over 200k)
Charity contributions: $16,098 (reported on 5.8% of returns)
Here:
$16,098
State:
$15,420
(% of AGI for various income ranges: 8.9% for AGIs $25k-50k, 19.6% for AGIs $50k-75k, 46.0% for AGIs $75k-100k, 128.4% for AGIs $100k-200k, 3434.7% for AGIs over 200k)
Taxes paid: $8,502 (reported on 7.1% of returns)
13413:
$8,502
State:
$9,183
(% of AGI for various income ranges: 7.4% for AGIs below $25k, 19.8% for AGIs $25k-50k, 69.5% for AGIs $50k-75k, 97.2% for AGIs $75k-100k, 168.6% for AGIs $100k-200k, 1173.5% for AGIs over 200k)
Earned income credit: $1,867 (reported on 7.2% of returns)
Here:
$1,867
State:
$2,138
(% of AGI for various income ranges: 49.0% for AGIs below $25k, 40.9% for AGIs $25k-50k)
Percentage of individuals using paid preparers for their 2020 taxes: 94.8%
Here:
95%
State:
95%
(% for various income ranges: 91.9% for AGIs below $25k, 95.1% for AGIs $25k-50k, 94.9% for AGIs $50k-75k, 95.4% for AGIs $75k-100k, 96.8% for AGIs $100k-200k, 97.0% for AGIs over 200k)
Averages for the 2012 tax year for zip code 13413, filed in 2013:
Average Adjusted Gross Income (AGI) in 2012: $80,126 (Individual Income Tax Returns)
Here:
$80,126
State:
$77,088
Salary/wage: $65,154 (reported on 77.5% of returns)
Here:
$65,154
State:
$60,593
(% of AGI for various income ranges: 63.2% for AGIs below $25k, 67.0% for AGIs $25k-50k, 67.4% for AGIs $50k-75k, 67.3% for AGIs $75k-100k, 71.8% for AGIs $100k-200k, 52.7% for AGIs over 200k)
Taxable interest for individuals: $1,649 (reported on 59.5% of returns)
This zip code:
$1,649
New York:
$3,125
(% of AGI for various income ranges: 2.2% for AGIs below $25k, 1.3% for AGIs $25k-50k, 0.9% for AGIs $50k-75k, 0.9% for AGIs $75k-100k, 0.9% for AGIs $100k-200k, 1.6% for AGIs over 200k)
Ordinary dividends: $7,327 (reported on 37.2% of returns)
Here:
$7,327
State:
$10,299
(% of AGI for various income ranges: 3.7% for AGIs below $25k, 2.3% for AGIs $25k-50k, 2.0% for AGIs $50k-75k, 2.8% for AGIs $75k-100k, 2.4% for AGIs $100k-200k, 5.0% for AGIs over 200k)
Net capital gain/loss in AGI: +$7,006 (reported on 25.1% of returns)
Here:
+$7,006
State:
+$42,474
(% of AGI for various income ranges: 0.5% for AGIs $25k-50k, 0.4% for AGIs $50k-75k, 0.7% for AGIs $75k-100k, 1.2% for AGIs $100k-200k, 4.7% for AGIs over 200k)
Profit/loss from business: +$27,821 (reported on 13.9% of returns)
Here:
+$27,821
State:
+$16,168
(% of AGI for various income ranges: 3.9% for AGIs below $25k, 2.1% for AGIs $25k-50k, 2.6% for AGIs $50k-75k, 1.6% for AGIs $75k-100k, 3.7% for AGIs $100k-200k, 8.1% for AGIs over 200k)
Taxable individual retirement arrangement distribution: $15,203 (reported on 16.1% of returns)
13413:
$15,203
New York:
$17,621
(% of AGI for various income ranges: 5.7% for AGIs below $25k, 3.6% for AGIs $25k-50k, 3.6% for AGIs $50k-75k, 3.0% for AGIs $75k-100k, 3.4% for AGIs $100k-200k, 2.2% for AGIs over 200k)
Self-employment retirement plans: $26,754 (reported on 1.7% of returns)
13413:
$26,754
New York:
$27,330
Total itemized deductions: $27,020 (18% of AGI, reported on 38.7% of returns)
Here:
$27,020
State:
$34,985
Here:
17.8% of AGI
State:
21.3% of AGI
(% of AGI for various income ranges: 9.7% for AGIs below $25k, 8.8% for AGIs $25k-50k, 10.7% for AGIs $50k-75k, 12.0% for AGIs $75k-100k, 14.8% for AGIs $100k-200k, 14.3% for AGIs over 200k)
Charity contributions: $3,808 (reported on 33.8% of returns)
Here:
$3,808
State:
$5,572
(% of AGI for various income ranges: 0.6% for AGIs below $25k, 0.9% for AGIs $25k-50k, 1.1% for AGIs $50k-75k, 1.3% for AGIs $75k-100k, 1.6% for AGIs $100k-200k, 2.1% for AGIs over 200k)
Taxes paid: $15,234 (reported on 38.5% of returns)
13413:
$15,234
State:
$18,656
(% of AGI for various income ranges: 2.3% for AGIs below $25k, 2.9% for AGIs $25k-50k, 4.7% for AGIs $50k-75k, 5.4% for AGIs $75k-100k, 8.3% for AGIs $100k-200k, 9.8% for AGIs over 200k)
Earned income credit: $1,752 (reported on 7.9% of returns)
Here:
$1,752
State:
$2,230
(% of AGI for various income ranges: 2.8% for AGIs below $25k, 0.6% for AGIs $25k-50k)
Percentage of individuals using paid preparers for their 2012 taxes: 58.0%
Here:
58%
State:
66%
(% for various income ranges: 49.8% for AGIs below $25k, 53.7% for AGIs $25k-50k, 59.5% for AGIs $50k-75k, 63.4% for AGIs $75k-100k, 63.9% for AGIs $100k-200k, 85.7% for AGIs over 200k)
Averages for the 2004 tax year for zip code 13413, filed in 2005:
Average Adjusted Gross Income (AGI) in 2004: $62,697 (Individual Income Tax Returns)
Here:
$62,697
State:
$59,519
Salary/wage: $53,840 (reported on 77.7% of returns)
Here:
$53,840
State:
$50,673
(% of AGI for various income ranges: 94.9% for AGIs below $10k, 58.6% for AGIs $10k-25k, 70.3% for AGIs $25k-50k, 72.0% for AGIs $50k-75k, 73.7% for AGIs $75k-100k, 63.0% for AGIs over 100k)
Taxable interest for individuals: $1,917 (reported on 69.4% of returns)
This zip code:
$1,917
New York:
$2,377
(% of AGI for various income ranges: 8.7% for AGIs below $10k, 5.4% for AGIs $10k-25k, 2.5% for AGIs $25k-50k, 2.0% for AGIs $50k-75k, 1.5% for AGIs $75k-100k, 1.8% for AGIs over 100k)
Taxable dividends: $3,802 (reported on 45.7% of returns)
Here:
$3,802
State:
$5,394
(% of AGI for various income ranges: 11.0% for AGIs below $10k, 3.7% for AGIs $10k-25k, 2.3% for AGIs $25k-50k, 1.9% for AGIs $50k-75k, 2.4% for AGIs $75k-100k, 3.0% for AGIs over 100k)
Net capital gain/loss: +$5,875 (reported on 34.8% of returns)
Here:
+$5,875
State:
+$23,581
(% of AGI for various income ranges: -6.4% for AGIs below $10k, 0.5% for AGIs $10k-25k, 0.7% for AGIs $25k-50k, 0.9% for AGIs $50k-75k, 1.9% for AGIs $75k-100k, 5.3% for AGIs over 100k)
Profit/loss from business: +$24,157 (reported on 13.4% of returns)
Here:
+$24,157
State:
+$13,809
(% of AGI for various income ranges: -4.5% for AGIs below $10k, 3.6% for AGIs $10k-25k, 2.3% for AGIs $25k-50k, 3.2% for AGIs $50k-75k, 2.2% for AGIs $75k-100k, 7.5% for AGIs over 100k)
IRA payment deduction: $3,030 (reported on 3.4% of returns)
13413:
$3,030
New York:
$3,115
(% of AGI for various income ranges: 0.4% for AGIs below $10k, 0.3% for AGIs $10k-25k, 0.4% for AGIs $25k-50k, 0.2% for AGIs $50k-75k, 0.2% for AGIs $75k-100k, 0.1% for AGIs over 100k)
Self-employed pension: $17,322 (reported on 2.0% of returns)
Here:
$17,322
New York:
$19,016
(% of AGI for various income ranges: 0.3% for AGIs $50k-75k, 0.3% for AGIs $75k-100k, 0.9% for AGIs over 100k)
Total itemized deductions: $21,471 (18% of AGI, reported on 39.3% of returns)
Here:
$21,471
State:
$25,864
Here:
18.0% of AGI
State:
21.9% of AGI
(% of AGI for various income ranges: 11.7% for AGIs below $10k, 10.8% for AGIs $10k-25k, 10.3% for AGIs $25k-50k, 12.7% for AGIs $50k-75k, 16.4% for AGIs $75k-100k, 14.0% for AGIs over 100k)
Charity contributions deductions: $3,701 (3% of AGI, reported on 36.7% of returns)
Here:
$3,701
State:
$4,439
Here:
3.0% of AGI
State:
3.6% of AGI
(% of AGI for various income ranges: 0.6% for AGIs below $10k, 1.2% for AGIs $10k-25k, 1.4% for AGIs $25k-50k, 1.6% for AGIs $50k-75k, 2.3% for AGIs $75k-100k, 2.6% for AGIs over 100k)
Total tax: $11,755 (reported on 79.9% of returns)
13413:
$11,755
State:
$11,730
(% of AGI for various income ranges: 2.2% for AGIs below $10k, 4.4% for AGIs $10k-25k, 7.5% for AGIs $25k-50k, 9.5% for AGIs $50k-75k, 10.4% for AGIs $75k-100k, 20.6% for AGIs over 100k)
Earned income credit: $1,379 (reported on 6.2% of returns)
Here:
$1,379
State:
$1,757
Percentage of individuals using paid preparers for their 2004 taxes: 61.9%
Here:
62%
State:
67%
(% for various income ranges: 57.2% for AGIs below $10k, 61.6% for AGIs $10k-25k, 57.8% for AGIs $25k-50k, 62.7% for AGIs $50k-75k, 62.8% for AGIs $75k-100k, 73.3% for AGIs over 100k)
Likely homosexual households (counted as self-reported same-sex unmarried-partner households)
Lesbian couples: 0.1% of all households
Gay men: 0.0% of all households
Household received Food Stamps/SNAP in the past 12 months: 431 Household did not receive Food Stamps/SNAP in the past 12 months: 6,469
Women who had a birth in the past 12 months: 80 (71 now married, 8 unmarried) Women who did not have a birth in the past 12 months: 2,869 (1,557 now married, 1,287 unmarried)
Housing units in zip code 13413 with a mortgage: 2,715 (381 second mortgage, 365 both second mortgage and home equity loan) Houses without a mortgage: 73
Median monthly owner costs for units with a mortgage: $1,708 Median monthly owner costs for units without a mortgage: $659
Residents with income below the poverty level in 2022:
This zip code:
4.6%
Whole state:
14.3%
Residents with income below 50% of the poverty level in 2022:
This zip code:
2.0%
Whole state:
6.8%
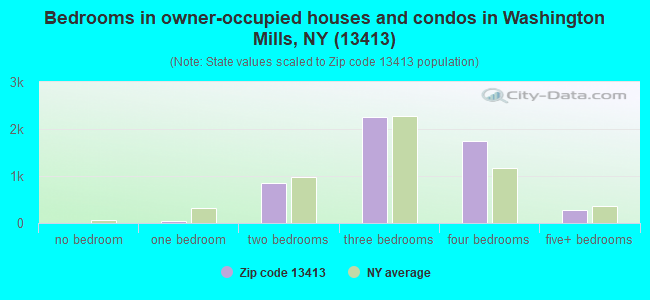
Median number of rooms in houses and condos:
Here:
6.9
State:
6.3
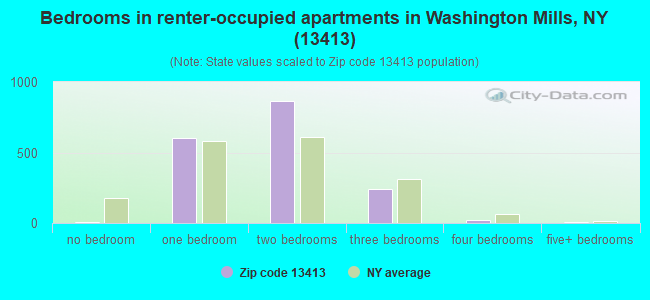
Median number of rooms in apartments:
Here:
3.7
State:
3.8
Notable locations in this zip code not listed on our city pages
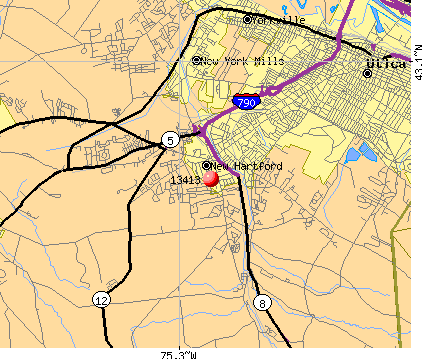
Notable locations in zip code 13413: Higby Hills Country Club (A), Owens Farm (B), Niagara-Mohawk Power Corporation New Hartford Sub-Station (C), Yahnundasis Golf Club (D), Twin Orchards Farms (E), Humphreys Farm (F), Champlin House (G), Players Theatre (H), Butler Memorial Hall (I), Saint Margaret's House (J), New Hartford Fire Department (K), Charles T Sitrin Health Care Center (L), Meadows at Middle Settlement (M), Burrstone House (N), New Hartford Public Library (O). Display/hide their locations on the map
Churches in zip code 13413 include: Our Lady of the Rosary Church (A), Immanuel Baptist Church (B), Hope Alliance Church (C), First Church of Christ (D), First Church of Christ Scientist (E), Messiah United Church of Christ (F), Saint Thomas Church (G), Zion Lutheran Church (H), Saint John The Evangelist Roman Catholic Church (I). Display/hide their locations on the map
Cemeteries: Sacred Heart Cemetery (1), Israe Cemetery (2), Graffenburg Cemetery (3), East Hill Cemetery (4), Calvary Cemetery (5). Display/hide their locations on the map
In group quarters: 929 (-1 institutionalized population)
Size of family households: 2,345 2-persons, 696 3-persons, 985 4-persons, 189 5-persons, 38 6-persons, 27 7-or-more-persons
Size of nonfamily households: 2,292 1-person, 419 2-persons, 14 3-persons
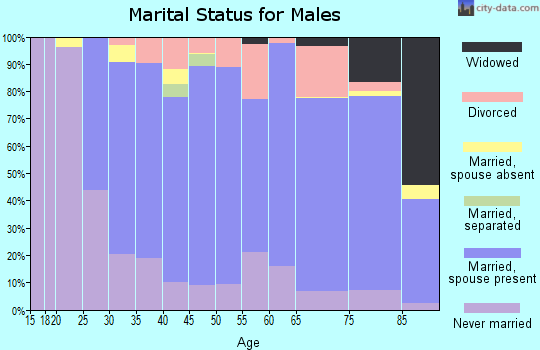
2,306 married couples with children.
334 single-parent households (40 men, 294 women).
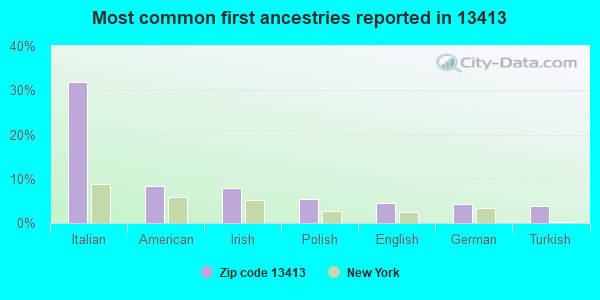
86.6% of residents of 13413 zip code speak English at home.
1.1% of residents speak Spanish at home (52% very well, 20% well, 23% not well, 5% not at all).
6.3% of residents speak other Indo-European language at home (84% very well, 4% well, 6% not well, 6% not at all).
6.3% of residents speak Asian or Pacific Island language at home (79% very well, 15% well, 6% not well).
0.3% of residents speak other language at home (100% very well).
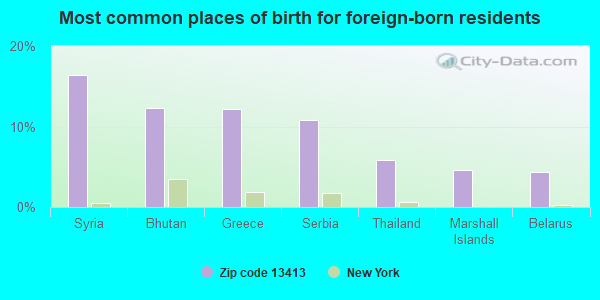
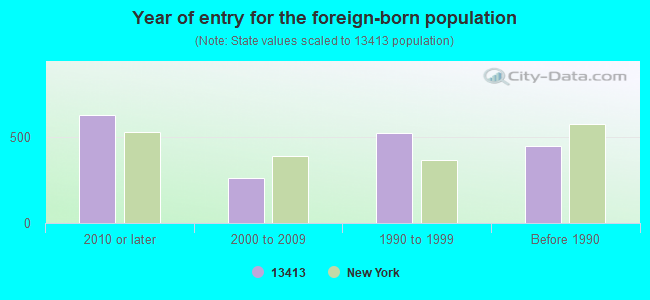
Foreign born population: 1,743 (10.9%) (64.0% of them are naturalized citizens)
Facilities with environmental interests located in this zip code:
HUGHES ES ( in NEW HARTFORD, NY)
(National Center for Education Statistics) - STATE ID-411501060003 Organizations: NEW HARTFORD CSD (SCHOOL DISTRICT)
A-PLUS ATLANTIC FUEL STATION (9272 KELLOG RD in NEW HARTFORD, NY)
(Resource Conservation and Recovery Act (tracking hazardous waste))
ASPEN DENTAL (4626 COMMERCIAL DR SUITE 1 in NEW HARTFORD, NY)
Conditionally Exempt Small Quantity Generators, less than 100 kg/month of hazardous waste (Resource Conservation and Recovery Act (tracking hazardous waste)) Organizations: ASPEN DENTAL ASSOC OF NY PC (CONTACT/OPERATOR)
HOME DEPOT USA INC HD1254 (545 FRENCH RD in NEW HARTFORD, NY)
Conditionally Exempt Small Quantity Generators, less than 100 kg/month of hazardous waste (Resource Conservation and Recovery Act (tracking hazardous waste)) Alternative names: HOME DEPOT THE 1254
Housing units lacking complete plumbing facilities: 0.1% Housing units lacking complete kitchen facilities: 0.5%
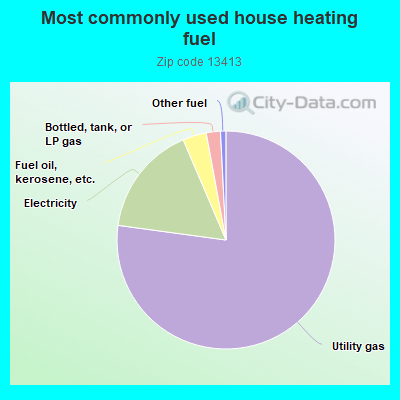
77.0%Utility gas
16.4%Electricity
3.5%Fuel oil, kerosene, etc.
2.1%Bottled, tank, or LP gas
0.8%Other fuel
Population in 1990: 14,035. Population change in the 1990s: +1,836 (+13.1%).
Place of birth for U.S.-born residents:
This state: 12,113
Northeast: 1,121
Midwest: 362
South: 347
West: 194
63% of the 13413 zip code residents lived in the same house 5 years ago. Out of people who lived in different houses, 75% lived in this county. Out of people who lived in different counties, 50% lived in New York.
91% of the 13413 zip code residents lived in the same house 1 year ago. Out of people who lived in different houses, 56% moved from this county. Out of people who lived in different houses, 32% moved from different county within same state. Out of people who lived in different houses, 11% moved from different state.
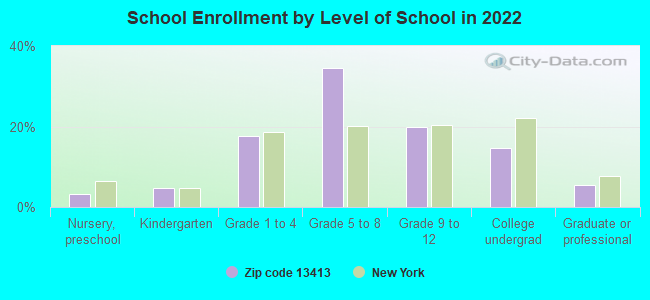
Private vs. public school enrollment:
Students in private schools in grades 1 to 8 (elementary and middle school): 52
Here:
3.2%
New York:
15.6%
Students in private schools in grades 9 to 12 (high school): 6
Here:
1.0%
New York:
15.0%
Students in private undergraduate colleges: 160
Here:
34.2%
New York:
39.2%
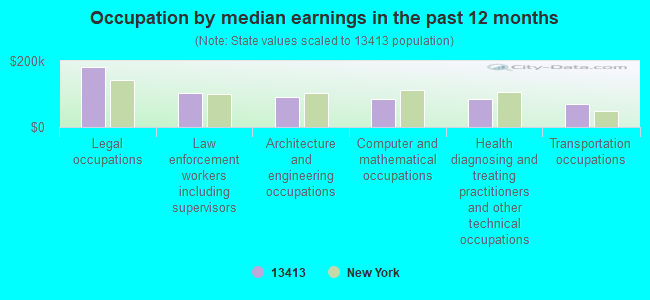
Occupation by median earnings in the past 12 months ($)
181,080Legal occupations
102,724Law enforcement workers including supervisors
90,220Architecture and engineering occupations
85,140Computer and mathematical occupations
83,928Health diagnosing and treating practitioners and other technical occupations
69,112Transportation occupations
Companies with federal contracts located in this zip code (NEW HARTFORD, NY):
PAR TECHNOLOGY CORPORATION (8383 SENECA TPKE STE 2) : $10,840,553 in 37 contractsfrom 1999 to 2002
Contracts for Other Defense -- Engineering Development (R&D), Other Defense -- Advanced Development (R&D) by Air Force Signed by year:2000: $3,757,367; 2001: $4,568,710; 2002: $2,125,440; 2003: $0; 2004: $0; 2005: $0; 2006: $0.
Biggest contracts:
$1,824,000 with Air Force for Other Defense -- Engineering Development (R&D). Signed on 2000-02-10. Completion date: 2002-09-04.
$1,135,555, same as above.Signed on 2001-01-03. Completion date: 2002-09-04.
$1,105,190, same as above.Signed on 2001-02-26. Completion date: 2002-09-04.
$648,028, same as above.Signed on 2001-01-29. Completion date: 2002-09-04.
POLATIN CORPORATION (57 JANET TERRACE; small business) : $2,813,047 in 10 contractsfrom 2001 to 2006
Contracts for Defense Missile and Space Systems -- Engineering Development (R&D), Weapons -- Management and Support (R&D), Other Defense -- Applied Research and Exploratory Development (R&D), Defense Missile and Space Systems -- Management and Support (R&D), and moreby Air Force, Army Signed by year:2000: $0; 2001: $98,501; 2002: $168,390; 2003: $374,903; 2004: $572,834; 2005: $849,106; 2006: $749,313.
Biggest contracts:
$749,614 with Air Force for Defense Missile and Space Systems -- Engineering Development (R&D). Signed on 2005-04-20. Completion date: 2007-07-28.
$749,313 with Air Force for Weapons -- Management and Support (R&D). Signed on 2006-06-22. Completion date: 2008-06-23.
$374,903 with Army for Other Defense -- Applied Research and Exploratory Development (R&D). Signed on 2003-05-15. Completion date: 2005-08-30.
$373,838, same as above.Signed on 2004-05-26. Completion date: 2005-08-30.
JAG TECHNOLOGIES (3 ESTATES DRIVE; small business) : $787,700 in 8 contractsfrom 2001 to 2006
Contracts for Program Management/Support Services by Air Force Signed by year:2000: $0; 2001: $229,000; 2002: $138,000; 2003: $147,500; 2004: $156,200; 2005: $49,500; 2006: $67,500.
Biggest contracts:
$156,200 with Air Force for Program Management/Support Services. Signed on 2004-11-01. Completion date: 2005-09-30.
$147,500, same as above.Signed on 2003-10-01. Completion date: 2004-09-30.
$138,000, same as above.Signed on 2002-11-06. Completion date: 2003-09-30.
$130,000, same as above.Signed on 2001-10-01. Completion date: 2002-09-30.
RIVERHAWK CORP (215 CLINTON RD; small business) 250 employees, $0 revenue
$67,000 with Navy for Non-nuclear Ship Repair (West) Ship repair (including overhauls and conversions) performed on. non-nuclear propelled and nonpropelled ships west of the 108th meridian. Signed on 2005-03-21. Completion date: 2005-05-16.
SPECIAL METALS CORPORATION (4317 MIDDLE SETTLEMENT RD)
$24,871 with Air Force for Structural Shapes, Nonferrous Base Metal. Signed on 2003-02-13. Completion date: 2003-03-17.
ADVANTECHCNY LLC (9273 KELLOGG ROAD - SUITE; small business) : $20,388 in 3 contractsfrom 2005 to 2006
$8,995 with Air Force for ADPE System Configuration. Signed on 2005-09-26. Completion date: 2005-10-26.
$5,996, same as above.Signed on 2006-02-09. Completion date: 2006-03-09.
$5,397, same as above.Signed on 2005-09-26. Completion date: 2005-10-26.
Top industries in this zip code by the number of employees in 2005:
Health Care and Social Assistance: General Medical and Surgical Hospitals (over 1000 employees: 1 establishment)
Health Care and Social Assistance: Nursing Care Facilities (250-499: 3, 50-99: 1)
Administrative and Support and Waste Management and Remediation Services: Temporary Help Services (500-999: 1, 250-499: 1, 20-49: 1)
2002 - 2018 National Fire Incident Reporting System (NFIRS) incidents
Based on the data from the years 2002 - 2018 the average number of fires per year is 39. The highest number of fire incidents - 53 took place in 2010, and the least - 25 in 2005. The data has a rising trend.
When looking into fire subcategories, the most incidents belonged to: Structure Fires (60.3%), and Mobile Property/Vehicle Fires (18.6%).
Fire incident types reported to NFIRS in Zip Code 13413
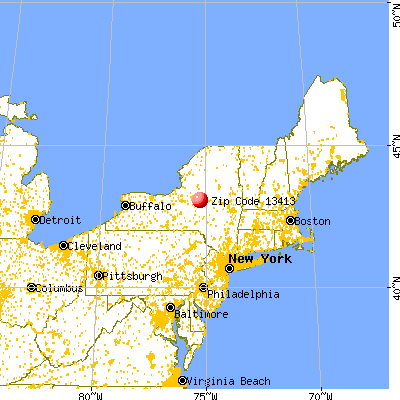


 Nearest zip codes: 13319, 13417, 13495, 13501, 13456, 13492.
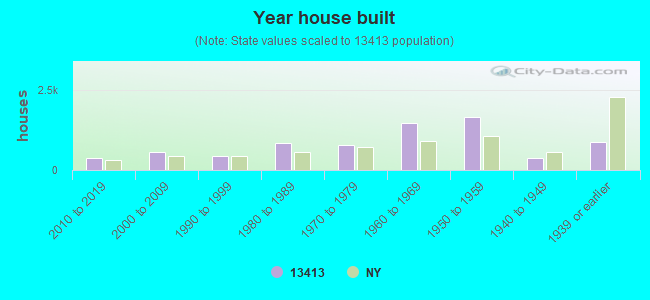


 Based on the data from the years 2002 - 2018 the average number of fires per year is 39. The highest number of fire incidents - 53 took place in 2010, and the least - 25 in 2005. The data has a rising trend.
 When looking into fire subcategories, the most incidents belonged to: Structure Fires (60.3%), and Mobile Property/Vehicle Fires (18.6%).