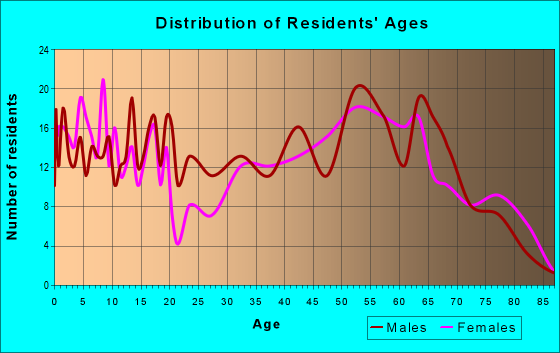
Estimated zip code population in 2022: 2,221 Zip code population in 2010: 2,211 Zip code population in 2000: 2,239
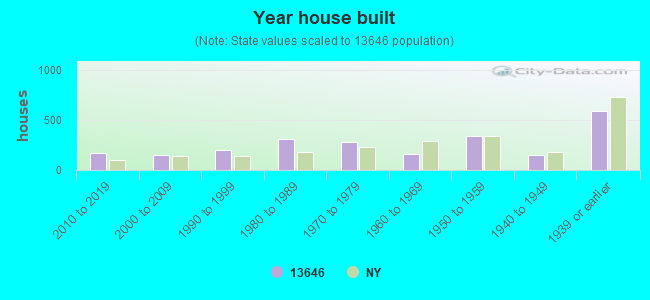
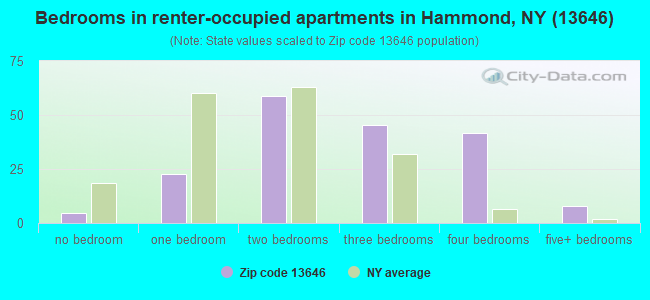
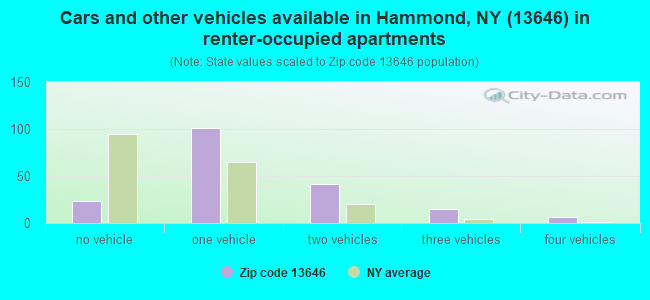
Houses and condos: 2,341 Renter-occupied apartments: 184
% of renters here:
22%
State:
46%
March 2022 cost of living index in zip code 13646: 94.1 (less than average, U.S. average is 100)
Land area: 107.5 sq. mi. Water area: 10.0 sq. mi.
Population density: 21 people per square mile
(very low).
OSM Map
General Map
Google Map
MSN Map
OSM Map
General Map
Google Map
MSN Map
OSM Map
General Map
Google Map
MSN Map
OSM Map
General Map
Google Map
MSN Map
Please wait while loading the map...
Real estate property taxes paid for housing units in 2022:
This zip code:
1.9% ($2,443)
New York:
1.5% ($6,180)
Median real estate property taxes paid for housing units with mortgages in 2022: $3,077 (2.0%) Median real estate property taxes paid for housing units with no mortgage in 2022: $1,869 (1.6%)
Business Search- 14 Million verified businesses
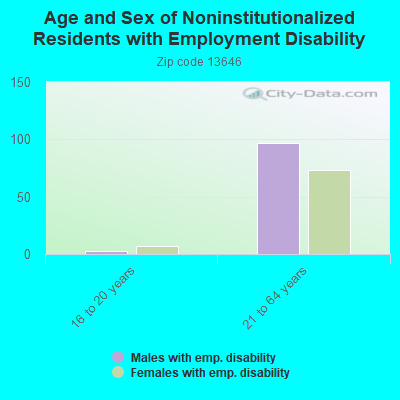
Males: 1,166
(52.5%)
Females: 1,054
(47.5%)
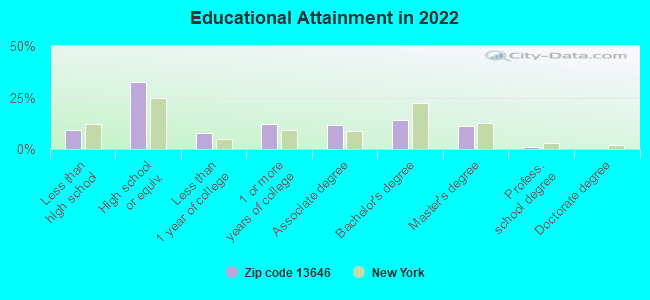
For population 25 years and over in 13646:
High school or higher: 89.8%
Bachelor's degree or higher: 26.4%
Graduate or professional degree: 12.3%
Unemployed: 4.3%
Mean travel time to work (commute): 31.9 minutes
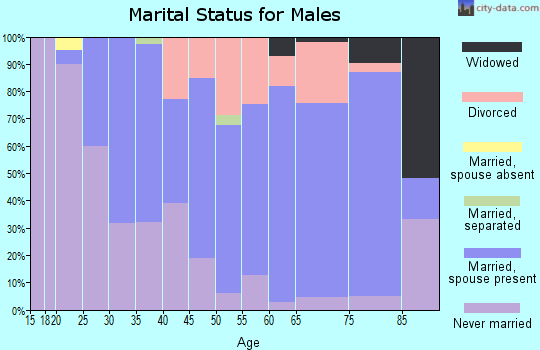
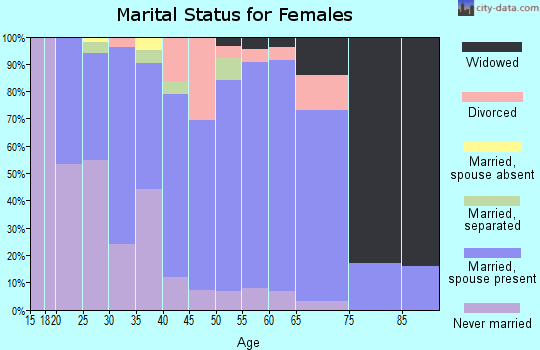
For population 15 years and over in 13646:
Never married: 33.4%
Now married: 53.2%
Separated: 0.5%
Widowed: 3.8%
Divorced: 9.1%
Zip code 13646 compared to state average:
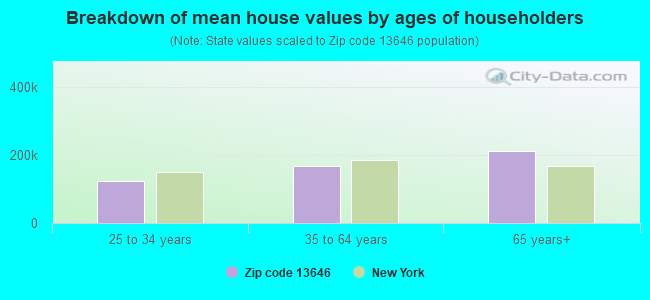
Median house value significantly below state average.
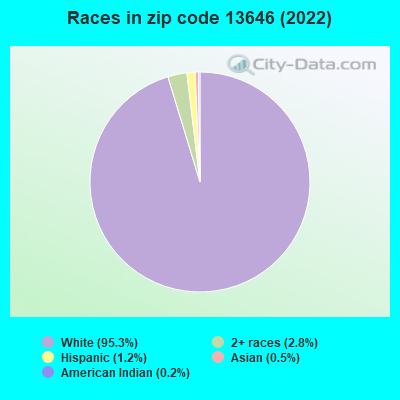
Black race population percentage significantly below state average.
Hispanic race population percentage significantly below state average.
Median age above state average.
Foreign-born population percentage significantly below state average.
Renting percentage below state average.
Length of stay since moving in above state average.
Number of college students below state average.
Percentage of population with a bachelor's degree or higher below state average.
Averages for the 2020 tax year for zip code 13646, filed in 2021:
Average Adjusted Gross Income (AGI) in 2020: $53,622 (Individual Income Tax Returns)
Here:
$53,622
State:
$90,930
Salary/wage: $43,950 (reported on 76.9% of returns)
Here:
$43,950
State:
$72,104
(% of AGI for various income ranges: 1062.1% for AGIs below $25k, 2993.0% for AGIs $25k-50k, 5001.0% for AGIs $50k-75k, 9718.0% for AGIs $75k-100k, 17671.4% for AGIs $100k-200k)
Taxable interest for individuals: $685 (reported on 37.4% of returns)
This zip code:
$685
New York:
$3,075
(% of AGI for various income ranges: 14.6% for AGIs below $25k, 21.5% for AGIs $25k-50k, 42.0% for AGIs $50k-75k, 62.0% for AGIs $75k-100k, 117.1% for AGIs $100k-200k)
Ordinary dividends: $2,650 (reported on 17.6% of returns)
Here:
$2,650
State:
$11,095
(% of AGI for various income ranges: 24.2% for AGIs below $25k, 43.0% for AGIs $25k-50k, 78.0% for AGIs $50k-75k, 148.0% for AGIs $75k-100k, 182.9% for AGIs $100k-200k)
Net capital gain/loss in AGI: +$5,569 (reported on 14.3% of returns)
Here:
+$5,569
State:
+$44,925
(% of AGI for various income ranges: 2.5% for AGIs below $25k, 105.0% for AGIs $25k-50k, 260.0% for AGIs $75k-100k, 540.0% for AGIs $100k-200k)
Profit/loss from business: +$7,121 (reported on 15.4% of returns)
Here:
+$7,121
State:
+$14,940
(% of AGI for various income ranges: 32.5% for AGIs below $25k, 132.0% for AGIs $25k-50k, 128.0% for AGIs $50k-75k, 752.9% for AGIs $100k-200k)
Taxable individual retirement arrangement distribution: $14,538 (reported on 8.8% of returns)
13646:
$14,538
New York:
$19,609
(% of AGI for various income ranges: 112.5% for AGIs below $25k, 320.0% for AGIs $50k-75k, 1146.0% for AGIs $75k-100k)
Earned income credit: $2,260 (reported on 16.5% of returns)
Here:
$2,260
State:
$2,138
(% of AGI for various income ranges: 90.8% for AGIs below $25k, 60.5% for AGIs $25k-50k)
Percentage of individuals using paid preparers for their 2020 taxes: 97.8%
Here:
98%
State:
95%
(% for various income ranges: 97.0% for AGIs below $25k, 95.8% for AGIs $25k-50k, 100.0% for AGIs $50k-75k, 100.0% for AGIs $75k-100k, 100.0% for AGIs $100k-200k)
Averages for the 2012 tax year for zip code 13646, filed in 2013:
Average Adjusted Gross Income (AGI) in 2012: $39,421 (Individual Income Tax Returns)
Here:
$39,421
State:
$77,088
Salary/wage: $33,793 (reported on 79.8% of returns)
Here:
$33,793
State:
$60,593
(% of AGI for various income ranges: 72.6% for AGIs below $25k, 74.4% for AGIs $25k-50k, 71.4% for AGIs $50k-75k, 72.1% for AGIs $75k-100k, 54.3% for AGIs $100k-200k)
Taxable interest for individuals: $766 (reported on 37.2% of returns)
This zip code:
$766
New York:
$3,125
(% of AGI for various income ranges: 1.4% for AGIs below $25k, 0.5% for AGIs $25k-50k, 0.8% for AGIs $50k-75k, 0.5% for AGIs $75k-100k, 0.6% for AGIs $100k-200k)
Ordinary dividends: $2,247 (reported on 18.1% of returns)
Here:
$2,247
State:
$10,299
(% of AGI for various income ranges: 0.9% for AGIs below $25k, 1.1% for AGIs $25k-50k, 1.3% for AGIs $50k-75k, 0.7% for AGIs $75k-100k, 1.1% for AGIs $100k-200k)
Net capital gain/loss in AGI: +$4,400 (reported on 14.9% of returns)
Here:
+$4,400
State:
+$42,474
(% of AGI for various income ranges: 3.1% for AGIs below $25k, 0.7% for AGIs $25k-50k, 1.7% for AGIs $50k-75k, 3.0% for AGIs $100k-200k)
Profit/loss from business: +$9,029 (reported on 14.9% of returns)
Here:
+$9,029
State:
+$16,168
(% of AGI for various income ranges: 6.2% for AGIs below $25k, 3.5% for AGIs $25k-50k, 1.8% for AGIs $50k-75k, 5.8% for AGIs $100k-200k)
Taxable individual retirement arrangement distribution: $7,156 (reported on 9.6% of returns)
13646:
$7,156
New York:
$17,621
Total itemized deductions: $18,738 (23% of AGI, reported on 17.0% of returns)
Here:
$18,738
State:
$34,985
Here:
22.8% of AGI
State:
21.3% of AGI
(% of AGI for various income ranges: 7.1% for AGIs $25k-50k, 6.6% for AGIs $50k-75k, 9.3% for AGIs $75k-100k, 14.7% for AGIs $100k-200k)
Charity contributions: $2,400 (reported on 10.6% of returns)
Here:
$2,400
State:
$5,572
(% of AGI for various income ranges: 0.5% for AGIs below $25k, 0.5% for AGIs $50k-75k, 0.7% for AGIs $75k-100k, 1.4% for AGIs $100k-200k)
Taxes paid: $7,944 (reported on 17.0% of returns)
13646:
$7,944
State:
$18,656
(% of AGI for various income ranges: 2.2% for AGIs $25k-50k, 2.9% for AGIs $50k-75k, 3.3% for AGIs $75k-100k, 7.5% for AGIs $100k-200k)
Earned income credit: $2,186 (reported on 22.3% of returns)
Here:
$2,186
State:
$2,230
(% of AGI for various income ranges: 6.3% for AGIs below $25k, 1.3% for AGIs $25k-50k)
Percentage of individuals using paid preparers for their 2012 taxes: 59.6%
Here:
60%
State:
66%
(% for various income ranges: 54.3% for AGIs below $25k, 59.1% for AGIs $25k-50k, 66.7% for AGIs $50k-75k, 75.0% for AGIs $75k-100k, 66.7% for AGIs $100k-200k)
Averages for the 2004 tax year for zip code 13646, filed in 2005:
Average Adjusted Gross Income (AGI) in 2004: $34,658 (Individual Income Tax Returns)
Here:
$34,658
State:
$59,519
Salary/wage: $28,854 (reported on 78.5% of returns)
Here:
$28,854
State:
$50,673
(% of AGI for various income ranges: 92.1% for AGIs below $10k, 72.5% for AGIs $10k-25k, 74.1% for AGIs $25k-50k, 76.1% for AGIs $50k-75k, 67.8% for AGIs $75k-100k, 37.5% for AGIs over 100k)
Taxable interest for individuals: $1,257 (reported on 48.2% of returns)
This zip code:
$1,257
New York:
$2,377
(% of AGI for various income ranges: 8.4% for AGIs below $10k, 2.3% for AGIs $10k-25k, 1.9% for AGIs $25k-50k, 0.9% for AGIs $50k-75k, 2.0% for AGIs $75k-100k, 1.0% for AGIs over 100k)
Taxable dividends: $2,306 (reported on 22.7% of returns)
Here:
$2,306
State:
$5,394
(% of AGI for various income ranges: 4.9% for AGIs below $10k, 0.8% for AGIs $10k-25k, 1.7% for AGIs $25k-50k, 0.7% for AGIs $50k-75k, 0.7% for AGIs $75k-100k, 2.5% for AGIs over 100k)
Net capital gain/loss: +$7,040 (reported on 19.3% of returns)
Here:
+$7,040
State:
+$23,581
(% of AGI for various income ranges: -1.9% for AGIs below $10k, 1.3% for AGIs $10k-25k, 2.4% for AGIs $25k-50k, 2.3% for AGIs $50k-75k, 0.6% for AGIs $75k-100k, 11.3% for AGIs over 100k)
Profit/loss from business: +$4,958 (reported on 15.6% of returns)
Here:
+$4,958
State:
+$13,809
(% of AGI for various income ranges: 14.1% for AGIs below $10k, 3.7% for AGIs $10k-25k, 2.7% for AGIs $25k-50k, 1.7% for AGIs $50k-75k, 1.9% for AGIs $75k-100k)
IRA payment deduction: $3,188 (reported on 3.5% of returns)
13646:
$3,188
New York:
$3,115
Total itemized deductions: $16,631 (23% of AGI, reported on 14.1% of returns)
Here:
$16,631
State:
$25,864
Here:
22.7% of AGI
State:
21.9% of AGI
(% of AGI for various income ranges: 4.3% for AGIs $10k-25k, 6.6% for AGIs $25k-50k, 5.2% for AGIs $50k-75k, 6.6% for AGIs $75k-100k, 10.7% for AGIs over 100k)
Charity contributions deductions: $3,359 (4% of AGI, reported on 11.2% of returns)
Here:
$3,359
State:
$4,439
Here:
4.1% of AGI
State:
3.6% of AGI
(% of AGI for various income ranges: 2.1% for AGIs below $10k, 0.4% for AGIs $25k-50k, 0.6% for AGIs $50k-75k, 1.0% for AGIs $75k-100k, 3.0% for AGIs over 100k)
Total tax: $4,485 (reported on 71.1% of returns)
13646:
$4,485
State:
$11,730
(% of AGI for various income ranges: 5.1% for AGIs below $10k, 4.2% for AGIs $10k-25k, 6.3% for AGIs $25k-50k, 9.0% for AGIs $50k-75k, 12.2% for AGIs $75k-100k, 14.8% for AGIs over 100k)
Earned income credit: $1,611 (reported on 20.7% of returns)
Here:
$1,611
State:
$1,757
Percentage of individuals using paid preparers for their 2004 taxes: 67.6%
Here:
68%
State:
67%
(% for various income ranges: 62.8% for AGIs below $10k, 65.0% for AGIs $10k-25k, 71.7% for AGIs $25k-50k, 69.7% for AGIs $50k-75k, 69.2% for AGIs $75k-100k, 85.2% for AGIs over 100k)
Likely homosexual households (counted as self-reported same-sex unmarried-partner households)
Lesbian couples: 0.0% of all households
Gay men: 0.5% of all households
Household received Food Stamps/SNAP in the past 12 months: 139 Household did not receive Food Stamps/SNAP in the past 12 months: 713
Women who had a birth in the past 12 months: 19 (14 now married, 5 unmarried) Women who did not have a birth in the past 12 months: 456 (186 now married, 269 unmarried)
Housing units in zip code 13646 with a mortgage: 305 (34 second mortgage, 10 home equity loan, 24 both second mortgage and home equity loan) Median monthly owner costs for units with a mortgage: $1,266 Median monthly owner costs for units without a mortgage: $502
Residents with income below the poverty level in 2022:
This zip code:
25.8%
Whole state:
14.3%
Residents with income below 50% of the poverty level in 2022:
This zip code:
11.9%
Whole state:
6.8%
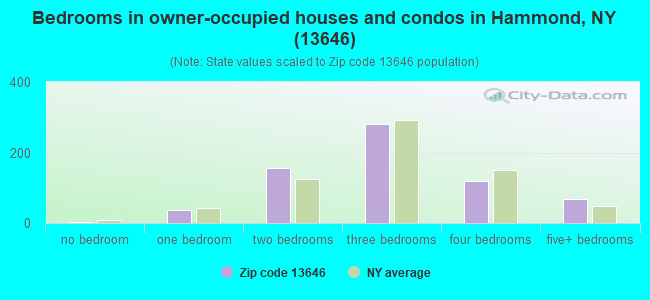
Median number of rooms in houses and condos:
Here:
6.1
State:
6.3
Median number of rooms in apartments:
Here:
6.0
State:
3.8
Notable locations in this zip code not listed on our city pages
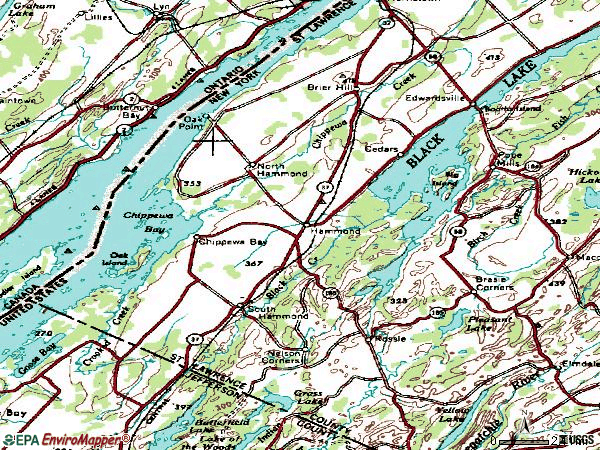
Notable locations in zip code 13646: Stark School Corner (A), Scotch Bush Grange (B), McLear's Cottage Colony and Campground (C), Back Bay Campground (D), Oak Ridge Farm (E), Tulley Farm (F), Harmar Farm (G), Mitchell Farms (H), Martin Brothers Farms (I), Demick Farms (J), Pitcher Farms (K), Denmor Farms (L), Hammond Free Library (M), Hammond Fire and Rescue Department (N). Display/hide their locations on the map
Cemeteries: Rarick Cemetery (1), Pleasant Valley Cemetery (2), Riverside Cemetery (3), Woodworth Cemetery (4), Hammond Cemetery (5), Fineview Cemetery (6), Oldsville Cemetery (7). Display/hide their locations on the map
Rivers and creeks: Black Creek (A), Fish Creek (B), Indian River (C), Jewett Creek (D), Grass Creek (E), Chippewa Creek (F), Bostwick Creek (G). Display/hide their locations on the map
336 married couples with children.
83 single-parent households (26 men, 57 women).
90.7% of residents of 13646 zip code speak English at home.
0.5% of residents speak Spanish at home (80% very well, 20% well).
8.2% of residents speak other Indo-European language at home (30% very well, 17% well, 47% not well, 6% not at all).
0.3% of residents speak Asian or Pacific Island language at home (100% not well).
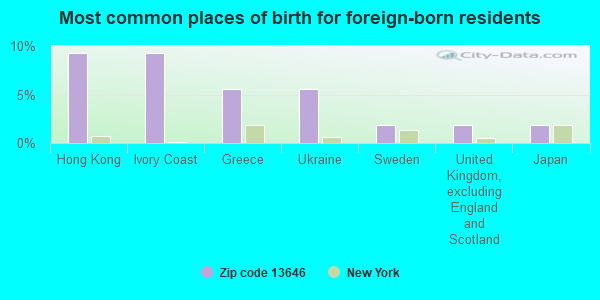
Foreign born population: 54 (2.5%) (70.2% of them are naturalized citizens)
This zip code:
2.5%
Whole state:
22.7%
9%Hong Kong
9%Ivory Coast
6%Greece
6%Ukraine
2%Sweden
2%United Kingdom, excluding England and Scotland
2%Japan
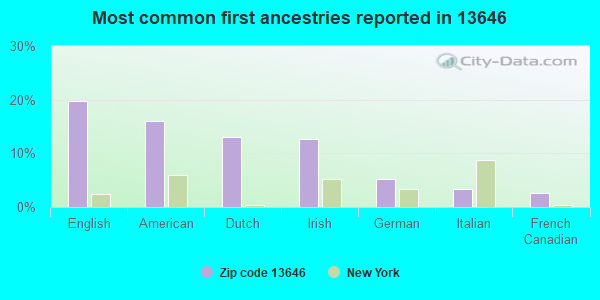
20%English
16%American
13%Dutch
13%Irish
5%German
3%Italian
3%French Canadian
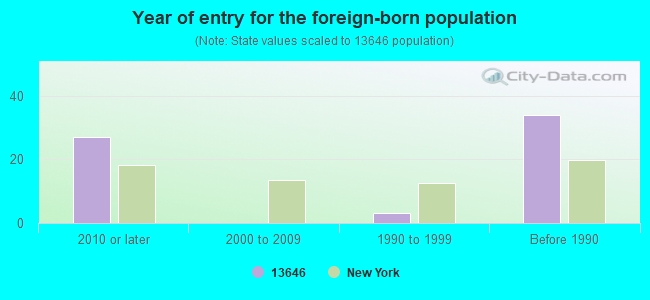
Year of entry for the foreign-born population
272010 or later
02000 to 2009
31990 to 1999
34Before 1990
Facilities with environmental interests located in this zip code:
HAMMOND CENTRAL SCHOOL (MAIN ST in HAMMOND, NY)
STATE MASTER (New York facility tracking) - AIR PROGRAM, REFUSE DISPOSAL, (National Center for Education Statistics) - STATE ID-511201040001 (Resource Conservation and Recovery Act (tracking hazardous waste)) Business SIC and NAICS classification: ELEMENTARY AND SECONDARY SCHOOLS Organizations: HAMMOND CTL SCH DIST (LEGALLY RESPONSIBLE PARTY)
, HAMMOND CSD (SCHOOL DISTRICT)
HAMMOND (V) STP (PO BOX 175 in HAMMOND, NY)
National Pollutant Discharge Elimination System NON-MAJOR (Tracking pollutant discharge elimination systems) - permit Business SIC classification: SEWERAGE SYSTEMS
AGWAY HAMMOND COOP (LAKE ST in HAMMOND, NY)
AIR MINOR (AIRS/AFS) Business SIC classification: NONCLASSIFIABLE ESTABLISHMENTS
HEUVELTON SUB (UNION ST in HAMMOND, NY)
(Resource Conservation and Recovery Act (tracking hazardous waste))
Housing units lacking complete plumbing facilities: 7.5% Housing units lacking complete kitchen facilities: 6.6%
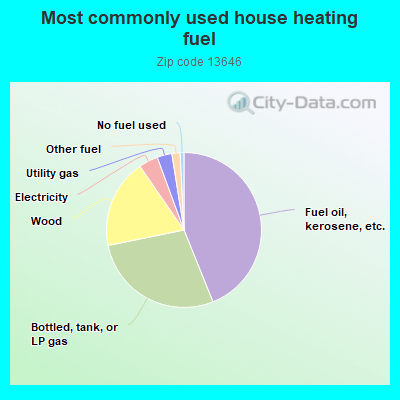
43.9%Fuel oil, kerosene, etc.
27.9%Bottled, tank, or LP gas
18.6%Wood
4.0%Electricity
3.1%Utility gas
1.7%Other fuel
0.8%No fuel used
Population in 1990: 2,287.
Place of birth for U.S.-born residents:
This state: 1,904
Northeast: 80
Midwest: 111
South: 50
West: 4
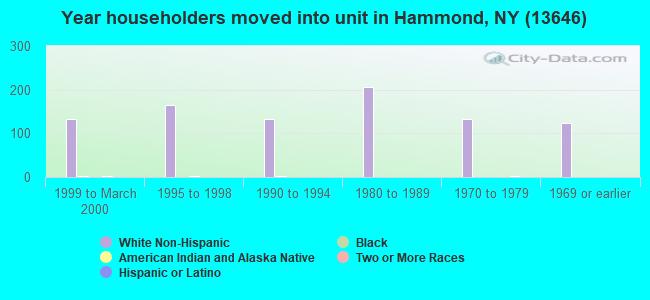
71% of the 13646 zip code residents lived in the same house 5 years ago. Out of people who lived in different houses, 66% lived in this county. Out of people who lived in different counties, 50% lived in New York.
90% of the 13646 zip code residents lived in the same house 1 year ago. Out of people who lived in different houses, 36% moved from this county. Out of people who lived in different houses, 31% moved from different county within same state. Out of people who lived in different houses, 10% moved from different state. Out of people who lived in different houses, 24% moved from abroad.
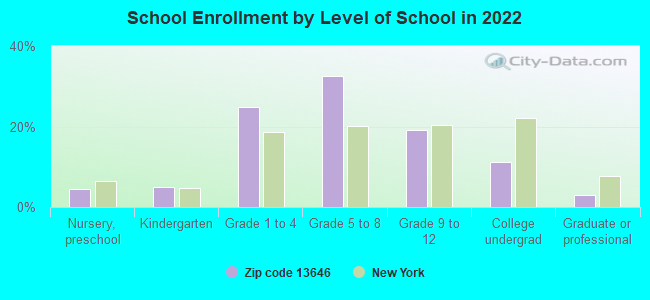
Private vs. public school enrollment:
Students in private schools in grades 1 to 8 (elementary and middle school): 108
Here:
45.7%
New York:
15.6%
Students in private schools in grades 9 to 12 (high school):
Here:
0.0%
New York:
15.0%
Students in private undergraduate colleges: 11
Here:
25.6%
New York:
39.2%
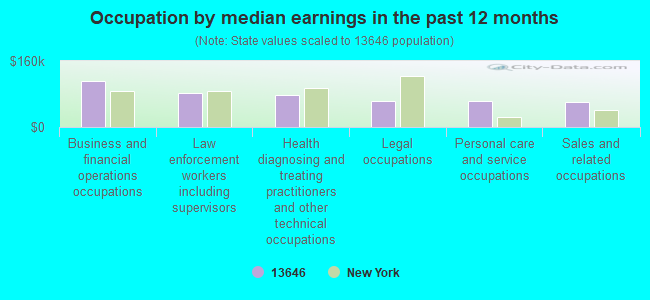
Occupation by median earnings in the past 12 months ($)
110,586Business and financial operations occupations
81,855Law enforcement workers including supervisors
77,352Health diagnosing and treating practitioners and other technical occupations
63,932Legal occupations
63,220Personal care and service occupations
59,965Sales and related occupations
Top industries in this zip code by the number of employees in 2005:
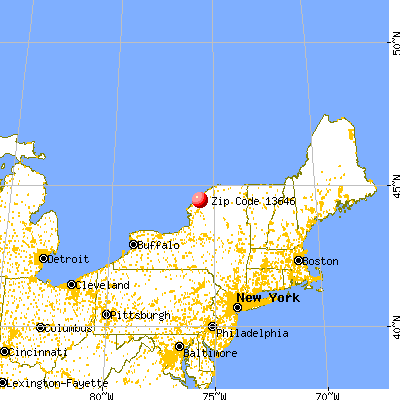


 Nearest zip codes: 13623, 13614, 13664, 13679, 13608, 13633.