Estimated zip code population in 2022: 5,805 Zip code population in 2010: 6,389 Zip code population in 2000: 4,722
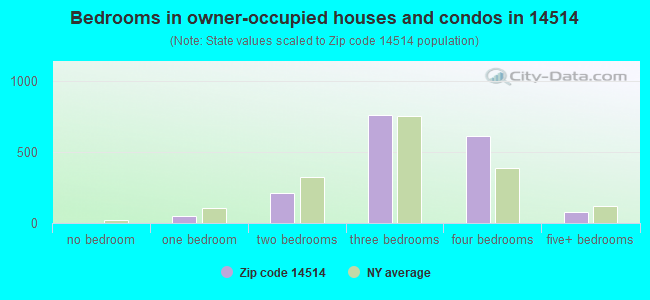
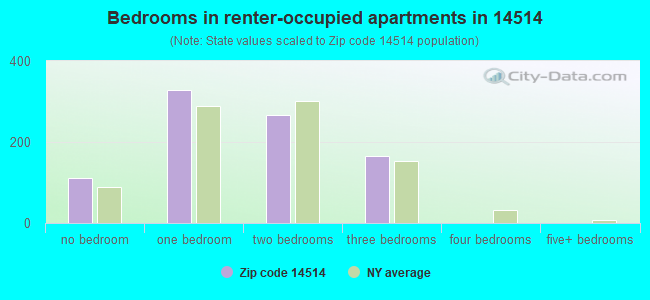
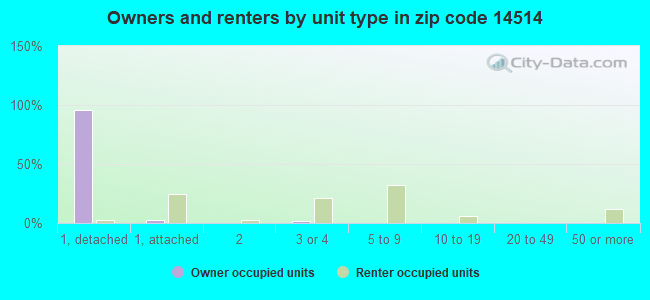
Houses and condos: 2,690 Renter-occupied apartments: 864
% of renters here:
33%
State:
46%
March 2022 cost of living index in zip code 14514: 103.3 (near average, U.S. average is 100)
Land area: 3.7 sq. mi. Water area: 0.0 sq. mi.
Population density: 1,551 people per square mile
(low).
OSM Map
General Map
Google Map
MSN Map
OSM Map
General Map
Google Map
MSN Map
OSM Map
General Map
Google Map
MSN Map
OSM Map
General Map
Google Map
MSN Map
Please wait while loading the map...
Real estate property taxes paid for housing units in 2022:
This zip code:
2.5% ($4,986)
New York:
1.5% ($6,180)
Median real estate property taxes paid for housing units with mortgages in 2022: $4,903 (2.6%) Median real estate property taxes paid for housing units with no mortgage in 2022: $5,161 (2.5%)
Business Search- 14 Million verified businesses
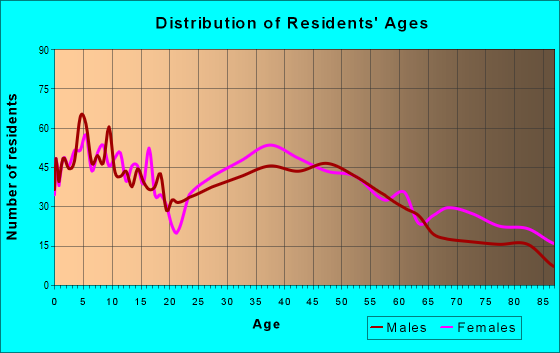
Males: 2,693
(46.4%)
Females: 3,111
(53.6%)
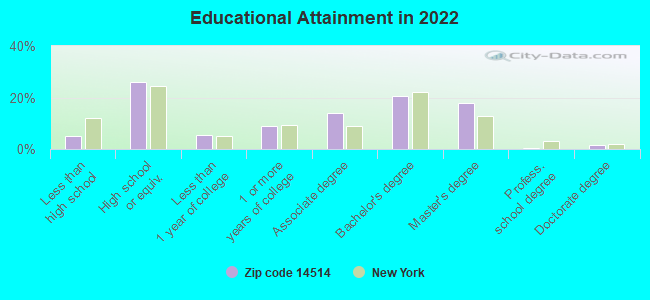
For population 25 years and over in 14514:
High school or higher: 95.4%
Bachelor's degree or higher: 40.8%
Graduate or professional degree: 20.0%
Unemployed: 1.3%
Mean travel time to work (commute): 20.9 minutes
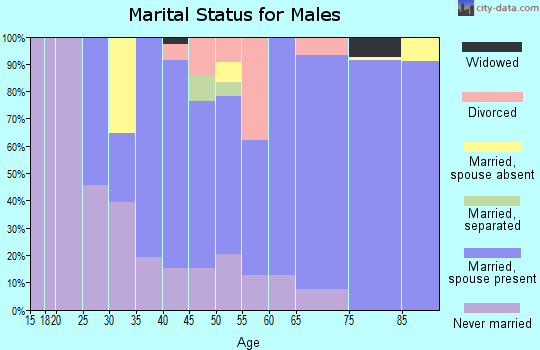
For population 15 years and over in 14514:
Never married: 32.7%
Now married: 51.8%
Separated: 2.2%
Widowed: 6.6%
Divorced: 6.8%
Zip code 14514 compared to state average:
Median house value below state average.
Unemployed percentage significantly below state average.
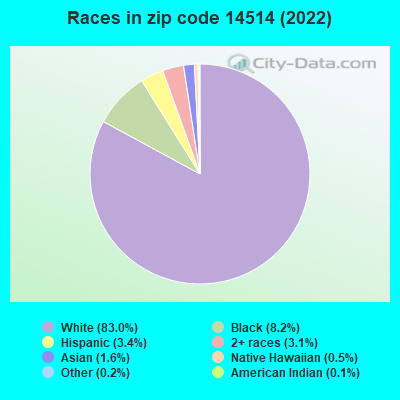
Hispanic race population percentage significantly below state average.
Median age above state average.
Foreign-born population percentage significantly below state average.
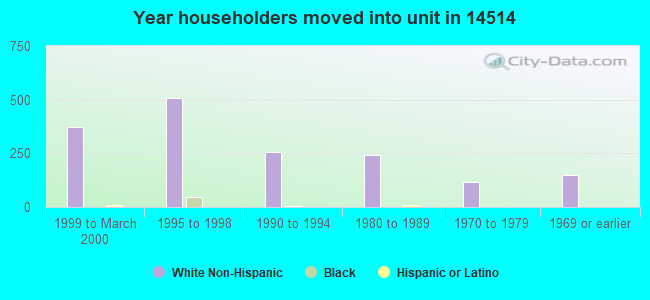
Length of stay since moving in above state average.
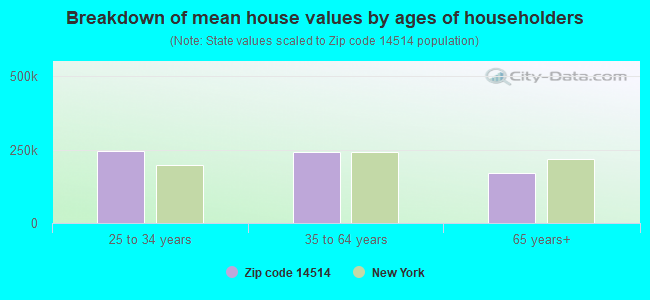
Estimated median house/condo value in 2022: $197,229
14514:
$197,229
New York:
$400,400
According to our research of New York and other state lists, there were 8 registered sex offenders living in 14514 zip code as of April 19, 2024. The ratio of all residents to sex offenders in zip code 14514 is 860 to 1. The ratio of registered sex offenders to all residents in this zip code is near the state average.
Median resident age:
This zip code:
45.0 years
New York median age:
40.0 years
Average household size:
This zip code:
2.2 people
New York:
2.5 people
Averages for the 2020 tax year for zip code 14514, filed in 2021:
Average Adjusted Gross Income (AGI) in 2020: $64,739 (Individual Income Tax Returns)
Here:
$64,739
State:
$90,930
Salary/wage: $59,776 (reported on 83.1% of returns)
Here:
$59,776
State:
$72,104
(% of AGI for various income ranges: 1074.2% for AGIs below $25k, 3539.5% for AGIs $25k-50k, 5916.3% for AGIs $50k-75k, 9235.4% for AGIs $75k-100k, 17012.8% for AGIs $100k-200k, 49575.0% for AGIs over 200k)
Taxable interest for individuals: $608 (reported on 46.7% of returns)
This zip code:
$608
New York:
$3,075
(% of AGI for various income ranges: 19.1% for AGIs below $25k, 26.8% for AGIs $25k-50k, 41.2% for AGIs $50k-75k, 38.8% for AGIs $75k-100k, 82.0% for AGIs $100k-200k, 120.0% for AGIs over 200k)
Ordinary dividends: $2,344 (reported on 21.4% of returns)
Here:
$2,344
State:
$11,095
(% of AGI for various income ranges: 20.7% for AGIs below $25k, 25.9% for AGIs $25k-50k, 83.0% for AGIs $50k-75k, 99.2% for AGIs $75k-100k, 135.5% for AGIs $100k-200k, 562.5% for AGIs over 200k)
Net capital gain/loss in AGI: +$4,981 (reported on 17.5% of returns)
Here:
+$4,981
State:
+$44,925
(% of AGI for various income ranges: 5.1% for AGIs below $25k, 10.5% for AGIs $25k-50k, 99.8% for AGIs $50k-75k, 92.5% for AGIs $75k-100k, 313.2% for AGIs $100k-200k, 2212.5% for AGIs over 200k)
Profit/loss from business: +$8,332 (reported on 10.2% of returns)
Here:
+$8,332
State:
+$14,940
(% of AGI for various income ranges: 74.3% for AGIs below $25k, 28.1% for AGIs $25k-50k, 45.3% for AGIs $50k-75k, 142.9% for AGIs $75k-100k, 405.0% for AGIs $100k-200k)
Taxable individual retirement arrangement distribution: $15,477 (reported on 13.3% of returns)
14514:
$15,477
New York:
$19,609
(% of AGI for various income ranges: 123.1% for AGIs below $25k, 177.1% for AGIs $25k-50k, 278.6% for AGIs $50k-75k, 434.2% for AGIs $75k-100k, 657.2% for AGIs $100k-200k)
Total itemized deductions: $26,842 (reported on 5.7% of returns)
Here:
$26,842
State:
$39,326
(% of AGI for various income ranges: 82.5% for AGIs $25k-50k, 200.7% for AGIs $50k-75k, 300.4% for AGIs $75k-100k, 478.5% for AGIs $100k-200k, 2705.0% for AGIs over 200k)
Charity contributions: $10,247 (reported on 4.5% of returns)
Here:
$10,247
State:
$15,420
(% of AGI for various income ranges: 57.4% for AGIs $50k-75k, 71.7% for AGIs $75k-100k, 191.8% for AGIs $100k-200k, 877.5% for AGIs over 200k)
Taxes paid: $8,368 (reported on 5.7% of returns)
14514:
$8,368
State:
$9,183
(% of AGI for various income ranges: 22.2% for AGIs $25k-50k, 74.0% for AGIs $50k-75k, 121.2% for AGIs $75k-100k, 157.8% for AGIs $100k-200k, 525.0% for AGIs over 200k)
Earned income credit: $1,965 (reported on 9.3% of returns)
Here:
$1,965
State:
$2,138
(% of AGI for various income ranges: 45.2% for AGIs below $25k, 48.6% for AGIs $25k-50k)
Percentage of individuals using paid preparers for their 2020 taxes: 96.1%
Here:
96%
State:
95%
(% for various income ranges: 95.6% for AGIs below $25k, 96.2% for AGIs $25k-50k, 94.6% for AGIs $50k-75k, 97.1% for AGIs $75k-100k, 96.8% for AGIs $100k-200k, 100.0% for AGIs over 200k)
Averages for the 2012 tax year for zip code 14514, filed in 2013:
Average Adjusted Gross Income (AGI) in 2012: $55,618 (Individual Income Tax Returns)
Here:
$55,618
State:
$77,088
Salary/wage: $51,999 (reported on 83.4% of returns)
Here:
$51,999
State:
$60,593
(% of AGI for various income ranges: 69.3% for AGIs below $25k, 74.4% for AGIs $25k-50k, 77.5% for AGIs $50k-75k, 78.0% for AGIs $75k-100k, 82.8% for AGIs $100k-200k, 73.8% for AGIs over 200k)
Taxable interest for individuals: $480 (reported on 53.8% of returns)
This zip code:
$480
New York:
$3,125
(% of AGI for various income ranges: 1.3% for AGIs below $25k, 0.5% for AGIs $25k-50k, 0.6% for AGIs $50k-75k, 0.3% for AGIs $75k-100k, 0.2% for AGIs $100k-200k, 0.5% for AGIs over 200k)
Ordinary dividends: $2,004 (reported on 24.5% of returns)
Here:
$2,004
State:
$10,299
(% of AGI for various income ranges: 1.6% for AGIs below $25k, 0.8% for AGIs $25k-50k, 0.9% for AGIs $50k-75k, 1.0% for AGIs $75k-100k, 0.5% for AGIs $100k-200k, 1.7% for AGIs over 200k)
Net capital gain/loss in AGI: +$3,242 (reported on 15.5% of returns)
Here:
+$3,242
State:
+$42,474
(% of AGI for various income ranges: 1.9% for AGIs $100k-200k, 4.2% for AGIs over 200k)
Profit/loss from business: +$8,715 (reported on 11.7% of returns)
Here:
+$8,715
State:
+$16,168
(% of AGI for various income ranges: 1.9% for AGIs below $25k, 1.6% for AGIs $25k-50k, 2.1% for AGIs $50k-75k, 1.1% for AGIs $75k-100k, 2.6% for AGIs $100k-200k)
Taxable individual retirement arrangement distribution: $11,410 (reported on 14.5% of returns)
14514:
$11,410
New York:
$17,621
(% of AGI for various income ranges: 5.6% for AGIs below $25k, 4.8% for AGIs $25k-50k, 3.8% for AGIs $50k-75k, 2.7% for AGIs $75k-100k, 2.0% for AGIs $100k-200k)
Total itemized deductions: $20,532 (22% of AGI, reported on 40.0% of returns)
Here:
$20,532
State:
$34,985
Here:
22.0% of AGI
State:
21.3% of AGI
(% of AGI for various income ranges: 8.0% for AGIs below $25k, 10.2% for AGIs $25k-50k, 14.3% for AGIs $50k-75k, 16.8% for AGIs $75k-100k, 17.2% for AGIs $100k-200k, 15.4% for AGIs over 200k)
Charity contributions: $2,946 (reported on 35.2% of returns)
Here:
$2,946
State:
$5,572
(% of AGI for various income ranges: 0.9% for AGIs below $25k, 1.4% for AGIs $25k-50k, 1.9% for AGIs $50k-75k, 2.2% for AGIs $75k-100k, 2.1% for AGIs $100k-200k, 1.8% for AGIs over 200k)
Taxes paid: $10,173 (reported on 40.0% of returns)
14514:
$10,173
State:
$18,656
(% of AGI for various income ranges: 2.4% for AGIs below $25k, 4.0% for AGIs $25k-50k, 6.4% for AGIs $50k-75k, 8.1% for AGIs $75k-100k, 9.4% for AGIs $100k-200k, 9.2% for AGIs over 200k)
Earned income credit: $2,036 (reported on 11.4% of returns)
Here:
$2,036
State:
$2,230
(% of AGI for various income ranges: 4.0% for AGIs below $25k, 0.9% for AGIs $25k-50k)
Percentage of individuals using paid preparers for their 2012 taxes: 49.7%
Here:
50%
State:
66%
(% for various income ranges: 41.2% for AGIs below $25k, 47.0% for AGIs $25k-50k, 57.8% for AGIs $50k-75k, 58.3% for AGIs $75k-100k, 54.8% for AGIs $100k-200k, 75.0% for AGIs over 200k)
Averages for the 2004 tax year for zip code 14514, filed in 2005:
Average Adjusted Gross Income (AGI) in 2004: $46,254 (Individual Income Tax Returns)
Here:
$46,254
State:
$59,519
Salary/wage: $43,073 (reported on 85.5% of returns)
Here:
$43,073
State:
$50,673
(% of AGI for various income ranges: 91.5% for AGIs below $10k, 65.6% for AGIs $10k-25k, 76.2% for AGIs $25k-50k, 80.3% for AGIs $50k-75k, 85.5% for AGIs $75k-100k, 80.0% for AGIs over 100k)
Taxable interest for individuals: $771 (reported on 65.6% of returns)
This zip code:
$771
New York:
$2,377
(% of AGI for various income ranges: 3.5% for AGIs below $10k, 2.5% for AGIs $10k-25k, 1.6% for AGIs $25k-50k, 0.7% for AGIs $50k-75k, 0.3% for AGIs $75k-100k, 1.2% for AGIs over 100k)
Taxable dividends: $1,244 (reported on 31.3% of returns)
Here:
$1,244
State:
$5,394
(% of AGI for various income ranges: 4.7% for AGIs below $10k, 1.9% for AGIs $10k-25k, 1.0% for AGIs $25k-50k, 0.7% for AGIs $50k-75k, 0.5% for AGIs $75k-100k, 0.6% for AGIs over 100k)
Net capital gain/loss: +$1,142 (reported on 20.6% of returns)
Here:
+$1,142
State:
+$23,581
(% of AGI for various income ranges: -1.1% for AGIs below $10k, 0.9% for AGIs $10k-25k, 0.6% for AGIs $25k-50k, 0.5% for AGIs $50k-75k, 0.4% for AGIs $75k-100k, 0.6% for AGIs over 100k)
Profit/loss from business: +$4,827 (reported on 10.1% of returns)
Here:
+$4,827
State:
+$13,809
(% of AGI for various income ranges: 3.2% for AGIs below $10k, 2.6% for AGIs $10k-25k, 0.5% for AGIs $25k-50k, 0.9% for AGIs $50k-75k, 0.8% for AGIs $75k-100k, 1.3% for AGIs over 100k)
IRA payment deduction: $2,943 (reported on 2.4% of returns)
14514:
$2,943
New York:
$3,115
Total itemized deductions: $16,723 (23% of AGI, reported on 43.7% of returns)
Here:
$16,723
State:
$25,864
Here:
22.8% of AGI
State:
21.9% of AGI
(% of AGI for various income ranges: 9.6% for AGIs below $10k, 8.2% for AGIs $10k-25k, 12.5% for AGIs $25k-50k, 17.1% for AGIs $50k-75k, 18.9% for AGIs $75k-100k, 17.1% for AGIs over 100k)
Charity contributions deductions: $3,045 (4% of AGI, reported on 41.0% of returns)
Here:
$3,045
State:
$4,439
Here:
4.1% of AGI
State:
3.6% of AGI
(% of AGI for various income ranges: 1.2% for AGIs below $10k, 1.6% for AGIs $10k-25k, 2.4% for AGIs $25k-50k, 2.8% for AGIs $50k-75k, 2.9% for AGIs $75k-100k, 3.0% for AGIs over 100k)
Total tax: $5,400 (reported on 79.6% of returns)
14514:
$5,400
State:
$11,730
(% of AGI for various income ranges: 1.5% for AGIs below $10k, 3.9% for AGIs $10k-25k, 6.7% for AGIs $25k-50k, 8.3% for AGIs $50k-75k, 9.0% for AGIs $75k-100k, 14.5% for AGIs over 100k)
Earned income credit: $1,524 (reported on 9.4% of returns)
Here:
$1,524
State:
$1,757
Percentage of individuals using paid preparers for their 2004 taxes: 56.0%
Here:
56%
State:
67%
(% for various income ranges: 51.5% for AGIs below $10k, 54.5% for AGIs $10k-25k, 55.7% for AGIs $25k-50k, 59.1% for AGIs $50k-75k, 58.1% for AGIs $75k-100k, 59.9% for AGIs over 100k)
Household received Food Stamps/SNAP in the past 12 months: 207 Household did not receive Food Stamps/SNAP in the past 12 months: 2,361
Women who had a birth in the past 12 months: 102 (81 now married, 20 unmarried) Women who did not have a birth in the past 12 months: 1,186 (522 now married, 659 unmarried)
Housing units in zip code 14514 with a mortgage: 1,148 (119 second mortgage, 121 both second mortgage and home equity loan) Houses without a mortgage: 45
Median monthly owner costs for units with a mortgage: $1,597 Median monthly owner costs for units without a mortgage: $690
Residents with income below the poverty level in 2022:
This zip code:
7.6%
Whole state:
14.3%
Residents with income below 50% of the poverty level in 2022:
This zip code:
3.3%
Whole state:
6.8%
Median number of rooms in houses and condos:
Here:
6.9
State:
6.3
Median number of rooms in apartments:
Here:
3.8
State:
3.8
Notable locations in this zip code not listed on our city pages
Notable locations in zip code 14514: Chesbro Center (A), Gruendike Complex (B), Westwood Commons Adult Home (C), Chili Community Center (D), Chili Fire Department Station 2 (E). Display/hide their locations on the map
In group quarters: 194 (-1 institutionalized population)
Size of family households: 809 2-persons, 273 3-persons, 452 4-persons, 51 5-persons
Size of nonfamily households: 815 1-person, 184 2-persons, 13 3-persons
705 married couples with children.
342 single-parent households (89 men, 253 women).
92.9% of residents of 14514 zip code speak English at home.
4.0% of residents speak Spanish at home (71% very well, 26% well, 3% not well).
1.9% of residents speak other Indo-European language at home (88% very well, 8% well, 4% not well).
0.9% of residents speak Asian or Pacific Island language at home (33% very well, 67% well).
0.5% of residents speak other language at home (100% very well).
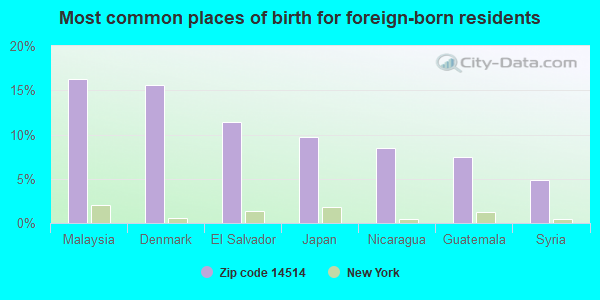
Foreign born population: 307 (5.3%) (61.4% of them are naturalized citizens)
This zip code:
5.3%
Whole state:
22.7%
16%Malaysia
16%Denmark
11%El Salvador
10%Japan
8%Nicaragua
7%Guatemala
5%Syria
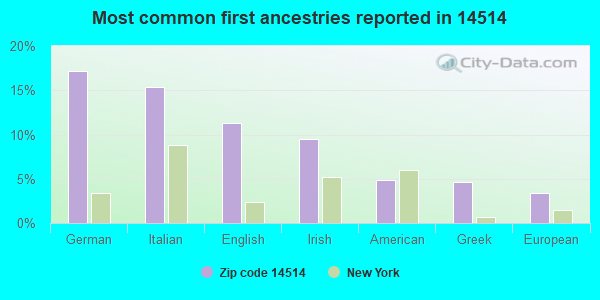
17%German
15%Italian
11%English
10%Irish
5%American
5%Greek
3%European
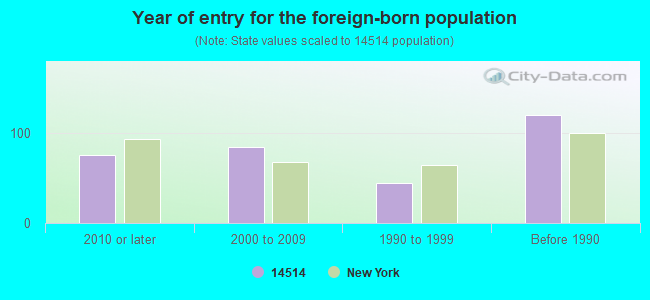
Year of entry for the foreign-born population
762010 or later
852000 to 2009
451990 to 1999
120Before 1990
Facilities with environmental interests located in this zip code:
A M & T (3467 UNION ST in NORTH CHILI, NY)
(Resource Conservation and Recovery Act (tracking hazardous waste))
CHILI FIRE DEPT INC (3310 UNION ST in NORTH CHILI, NY)
(Resource Conservation and Recovery Act (tracking hazardous waste))
AMERADA HESS STATION 32350 (4371 BUFFALO RD in NORTH CHILI, NY)
Conditionally Exempt Small Quantity Generators, less than 100 kg/month of hazardous waste (Resource Conservation and Recovery Act (tracking hazardous waste)) - notification Organizations: AMERADA HESS CORP (CONTACT/OWNER)
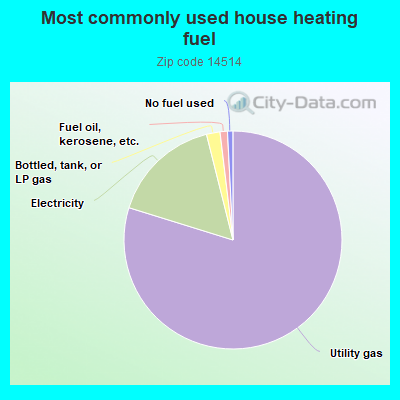
79.8%Utility gas
16.3%Electricity
2.0%Bottled, tank, or LP gas
1.1%Fuel oil, kerosene, etc.
0.8%No fuel used
Population in 1990: 4,014. Population change in the 1990s: +708 (+17.6%).
Place of birth for U.S.-born residents:
This state: 4,525
Northeast: 278
Midwest: 296
South: 235
West: 134
50% of the 14514 zip code residents lived in the same house 5 years ago. Out of people who lived in different houses, 64% lived in this county. Out of people who lived in different counties, 50% lived in New York.
86% of the 14514 zip code residents lived in the same house 1 year ago. Out of people who lived in different houses, 56% moved from this county. Out of people who lived in different houses, 20% moved from different county within same state. Out of people who lived in different houses, 25% moved from different state.
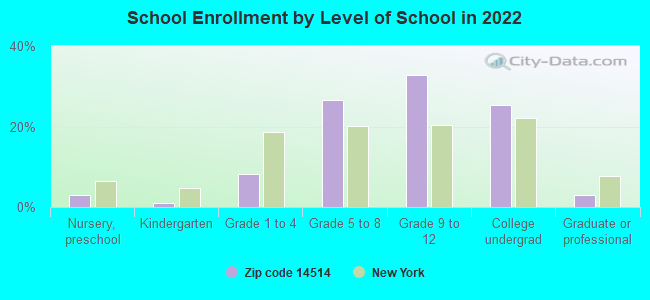
Private vs. public school enrollment:
Students in private schools in grades 1 to 8 (elementary and middle school): 49
Here:
11.3%
New York:
15.6%
Students in private schools in grades 9 to 12 (high school): 49
Here:
12.2%
New York:
15.0%
Students in private undergraduate colleges: 119
Here:
37.4%
New York:
39.2%
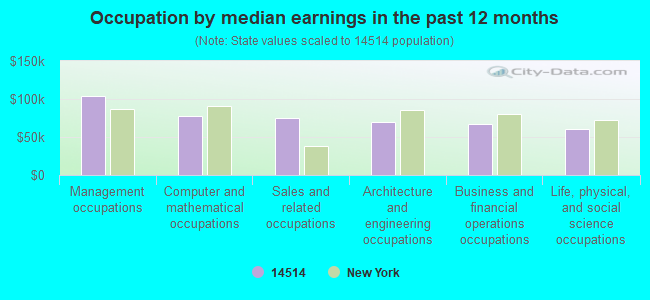
Occupation by median earnings in the past 12 months ($)
104,030Management occupations
77,395Computer and mathematical occupations
74,385Sales and related occupations
69,636Architecture and engineering occupations
67,259Business and financial operations occupations
60,877Life, physical, and social science occupations
Top industries in this zip code by the number of employees in 2005:
Other Services (except Public Administration): Religious Organizations (50-99 employees: 1 establishment, 5-9 employees: 3 establishments)
Administrative and Support and Waste Management and Remediation Services: Landscaping Services (50-99: 1, 1-4: 2)
Accommodation and Food Services: Snack and Nonalcoholic Beverage Bars (50-99: 1)
Health Care and Social Assistance: Homes for the Elderly (50-99: 1)
Professional, Scientific, and Technical Services: Offices of Certified Public Accountants (50-99: 1)
Accommodation and Food Services: Limited-Service Restaurants (10-19: 3)
Accommodation and Food Services: Full-Service Restaurants (20-49: 1)
People in group quarters in 2010:
109 people in group homes intended for adults
People in group quarters in 2000:
417 people in college dormitories (includes college quarters off campus)
84 people in homes for the mentally ill
15 people in other group homes
Fatal accident statistics in 2014:
Fatal accident count: 1
Vehicles involved in fatal accidents: 1
Fatal accidents caused by drunken drivers: 0
Fatalities: 1
Persons involved in fatal accidents: 1
Pedestrians involved in fatal accidents: 0
Fatal accident statistics in 2011:
Fatal accident count: 1
Vehicles involved in fatal accidents: 2
Fatal accidents caused by drunken drivers: 0
Fatalities: 1
Persons involved in fatal accidents: 3
Pedestrians involved in fatal accidents: 0
Home Mortgage Disclosure Act Aggregated Statistics For Year 2009 (Based on 2 partial tracts)
A) FHA, FSA/RHS & VA Home Purchase Loans
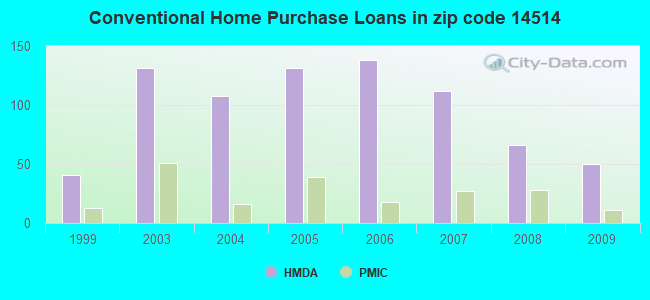
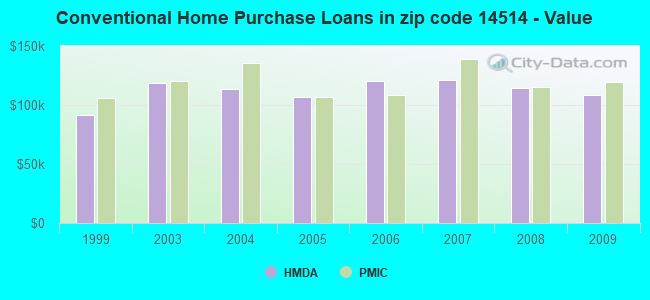
B) Conventional Home Purchase Loans
C) Refinancings
D) Home Improvement Loans
E) Loans on Dwellings For 5+ Families
F) Non-occupant Loans on < 5 Family Dwellings (A B C & D)
Number
Average Value
Number
Average Value
Number
Average Value
Number
Average Value
Number
Average Value
Number
Average Value
LOANS ORIGINATED
46
$114,500
50
$108,746
98
$113,916
23
$27,690
0
$0
2
$97,570
APPLICATIONS APPROVED, NOT ACCEPTED
4
$102,448
0
$0
14
$128,361
2
$17,740
0
$0
0
$0
APPLICATIONS DENIED
5
$105,376
2
$94,910
16
$105,553
4
$2,660
2
$5,774,370
0
$0
APPLICATIONS WITHDRAWN
2
$225,300
2
$88,700
27
$114,061
2
$14,190
0
$0
0
$0
FILES CLOSED FOR INCOMPLETENESS
2
$64,750
0
$0
5
$106,794
0
$0
0
$0
0
$0
Aggregated Statistics For Year 2008 (Based on 2 partial tracts)
A) FHA, FSA/RHS & VA Home Purchase Loans
B) Conventional Home Purchase Loans
C) Refinancings
D) Home Improvement Loans
E) Loans on Dwellings For 5+ Families
F) Non-occupant Loans on < 5 Family Dwellings (A B C & D)
Number
Average Value
Number
Average Value
Number
Average Value
Number
Average Value
Number
Average Value
Number
Average Value
LOANS ORIGINATED
32
$136,709
66
$114,772
60
$98,220
14
$9,504
2
$4,878,500
4
$117,085
APPLICATIONS APPROVED, NOT ACCEPTED
5
$147,596
11
$143,694
7
$82,111
7
$43,843
0
$0
0
$0
APPLICATIONS DENIED
0
$0
11
$152,725
41
$94,455
11
$14,675
0
$0
2
$189,820
APPLICATIONS WITHDRAWN
0
$0
5
$124,180
12
$155,668
4
$68,742
0
$0
0
$0
FILES CLOSED FOR INCOMPLETENESS
2
$140,145
4
$133,050
9
$104,863
0
$0
0
$0
0
$0
Aggregated Statistics For Year 2007 (Based on 2 partial tracts)
A) FHA, FSA/RHS & VA Home Purchase Loans
B) Conventional Home Purchase Loans
C) Refinancings
D) Home Improvement Loans
F) Non-occupant Loans on < 5 Family Dwellings (A B C & D)
G) Loans On Manufactured Home Dwelling (A B C & D)
Number
Average Value
Number
Average Value
Number
Average Value
Number
Average Value
Number
Average Value
Number
Average Value
LOANS ORIGINATED
21
$140,991
112
$121,060
75
$99,841
51
$32,802
7
$110,241
0
$0
APPLICATIONS APPROVED, NOT ACCEPTED
5
$175,980
20
$105,021
14
$110,241
11
$13,385
2
$133,050
2
$13,305
APPLICATIONS DENIED
9
$157,098
18
$123,884
75
$124,204
16
$47,566
0
$0
2
$16,855
APPLICATIONS WITHDRAWN
0
$0
5
$130,566
39
$100,481
2
$138,370
2
$75,395
0
$0
FILES CLOSED FOR INCOMPLETENESS
2
$143,695
7
$110,749
11
$98,860
0
$0
0
$0
0
$0
Aggregated Statistics For Year 2006 (Based on 2 partial tracts)
A) FHA, FSA/RHS & VA Home Purchase Loans
B) Conventional Home Purchase Loans
C) Refinancings
D) Home Improvement Loans
F) Non-occupant Loans on < 5 Family Dwellings (A B C & D)
G) Loans On Manufactured Home Dwelling (A B C & D)
Number
Average Value
Number
Average Value
Number
Average Value
Number
Average Value
Number
Average Value
Number
Average Value
LOANS ORIGINATED
21
$124,940
138
$120,619
67
$91,613
35
$39,535
7
$141,413
0
$0
APPLICATIONS APPROVED, NOT ACCEPTED
0
$0
11
$110,472
12
$169,122
20
$25,989
2
$79,830
2
$18,625
APPLICATIONS DENIED
0
$0
20
$134,736
90
$108,135
20
$29,714
11
$168,207
2
$31,930
APPLICATIONS WITHDRAWN
2
$80,715
14
$111,509
55
$108,827
2
$39,915
0
$0
0
$0
FILES CLOSED FOR INCOMPLETENESS
2
$222,635
4
$149,460
12
$126,397
0
$0
2
$57,655
0
$0
Aggregated Statistics For Year 2005 (Based on 2 partial tracts)
A) FHA, FSA/RHS & VA Home Purchase Loans
B) Conventional Home Purchase Loans
C) Refinancings
D) Home Improvement Loans
E) Loans on Dwellings For 5+ Families
F) Non-occupant Loans on < 5 Family Dwellings (A B C & D)
G) Loans On Manufactured Home Dwelling (A B C & D)
Number
Average Value
Number
Average Value
Number
Average Value
Number
Average Value
Number
Average Value
Number
Average Value
Number
Average Value
LOANS ORIGINATED
16
$120,078
131
$106,792
98
$91,198
25
$22,920
2
$2,483,600
5
$52,510
0
$0
APPLICATIONS APPROVED, NOT ACCEPTED
0
$0
27
$117,807
7
$102,131
2
$22,175
0
$0
2
$66,525
5
$52,510
APPLICATIONS DENIED
0
$0
5
$125,600
64
$92,858
27
$47,241
0
$0
2
$70,960
2
$25,725
APPLICATIONS WITHDRAWN
4
$156,555
4
$98,012
39
$108,123
5
$51,446
0
$0
0
$0
0
$0
FILES CLOSED FOR INCOMPLETENESS
0
$0
9
$166,164
25
$142,417
0
$0
0
$0
0
$0
0
$0
Aggregated Statistics For Year 2004 (Based on 2 partial tracts)
A) FHA, FSA/RHS & VA Home Purchase Loans
B) Conventional Home Purchase Loans
C) Refinancings
D) Home Improvement Loans
E) Loans on Dwellings For 5+ Families
F) Non-occupant Loans on < 5 Family Dwellings (A B C & D)
G) Loans On Manufactured Home Dwelling (A B C & D)
Number
Average Value
Number
Average Value
Number
Average Value
Number
Average Value
Number
Average Value
Number
Average Value
Number
Average Value
LOANS ORIGINATED
18
$102,202
108
$113,257
89
$100,679
12
$22,471
2
$2,106,625
2
$65,640
0
$0
APPLICATIONS APPROVED, NOT ACCEPTED
2
$138,370
25
$124,251
23
$107,211
5
$8,516
0
$0
0
$0
4
$45,238
APPLICATIONS DENIED
2
$155,225
16
$107,992
83
$99,793
20
$8,958
0
$0
4
$57,212
2
$51,445
APPLICATIONS WITHDRAWN
0
$0
12
$117,232
46
$102,121
4
$13,748
0
$0
0
$0
2
$51,445
FILES CLOSED FOR INCOMPLETENESS
0
$0
5
$145,822
30
$120,336
2
$66,525
0
$0
2
$79,830
0
$0
Aggregated Statistics For Year 2003 (Based on 2 partial tracts)
A) FHA, FSA/RHS & VA Home Purchase Loans
B) Conventional Home Purchase Loans
C) Refinancings
D) Home Improvement Loans
F) Non-occupant Loans on < 5 Family Dwellings (A B C & D)
Number
Average Value
Number
Average Value
Number
Average Value
Number
Average Value
Number
Average Value
LOANS ORIGINATED
21
$119,280
131
$118,614
241
$94,743
21
$9,208
4
$125,068
APPLICATIONS APPROVED, NOT ACCEPTED
2
$127,730
9
$106,440
32
$74,896
7
$16,980
2
$54,995
APPLICATIONS DENIED
4
$123,292
9
$68,398
75
$102,301
16
$11,642
2
$27,495
APPLICATIONS WITHDRAWN
0
$0
5
$162,498
51
$109,675
2
$23,060
0
$0
FILES CLOSED FOR INCOMPLETENESS
0
$0
0
$0
12
$106,440
0
$0
0
$0
Aggregated Statistics For Year 1999 (Based on 1 partial tract)
Detailed PMIC statistics for the following Tracts:0145.05
2002 - 2018 National Fire Incident Reporting System (NFIRS) incidents
According to the data from the years 2002 - 2018 the average number of fire incidents per year is 11. The highest number of reported fires - 18 took place in 2015, and the least - 5 in 2008. The data has a declining trend.
When looking into fire subcategories, the most reports belonged to: Structure Fires (46.3%), and Outside Fires (38.4%).
Fire incident types reported to NFIRS in Zip Code 14514
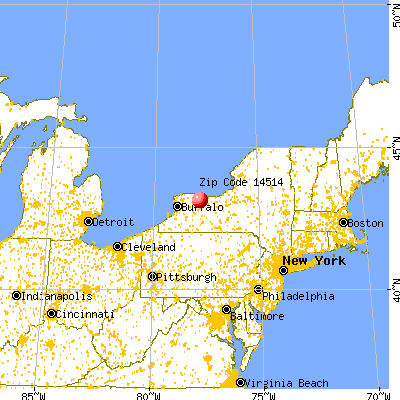


 Nearest zip codes: 14428, 14559, 14546, 14624, 14606, 14511.


 According to the data from the years 2002 - 2018 the average number of fire incidents per year is 11. The highest number of reported fires - 18 took place in 2015, and the least - 5 in 2008. The data has a declining trend.
 When looking into fire subcategories, the most reports belonged to: Structure Fires (46.3%), and Outside Fires (38.4%).