Estimated zip code population in 2022: 2,842 Zip code population in 2010: 2,963 Zip code population in 2000: 3,269
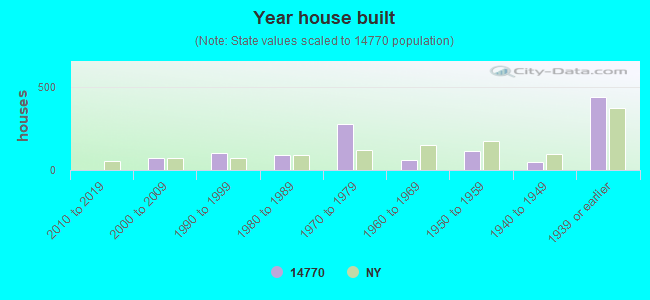
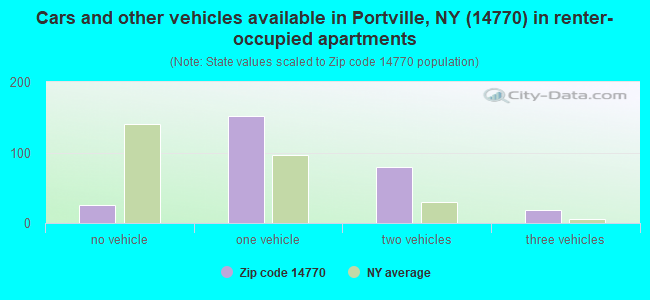
Houses and condos: 1,228 Renter-occupied apartments: 275
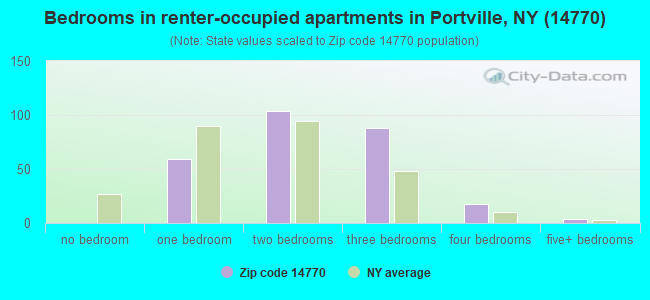
% of renters here:
24%
State:
46%
March 2022 cost of living index in zip code 14770: 93.5 (less than average, U.S. average is 100)
Land area: 29.6 sq. mi. Water area: 0.3 sq. mi.
Population density: 96 people per square mile
(very low).
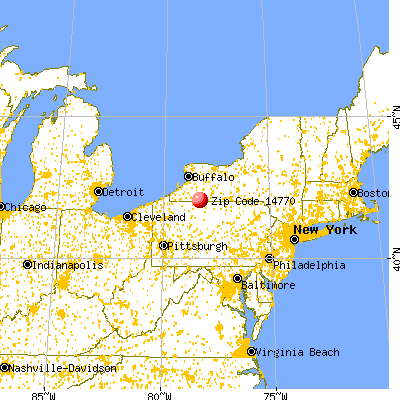
OSM Map
General Map
Google Map
MSN Map
OSM Map
General Map
Google Map
MSN Map
OSM Map
General Map
Google Map
MSN Map
OSM Map
General Map
Google Map
MSN Map
Please wait while loading the map...
Real estate property taxes paid for housing units in 2022:
This zip code:
2.6% ($2,849)
New York:
1.5% ($6,180)
Median real estate property taxes paid for housing units with mortgages in 2022: $3,477 (2.9%) Median real estate property taxes paid for housing units with no mortgage in 2022: $2,173 (2.1%)
Business Search- 14 Million verified businesses
Males: 1,420
(50.0%)
Females: 1,421
(50.0%)
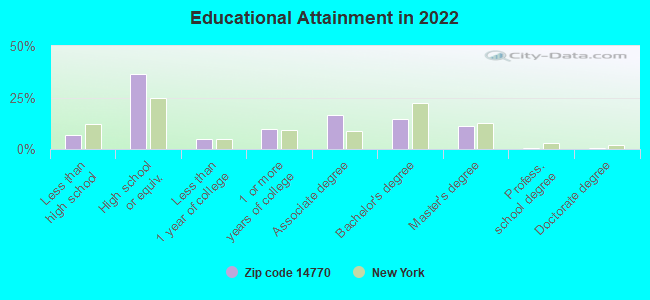
For population 25 years and over in 14770:
High school or higher: 92.6%
Bachelor's degree or higher: 25.7%
Graduate or professional degree: 11.5%
Unemployed: 6.1%
Mean travel time to work (commute): 22.5 minutes
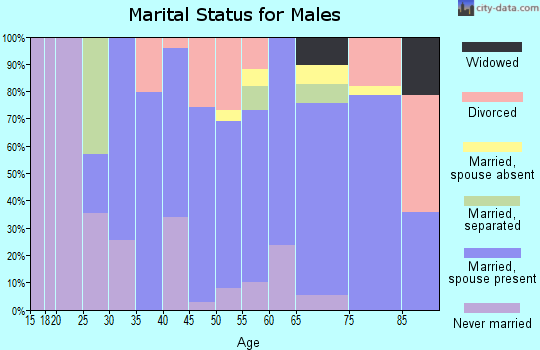
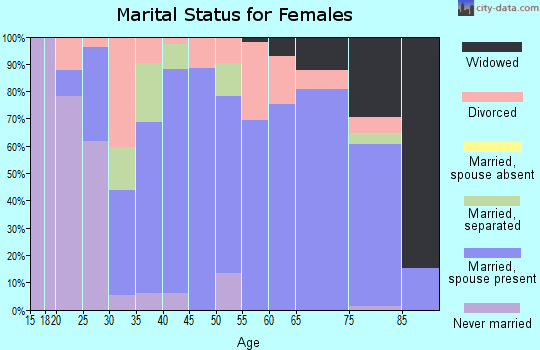
For population 15 years and over in 14770:
Never married: 25.0%
Now married: 60.0%
Separated: 0.6%
Widowed: 5.5%
Divorced: 9.0%
Zip code 14770 compared to state average:
Median house value significantly below state average.
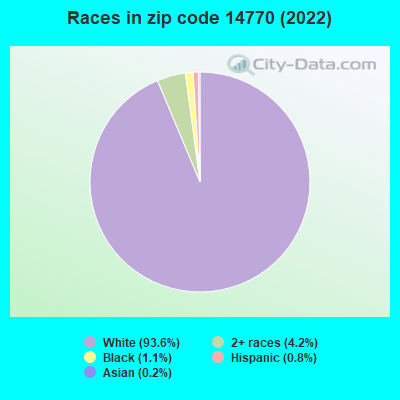
Black race population percentage significantly below state average.
Hispanic race population percentage significantly below state average.
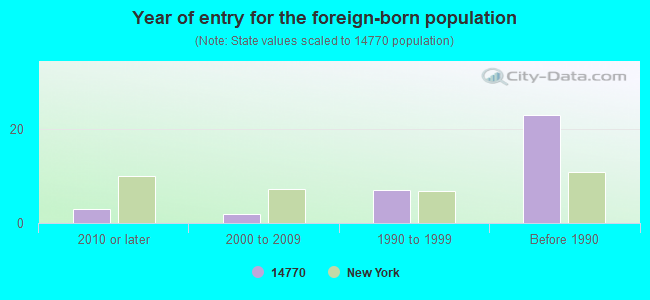
Foreign-born population percentage significantly below state average.
Renting percentage below state average.
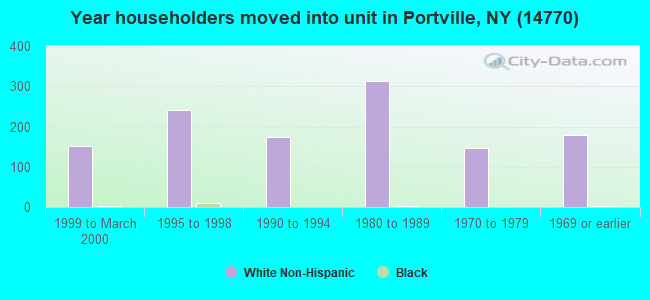
Length of stay since moving in above state average.
Number of rooms per house above state average.
Percentage of population with a bachelor's degree or higher below state average.
Averages for the 2020 tax year for zip code 14770, filed in 2021:
Average Adjusted Gross Income (AGI) in 2020: $53,562 (Individual Income Tax Returns)
Here:
$53,562
State:
$90,930
Salary/wage: $45,175 (reported on 82.7% of returns)
Here:
$45,175
State:
$72,104
(% of AGI for various income ranges: 1090.9% for AGIs below $25k, 3260.0% for AGIs $25k-50k, 6289.4% for AGIs $50k-75k, 7687.3% for AGIs $75k-100k, 11781.8% for AGIs $100k-200k)
Taxable interest for individuals: $357 (reported on 31.6% of returns)
This zip code:
$357
New York:
$3,075
(% of AGI for various income ranges: 5.5% for AGIs below $25k, 5.0% for AGIs $25k-50k, 15.9% for AGIs $50k-75k, 19.1% for AGIs $75k-100k, 62.7% for AGIs $100k-200k)
Ordinary dividends: $3,840 (reported on 15.0% of returns)
Here:
$3,840
State:
$11,095
(% of AGI for various income ranges: 5.5% for AGIs below $25k, 33.0% for AGIs $25k-50k, 26.5% for AGIs $50k-75k, 31.8% for AGIs $75k-100k, 519.1% for AGIs $100k-200k)
Net capital gain/loss in AGI: +$6,200 (reported on 10.5% of returns)
Here:
+$6,200
State:
+$44,925
(% of AGI for various income ranges: 4.8% for AGIs below $25k, 7.7% for AGIs $25k-50k, 25.3% for AGIs $50k-75k, 714.5% for AGIs $100k-200k)
Profit/loss from business: +$6,221 (reported on 10.5% of returns)
Here:
+$6,221
State:
+$14,940
(% of AGI for various income ranges: 54.8% for AGIs below $25k, 47.7% for AGIs $25k-50k, 188.2% for AGIs $50k-75k, 206.4% for AGIs $100k-200k)
Taxable individual retirement arrangement distribution: $18,325 (reported on 9.0% of returns)
14770:
$18,325
New York:
$19,609
(% of AGI for various income ranges: 54.5% for AGIs below $25k, 137.3% for AGIs $25k-50k, 435.3% for AGIs $50k-75k, 788.2% for AGIs $100k-200k)
Earned income credit: $2,187 (reported on 17.3% of returns)
Here:
$2,187
State:
$2,138
(% of AGI for various income ranges: 87.9% for AGIs below $25k, 71.0% for AGIs $25k-50k)
Percentage of individuals using paid preparers for their 2020 taxes: 96.2%
Here:
96%
State:
95%
(% for various income ranges: 95.6% for AGIs below $25k, 94.4% for AGIs $25k-50k, 95.7% for AGIs $50k-75k, 100.0% for AGIs $75k-100k, 100.0% for AGIs $100k-200k, 100.0% for AGIs over 200k)
Averages for the 2012 tax year for zip code 14770, filed in 2013:
Average Adjusted Gross Income (AGI) in 2012: $44,648 (Individual Income Tax Returns)
Here:
$44,648
State:
$77,088
Salary/wage: $38,282 (reported on 86.7% of returns)
Here:
$38,282
State:
$60,593
(% of AGI for various income ranges: 74.9% for AGIs below $25k, 79.0% for AGIs $25k-50k, 83.2% for AGIs $50k-75k, 76.9% for AGIs $75k-100k, 61.8% for AGIs $100k-200k)
Taxable interest for individuals: $289 (reported on 33.3% of returns)
This zip code:
$289
New York:
$3,125
(% of AGI for various income ranges: 0.3% for AGIs below $25k, 0.2% for AGIs $25k-50k, 0.2% for AGIs $50k-75k, 0.1% for AGIs $75k-100k, 0.3% for AGIs $100k-200k)
Ordinary dividends: $5,362 (reported on 17.8% of returns)
Here:
$5,362
State:
$10,299
(% of AGI for various income ranges: 1.0% for AGIs below $25k, 0.4% for AGIs $25k-50k, 0.6% for AGIs $50k-75k, 0.3% for AGIs $75k-100k, 6.4% for AGIs $100k-200k)
Net capital gain/loss in AGI: +$2,644 (reported on 11.9% of returns)
Here:
+$2,644
State:
+$42,474
(% of AGI for various income ranges: 0.2% for AGIs $25k-50k, 1.6% for AGIs $50k-75k, 1.1% for AGIs $100k-200k)
Profit/loss from business: +$12,812 (reported on 11.9% of returns)
Here:
+$12,812
State:
+$16,168
(% of AGI for various income ranges: 3.6% for AGIs below $25k, 4.1% for AGIs $25k-50k, 2.0% for AGIs $50k-75k, 6.3% for AGIs $100k-200k)
Taxable individual retirement arrangement distribution: $11,914 (reported on 10.4% of returns)
14770:
$11,914
New York:
$17,621
(% of AGI for various income ranges: 2.2% for AGIs below $25k, 2.8% for AGIs $25k-50k, 2.0% for AGIs $50k-75k, 4.5% for AGIs $75k-100k, 2.4% for AGIs $100k-200k)
Total itemized deductions: $20,722 (21% of AGI, reported on 17.0% of returns)
Here:
$20,722
State:
$34,985
Here:
21.2% of AGI
State:
21.3% of AGI
(% of AGI for various income ranges: 5.2% for AGIs $25k-50k, 6.6% for AGIs $50k-75k, 6.5% for AGIs $75k-100k, 15.2% for AGIs $100k-200k)
Charity contributions: $2,494 (reported on 12.6% of returns)
Here:
$2,494
State:
$5,572
(% of AGI for various income ranges: 0.3% for AGIs $25k-50k, 0.6% for AGIs $50k-75k, 0.7% for AGIs $75k-100k, 1.4% for AGIs $100k-200k)
Taxes paid: $9,417 (reported on 17.0% of returns)
14770:
$9,417
State:
$18,656
(% of AGI for various income ranges: 1.9% for AGIs $25k-50k, 2.8% for AGIs $50k-75k, 2.9% for AGIs $75k-100k, 7.5% for AGIs $100k-200k)
Earned income credit: $2,226 (reported on 20.0% of returns)
Here:
$2,226
State:
$2,230
(% of AGI for various income ranges: 6.3% for AGIs below $25k, 1.4% for AGIs $25k-50k)
Percentage of individuals using paid preparers for their 2012 taxes: 60.0%
Here:
60%
State:
66%
(% for various income ranges: 56.1% for AGIs below $25k, 58.8% for AGIs $25k-50k, 61.9% for AGIs $50k-75k, 69.2% for AGIs $75k-100k, 70.0% for AGIs $100k-200k)
Averages for the 2004 tax year for zip code 14770, filed in 2005:
Average Adjusted Gross Income (AGI) in 2004: $35,142 (Individual Income Tax Returns)
Here:
$35,142
State:
$59,519
Salary/wage: $31,849 (reported on 88.2% of returns)
Here:
$31,849
State:
$50,673
(% of AGI for various income ranges: 90.4% for AGIs below $10k, 77.4% for AGIs $10k-25k, 85.8% for AGIs $25k-50k, 82.1% for AGIs $50k-75k, 85.4% for AGIs $75k-100k, 60.7% for AGIs over 100k)
Taxable interest for individuals: $642 (reported on 43.1% of returns)
This zip code:
$642
New York:
$2,377
(% of AGI for various income ranges: 2.5% for AGIs below $10k, 1.5% for AGIs $10k-25k, 0.6% for AGIs $25k-50k, 0.7% for AGIs $50k-75k, 0.7% for AGIs $75k-100k, 0.5% for AGIs over 100k)
Taxable dividends: $1,073 (reported on 20.8% of returns)
Here:
$1,073
State:
$5,394
(% of AGI for various income ranges: 1.6% for AGIs below $10k, 1.0% for AGIs $10k-25k, 0.4% for AGIs $25k-50k, 0.6% for AGIs $50k-75k, 1.0% for AGIs $75k-100k, 0.3% for AGIs over 100k)
Net capital gain/loss: +$1,613 (reported on 14.0% of returns)
Here:
+$1,613
State:
+$23,581
(% of AGI for various income ranges: 0.5% for AGIs below $10k, -0.3% for AGIs $10k-25k, 0.9% for AGIs $25k-50k, 1.0% for AGIs $50k-75k, -0.0% for AGIs $75k-100k, 1.0% for AGIs over 100k)
Profit/loss from business: +$6,742 (reported on 11.2% of returns)
Here:
+$6,742
State:
+$13,809
(% of AGI for various income ranges: 8.0% for AGIs below $10k, 3.6% for AGIs $10k-25k, 1.4% for AGIs $25k-50k, -0.3% for AGIs $50k-75k, 1.3% for AGIs $75k-100k, 6.2% for AGIs over 100k)
IRA payment deduction: $2,739 (reported on 1.7% of returns)
14770:
$2,739
New York:
$3,115
Total itemized deductions: $14,473 (20% of AGI, reported on 18.5% of returns)
Here:
$14,473
State:
$25,864
Here:
19.7% of AGI
State:
21.9% of AGI
(% of AGI for various income ranges: 4.5% for AGIs $10k-25k, 5.7% for AGIs $25k-50k, 7.8% for AGIs $50k-75k, 10.7% for AGIs $75k-100k, 11.4% for AGIs over 100k)
Charity contributions deductions: $2,238 (3% of AGI, reported on 16.1% of returns)
Here:
$2,238
State:
$4,439
Here:
2.9% of AGI
State:
3.6% of AGI
(% of AGI for various income ranges: 0.5% for AGIs $10k-25k, 0.7% for AGIs $25k-50k, 0.9% for AGIs $50k-75k, 1.7% for AGIs $75k-100k, 1.8% for AGIs over 100k)
Total tax: $4,052 (reported on 72.8% of returns)
14770:
$4,052
State:
$11,730
(% of AGI for various income ranges: 2.1% for AGIs below $10k, 3.9% for AGIs $10k-25k, 6.2% for AGIs $25k-50k, 8.0% for AGIs $50k-75k, 10.0% for AGIs $75k-100k, 16.4% for AGIs over 100k)
Earned income credit: $1,686 (reported on 17.4% of returns)
Here:
$1,686
State:
$1,757
Percentage of individuals using paid preparers for their 2004 taxes: 60.3%
Here:
60%
State:
67%
(% for various income ranges: 47.7% for AGIs below $10k, 59.9% for AGIs $10k-25k, 67.5% for AGIs $25k-50k, 64.0% for AGIs $50k-75k, 60.0% for AGIs $75k-100k, 73.5% for AGIs over 100k)
Likely homosexual households (counted as self-reported same-sex unmarried-partner households)
Lesbian couples: 0.0% of all households
Gay men: 1.2% of all households
Household received Food Stamps/SNAP in the past 12 months: 156 Household did not receive Food Stamps/SNAP in the past 12 months: 990
Women who had a birth in the past 12 months: 28 (6 now married, 23 unmarried) Women who did not have a birth in the past 12 months: 589 (382 now married, 199 unmarried)
Housing units in zip code 14770 with a mortgage: 406 (3 second mortgage, 3 both second mortgage and home equity loan) Houses without a mortgage: 24
Median monthly owner costs for units with a mortgage: $1,159 Median monthly owner costs for units without a mortgage: $429
Residents with income below the poverty level in 2022:
This zip code:
12.1%
Whole state:
14.3%
Residents with income below 50% of the poverty level in 2022:
This zip code:
5.4%
Whole state:
6.8%
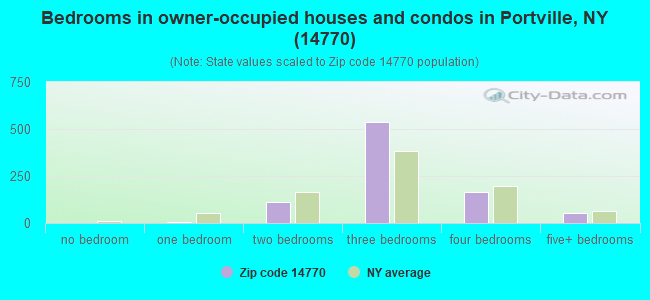
Median number of rooms in houses and condos:
Here:
6.8
State:
6.3
Median number of rooms in apartments:
Here:
4.8
State:
3.8
Notable locations in this zip code not listed on our city pages
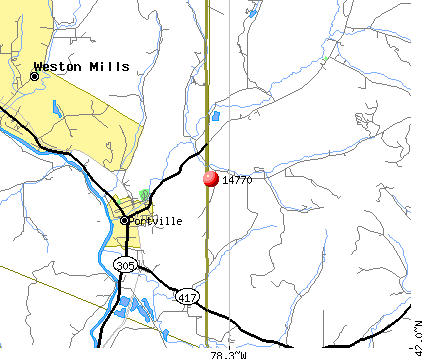
Notable locations in zip code 14770: Portville Drive-In (A), Portville Wastewater Treatment Plant (B), Deer Creek Farm (C), Faulkner's Farm (D), Portville Municipal Building (E), Portville Free Library (F). Display/hide their locations on the map
Churches in zip code 14770 include: Bethel Lutheran Church (A), First Presbyterian Church of Portville (B), Portville Baptist Church (C), Sacred Heart Roman Catholic Church (D), Saint Andrews United Methodist Church (E). Display/hide their locations on the map
Streams, rivers, and creeks: Deer Creek (A), Coon Branch (B), Bells Brook (C), Oswayo Creek (D), Butternut Brook (E). Display/hide their locations on the map
Size of family households: 402 2-persons, 203 3-persons, 110 4-persons, 29 5-persons, 67 6-persons, 10 7-or-more-persons
Size of nonfamily households: 298 1-person, 19 2-persons, 2 5-persons
415 married couples with children.
177 single-parent households (66 men, 111 women).
98.2% of residents of 14770 zip code speak English at home.
0.4% of residents speak Spanish at home (100% very well).
1.3% of residents speak other Indo-European language at home (100% very well).
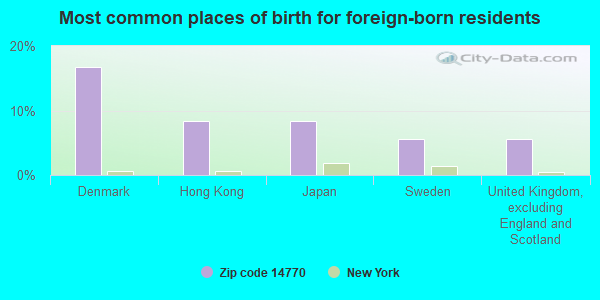
Foreign born population: 37 (1.3%) (84.5% of them are naturalized citizens)
This zip code:
1.3%
Whole state:
22.7%
17%Denmark
8%Hong Kong
8%Japan
6%Sweden
6%United Kingdom, excluding England and Scotland
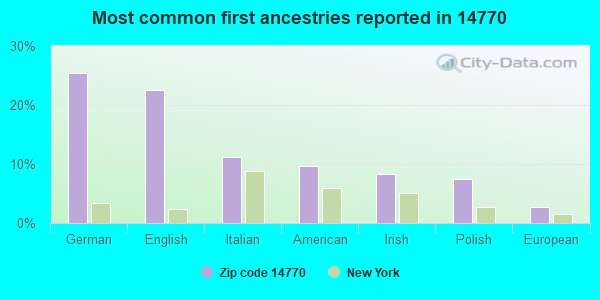
25%German
23%English
11%Italian
10%American
8%Irish
7%Polish
3%European
Year of entry for the foreign-born population
32010 or later
22000 to 2009
71990 to 1999
23Before 1990
Facilities with environmental interests located in this zip code:
ANDERSON PATTERN WORKS (484 HIGHLAND TER in PORTVILLE, NY)
(Resource Conservation and Recovery Act (tracking hazardous waste)) Organizations: NON NOTIFIER (CONTACT/OWNER)
AGWAY INC - PORTVILLE (46 BROOKLYN ST RTE 305 in PORTVILLE, NY)
(Resource Conservation and Recovery Act (tracking hazardous waste))
Housing units lacking complete plumbing facilities: 2.0% Housing units lacking complete kitchen facilities: 2.2%
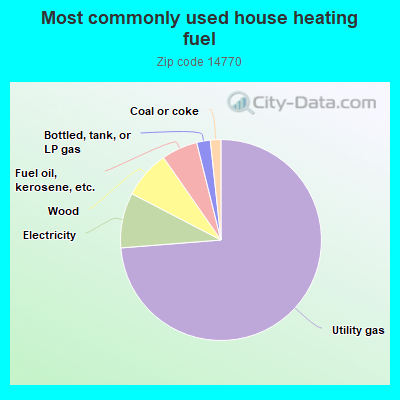
73.9%Utility gas
8.9%Electricity
7.7%Wood
5.8%Fuel oil, kerosene, etc.
2.2%Bottled, tank, or LP gas
1.7%Coal or coke
Population in 1990: 1,743. Population change in the 1990s: +1,526 (+87.6%).
Place of birth for U.S.-born residents:
This state: 2,364
Northeast: 213
Midwest: 41
South: 107
West: 70
70% of the 14770 zip code residents lived in the same house 5 years ago. Out of people who lived in different houses, 52% lived in this county. Out of people who lived in different counties, 50% lived in New York.
95% of the 14770 zip code residents lived in the same house 1 year ago. Out of people who lived in different houses, 28% moved from this county. Out of people who lived in different houses, 35% moved from different county within same state. Out of people who lived in different houses, 28% moved from different state. Out of people who lived in different houses, 9% moved from abroad.
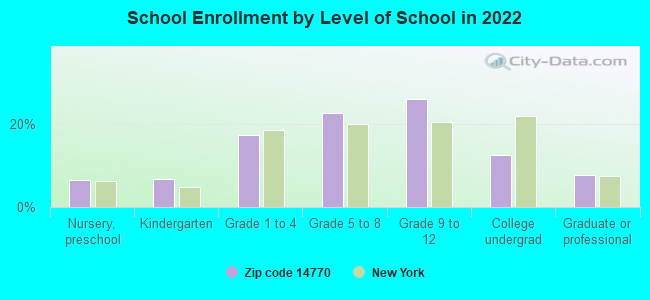
Private vs. public school enrollment:
Students in private schools in grades 1 to 8 (elementary and middle school): 21
Here:
7.1%
New York:
15.6%
Students in private schools in grades 9 to 12 (high school):
Here:
0.0%
New York:
15.0%
Students in private undergraduate colleges: 8
Here:
9.5%
New York:
39.2%
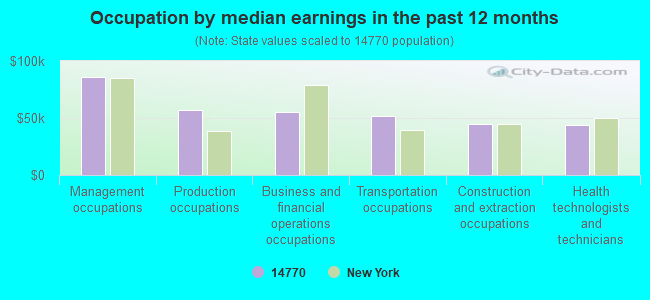
Occupation by median earnings in the past 12 months ($)
85,634Management occupations
57,449Production occupations
55,070Business and financial operations occupations
51,574Transportation occupations
44,605Construction and extraction occupations
43,759Health technologists and technicians
Top industries in this zip code by the number of employees in 2005:


 Nearest zip codes: 14721, 14788, 14754, 16731, 14760, 16750.