Estimated zip code population in 2022: 1,798 Zip code population in 2010: 2,225 Zip code population in 2000: 2,149
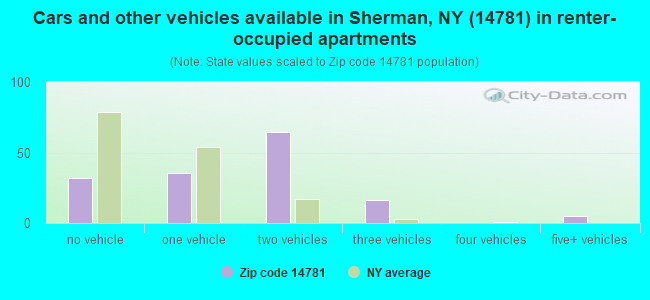
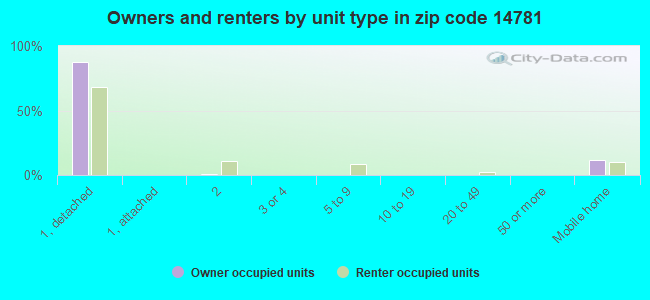
Houses and condos: 927 Renter-occupied apartments: 156
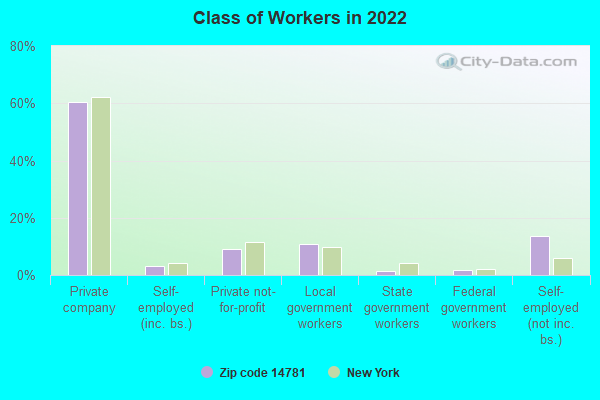
% of renters here:
20%
State:
46%
March 2022 cost of living index in zip code 14781: 93.7 (less than average, U.S. average is 100)
Land area: 72.6 sq. mi. Water area: 0.1 sq. mi.
Population density: 25 people per square mile
(very low).
OSM Map
General Map
Google Map
MSN Map
OSM Map
General Map
Google Map
MSN Map
OSM Map
General Map
Google Map
MSN Map
OSM Map
General Map
Google Map
MSN Map
Please wait while loading the map...
Real estate property taxes paid for housing units in 2022:
This zip code:
1.9% ($2,181)
New York:
1.5% ($6,180)
Median real estate property taxes paid for housing units with mortgages in 2022: $2,154 (1.7%) Median real estate property taxes paid for housing units with no mortgage in 2022: $2,217 (2.3%)
Business Search- 14 Million verified businesses
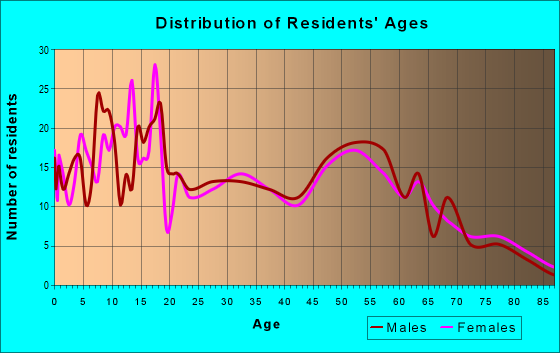
Males: 884
(49.2%)
Females: 913
(50.8%)
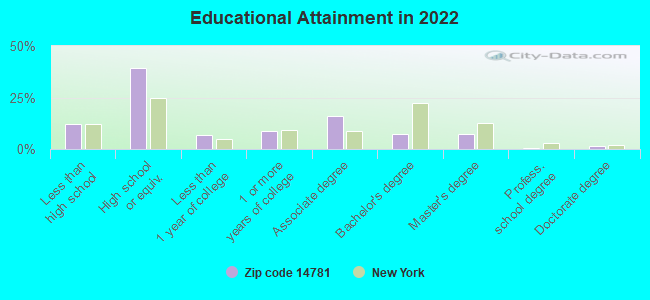
For population 25 years and over in 14781:
High school or higher: 86.6%
Bachelor's degree or higher: 16.4%
Graduate or professional degree: 9.2%
Unemployed: 4.0%
Mean travel time to work (commute): 21.0 minutes
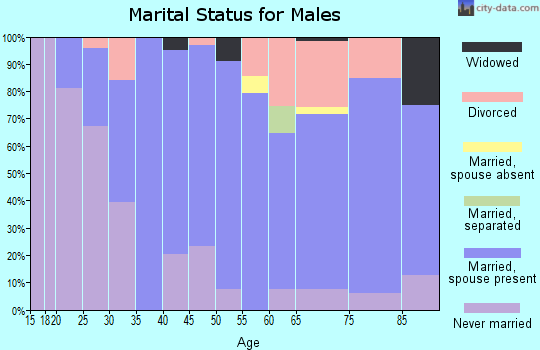
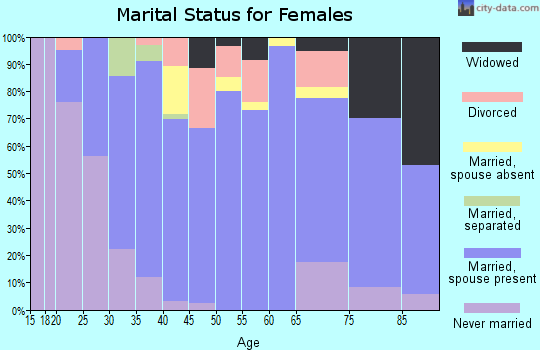
For population 15 years and over in 14781:
Never married: 21.3%
Now married: 59.3%
Separated: 1.9%
Widowed: 7.4%
Divorced: 10.1%
Zip code 14781 compared to state average:
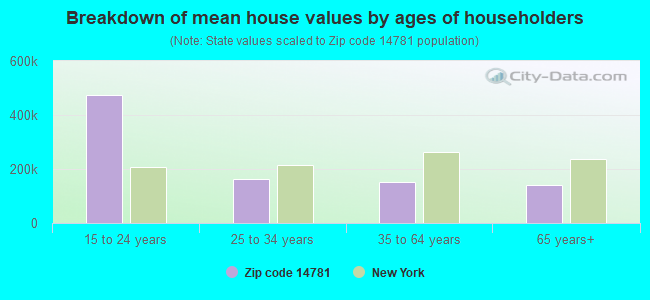
Median house value significantly below state average.
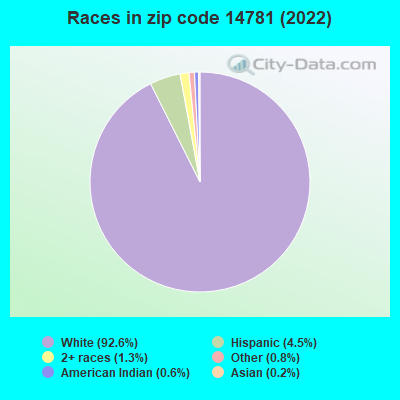
Black race population percentage significantly below state average.
Hispanic race population percentage significantly below state average.
Median age above state average.
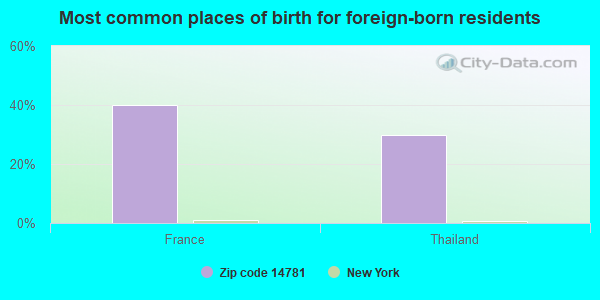
Foreign-born population percentage significantly below state average.
Renting percentage significantly below state average.
Length of stay since moving in above state average.
Number of college students below state average.
Percentage of population with a bachelor's degree or higher significantly below state average.
Averages for the 2020 tax year for zip code 14781, filed in 2021:
Average Adjusted Gross Income (AGI) in 2020: $49,484 (Individual Income Tax Returns)
Here:
$49,484
State:
$90,930
Salary/wage: $42,551 (reported on 73.9% of returns)
Here:
$42,551
State:
$72,104
(% of AGI for various income ranges: 1183.6% for AGIs below $25k, 3187.8% for AGIs $25k-50k, 5919.1% for AGIs $50k-75k, 7693.3% for AGIs $75k-100k, 15776.7% for AGIs $100k-200k)
Taxable interest for individuals: $570 (reported on 25.0% of returns)
This zip code:
$570
New York:
$3,075
(% of AGI for various income ranges: 4.5% for AGIs below $25k, 13.3% for AGIs $25k-50k, 7.3% for AGIs $50k-75k, 113.3% for AGIs $75k-100k, 35.0% for AGIs $100k-200k)
Ordinary dividends: $1,333 (reported on 13.0% of returns)
Here:
$1,333
State:
$11,095
(% of AGI for various income ranges: 18.2% for AGIs below $25k, 16.7% for AGIs $25k-50k, 39.1% for AGIs $50k-75k, 78.3% for AGIs $100k-200k)
Net capital gain/loss in AGI: +$5,073 (reported on 12.0% of returns)
Here:
+$5,073
State:
+$44,925
(% of AGI for various income ranges: 31.1% for AGIs $25k-50k, 109.1% for AGIs $50k-75k, 636.7% for AGIs $100k-200k)
Profit/loss from business: +$10,753 (reported on 18.5% of returns)
Here:
+$10,753
State:
+$14,940
(% of AGI for various income ranges: 209.5% for AGIs below $25k, 288.3% for AGIs $25k-50k, 648.2% for AGIs $50k-75k, 225.0% for AGIs $100k-200k)
Taxable individual retirement arrangement distribution: $14,025 (reported on 8.7% of returns)
14781:
$14,025
New York:
$19,609
(% of AGI for various income ranges: 245.6% for AGIs $25k-50k, 1133.3% for AGIs $75k-100k)
Earned income credit: $2,436 (reported on 15.2% of returns)
Here:
$2,436
State:
$2,138
(% of AGI for various income ranges: 101.8% for AGIs below $25k, 65.0% for AGIs $25k-50k)
Percentage of individuals using paid preparers for their 2020 taxes: 97.8%
Here:
98%
State:
95%
(% for various income ranges: 97.0% for AGIs below $25k, 96.0% for AGIs $25k-50k, 100.0% for AGIs $50k-75k, 100.0% for AGIs $75k-100k, 100.0% for AGIs $100k-200k)
Averages for the 2012 tax year for zip code 14781, filed in 2013:
Average Adjusted Gross Income (AGI) in 2012: $38,327 (Individual Income Tax Returns)
Here:
$38,327
State:
$77,088
Salary/wage: $34,699 (reported on 82.4% of returns)
Here:
$34,699
State:
$60,593
(% of AGI for various income ranges: 63.5% for AGIs below $25k, 73.3% for AGIs $25k-50k, 73.6% for AGIs $50k-75k, 78.6% for AGIs $75k-100k, 81.1% for AGIs $100k-200k)
Taxable interest for individuals: $778 (reported on 29.7% of returns)
This zip code:
$778
New York:
$3,125
(% of AGI for various income ranges: 1.9% for AGIs below $25k, 0.6% for AGIs $25k-50k, 0.5% for AGIs $50k-75k, 0.2% for AGIs $75k-100k)
Ordinary dividends: $1,562 (reported on 17.6% of returns)
Here:
$1,562
State:
$10,299
(% of AGI for various income ranges: 1.9% for AGIs below $25k, 0.8% for AGIs $25k-50k, 0.5% for AGIs $50k-75k, 0.7% for AGIs $75k-100k)
Net capital gain/loss in AGI: +$1,000 (reported on 11.0% of returns)
Here:
+$1,000
State:
+$42,474
(% of AGI for various income ranges: 1.5% for AGIs below $25k, 0.2% for AGIs $25k-50k)
Profit/loss from business: +$10,006 (reported on 19.8% of returns)
Here:
+$10,006
State:
+$16,168
(% of AGI for various income ranges: 10.8% for AGIs below $25k, 9.3% for AGIs $25k-50k, 6.0% for AGIs $50k-75k, 0.7% for AGIs $75k-100k)
Taxable individual retirement arrangement distribution: $7,888 (reported on 8.8% of returns)
14781:
$7,888
New York:
$17,621
Total itemized deductions: $16,862 (20% of AGI, reported on 14.3% of returns)
Here:
$16,862
State:
$34,985
Here:
20.1% of AGI
State:
21.3% of AGI
(% of AGI for various income ranges: 5.5% for AGIs $25k-50k, 3.9% for AGIs $50k-75k, 8.4% for AGIs $75k-100k, 12.0% for AGIs $100k-200k)
Charity contributions: $3,960 (reported on 11.0% of returns)
Here:
$3,960
State:
$5,572
(% of AGI for various income ranges: 1.4% for AGIs $25k-50k, 1.9% for AGIs $75k-100k, 2.2% for AGIs $100k-200k)
Taxes paid: $7,215 (reported on 14.3% of returns)
14781:
$7,215
State:
$18,656
(% of AGI for various income ranges: 1.6% for AGIs $25k-50k, 1.5% for AGIs $50k-75k, 3.6% for AGIs $75k-100k, 5.9% for AGIs $100k-200k)
Earned income credit: $2,474 (reported on 20.9% of returns)
Here:
$2,474
State:
$2,230
(% of AGI for various income ranges: 6.9% for AGIs below $25k, 1.5% for AGIs $25k-50k)
Percentage of individuals using paid preparers for their 2012 taxes: 57.1%
Here:
57%
State:
66%
(% for various income ranges: 52.3% for AGIs below $25k, 61.9% for AGIs $25k-50k, 61.5% for AGIs $50k-75k, 57.1% for AGIs $75k-100k, 66.7% for AGIs $100k-200k)
Averages for the 2004 tax year for zip code 14781, filed in 2005:
Average Adjusted Gross Income (AGI) in 2004: $29,495 (Individual Income Tax Returns)
Here:
$29,495
State:
$59,519
Salary/wage: $27,914 (reported on 81.9% of returns)
Here:
$27,914
State:
$50,673
(% of AGI for various income ranges: 105.2% for AGIs below $10k, 62.1% for AGIs $10k-25k, 79.5% for AGIs $25k-50k, 82.8% for AGIs $50k-75k, 85.2% for AGIs $75k-100k, 71.5% for AGIs over 100k)
Taxable interest for individuals: $895 (reported on 45.7% of returns)
This zip code:
$895
New York:
$2,377
(% of AGI for various income ranges: 5.1% for AGIs below $10k, 1.3% for AGIs $10k-25k, 1.4% for AGIs $25k-50k, 1.6% for AGIs $50k-75k, 0.1% for AGIs $75k-100k, 1.3% for AGIs over 100k)
Taxable dividends: $994 (reported on 19.7% of returns)
Here:
$994
State:
$5,394
(% of AGI for various income ranges: 2.7% for AGIs below $10k, 0.9% for AGIs $10k-25k, 0.7% for AGIs $25k-50k, 0.3% for AGIs $50k-75k, 0.7% for AGIs $75k-100k, 0.4% for AGIs over 100k)
Net capital gain/loss: +$3,443 (reported on 15.6% of returns)
Here:
+$3,443
State:
+$23,581
(% of AGI for various income ranges: -1.8% for AGIs below $10k, 2.4% for AGIs $10k-25k, 1.5% for AGIs $25k-50k, 1.9% for AGIs $50k-75k, 5.8% for AGIs $75k-100k)
Profit/loss from business: +$7,351 (reported on 21.0% of returns)
Here:
+$7,351
State:
+$13,809
(% of AGI for various income ranges: 10.1% for AGIs below $10k, 18.2% for AGIs $10k-25k, 6.5% for AGIs $25k-50k, 0.4% for AGIs $50k-75k, -5.7% for AGIs $75k-100k)
IRA payment deduction: $2,429 (reported on 3.9% of returns)
14781:
$2,429
New York:
$3,115
Total itemized deductions: $14,376 (23% of AGI, reported on 13.9% of returns)
Here:
$14,376
State:
$25,864
Here:
23.1% of AGI
State:
21.9% of AGI
(% of AGI for various income ranges: 3.6% for AGIs $10k-25k, 6.4% for AGIs $25k-50k, 6.0% for AGIs $50k-75k, 14.3% for AGIs $75k-100k, 9.5% for AGIs over 100k)
Charity contributions deductions: $3,368 (5% of AGI, reported on 11.8% of returns)
Here:
$3,368
State:
$4,439
Here:
5.1% of AGI
State:
3.6% of AGI
(% of AGI for various income ranges: 1.4% for AGIs $25k-50k, 1.2% for AGIs $50k-75k, 2.9% for AGIs $75k-100k, 2.5% for AGIs over 100k)
Total tax: $3,444 (reported on 66.0% of returns)
14781:
$3,444
State:
$11,730
(% of AGI for various income ranges: 4.4% for AGIs below $10k, 4.8% for AGIs $10k-25k, 5.6% for AGIs $25k-50k, 8.3% for AGIs $50k-75k, 10.1% for AGIs $75k-100k, 14.9% for AGIs over 100k)
Earned income credit: $1,883 (reported on 23.9% of returns)
Here:
$1,883
State:
$1,757
Percentage of individuals using paid preparers for their 2004 taxes: 66.6%
Here:
67%
State:
67%
(% for various income ranges: 58.4% for AGIs below $10k, 69.7% for AGIs $10k-25k, 69.5% for AGIs $25k-50k, 68.4% for AGIs $50k-75k, 72.4% for AGIs $75k-100k, 66.7% for AGIs over 100k)
Household received Food Stamps/SNAP in the past 12 months: 109 Household did not receive Food Stamps/SNAP in the past 12 months: 685
Women who had a birth in the past 12 months: 12 (12 now married, 0 unmarried) Women who did not have a birth in the past 12 months: 301 (150 now married, 148 unmarried)
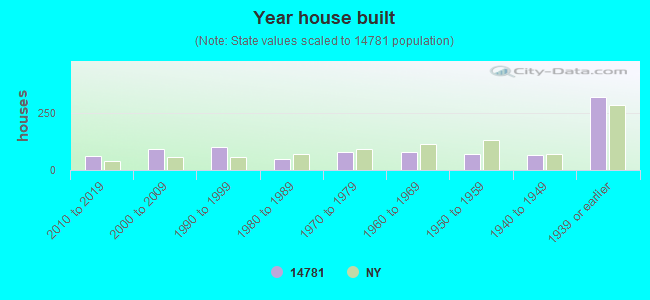
Housing units in zip code 14781 with a mortgage: 306 (17 second mortgage, 4 home equity loan, 8 both second mortgage and home equity loan) Houses without a mortgage: 46
Median monthly owner costs for units with a mortgage: $1,022 Median monthly owner costs for units without a mortgage: $487
Residents with income below the poverty level in 2022:
This zip code:
18.3%
Whole state:
14.3%
Residents with income below 50% of the poverty level in 2022:
This zip code:
10.3%
Whole state:
6.8%
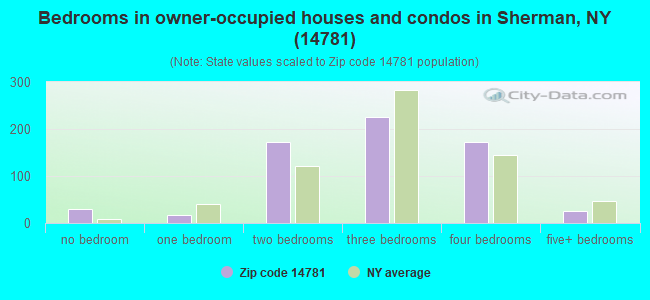
Median number of rooms in houses and condos:
Here:
6.2
State:
6.3
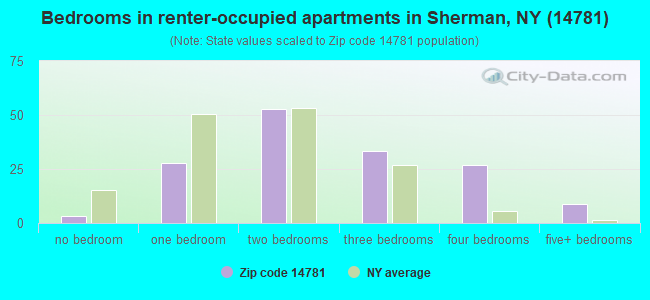
Median number of rooms in apartments:
Here:
5.1
State:
3.8
Notable locations in this zip code not listed on our city pages
Notable locations in zip code 14781: Pleasant View Dairy Farms (A), Woodcrest Golf Course (B), Minerva Free Library (C), Sherman Fire Department (D), Main Street Theatre (E), Village of Sherman Garage (F), Alexander Findley Community Library (G). Display/hide their locations on the map
Churches in zip code 14781 include: Saint Isaac Jogues Church (A), Sherman Community Church (B), First Baptist Church (C), Abundant Life Seventh Day Adventist Church (D), Christian Missionary Alliance Church (E), Findley Lake United Methodist Church (F), Sherman Assembly of God Church (G), North Harmony Church (H). Display/hide their locations on the map
Size of family households: 278 2-persons, 43 3-persons, 80 4-persons, 38 5-persons, 35 6-persons, 3 7-or-more-persons
Size of nonfamily households: 283 1-person, 35 2-persons, 3 3-persons
211 married couples with children.
112 single-parent households (9 men, 103 women).
91.9% of residents of 14781 zip code speak English at home.
0.5% of residents speak Spanish at home (75% very well, 25% well).
7.5% of residents speak other Indo-European language at home (83% very well, 15% well, 2% not well).
Foreign born population: 10 (0.6%) (37.6% of them are naturalized citizens)
This zip code:
0.6%
Whole state:
22.7%
40%France
30%Thailand
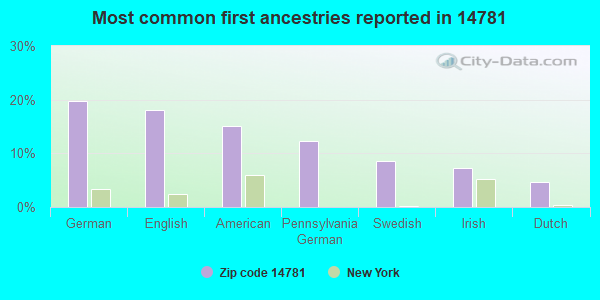
20%German
18%English
15%American
12%Pennsylvania German
9%Swedish
7%Irish
5%Dutch
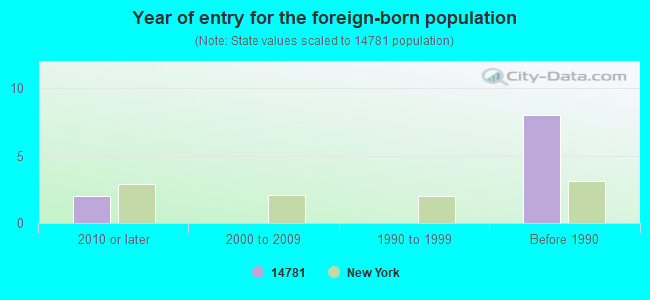
Year of entry for the foreign-born population
22010 or later
02000 to 2009
01990 to 1999
8Before 1990
Facilities with environmental interests located in this zip code:
DEWEY FARMS (8827 FRENCH CREEK ROAD in SHERMAN, NY)
STATE MASTER (New York facility tracking) - National Pollutant Discharge Elimination System Permit National Pollutant Discharge Elimination System NON-MAJOR (Tracking pollutant discharge elimination systems) - permit Business SIC classification: GENERAL FARMS, PRIMARILY LIVESTOCK AND ANIMAL SPECIALTIES Organizations: PERRY/BETTY DEWEY (CONTACT/OWNER)
Alternative names: PERRY DEWEY
CHAUTAUQUA COUNTY D P W (3709 PARK ST in SHERMAN, NY)
Small Quantity Generators, between 100 kg and 1000 kg of hazardous waste/month (Resource Conservation and Recovery Act (tracking hazardous waste)) - notification - ICIS-, ENFORCEMENT/COMPLIANCE ACTIVITY
Housing units lacking complete plumbing facilities: 1.5% Housing units lacking complete kitchen facilities: 0.3%
39.4%Utility gas
22.0%Bottled, tank, or LP gas
12.8%Wood
10.8%Fuel oil, kerosene, etc.
6.2%Other fuel
5.2%Electricity
2.7%Coal or coke
0.8%No fuel used
0.6%Solar energy
Population in 1990: 2,184.
Place of birth for U.S.-born residents:
This state: 1,089
Northeast: 517
Midwest: 87
South: 48
West: 44
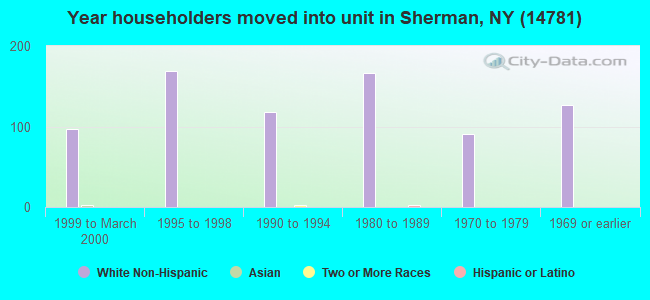
64% of the 14781 zip code residents lived in the same house 5 years ago. Out of people who lived in different houses, 77% lived in this county. Out of people who lived in different counties, 50% lived in New York.
94% of the 14781 zip code residents lived in the same house 1 year ago. Out of people who lived in different houses, 38% moved from this county. Out of people who lived in different houses, 18% moved from different county within same state. Out of people who lived in different houses, 30% moved from different state. Out of people who lived in different houses, 15% moved from abroad.
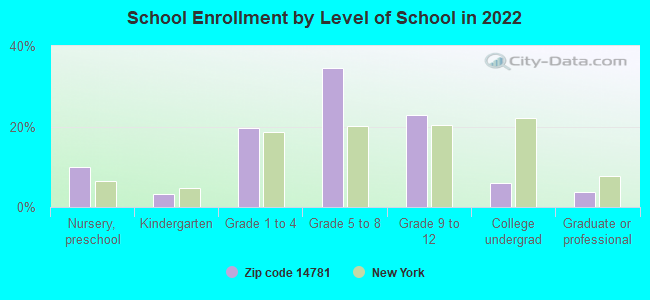
Private vs. public school enrollment:
Students in private schools in grades 1 to 8 (elementary and middle school): 41
Here:
21.5%
New York:
15.6%
Students in private schools in grades 9 to 12 (high school): 8
Here:
10.2%
New York:
15.0%
Students in private undergraduate colleges: 2
Here:
13.9%
New York:
39.2%
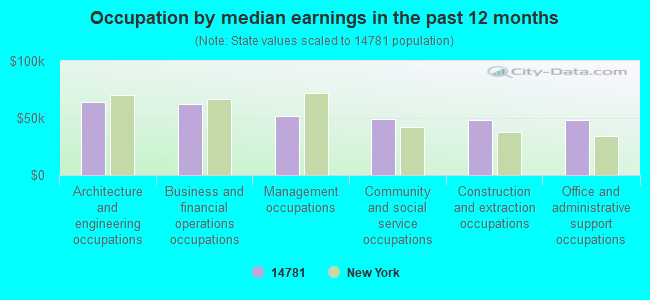
Occupation by median earnings in the past 12 months ($)
63,712Architecture and engineering occupations
62,413Business and financial operations occupations
51,931Management occupations
49,212Community and social service occupations
48,046Construction and extraction occupations
47,882Office and administrative support occupations
Top industries in this zip code by the number of employees in 2005:
Health Care and Social Assistance: Offices of Physicians (except Mental Health Specialists) (10-19 employees: 2 establishments)
Accommodation and Food Services: Full-Service Restaurants (5-9: 2, 1-4: 1)
Other Services (except Public Administration): General Automotive Repair (5-9: 1, 1-4: 1)
Construction: Plumbing, Heating, and Air-Conditioning Contractors (1-4: 4)
Other Services (except Public Administration): Commercial and Industrial Machinery and Equipment (except Automotive and Electronic) Repair and Maintenance (5-9: 1)
Finance and Insurance: Commercial Banking (5-9: 1)
Fatal accident statistics in 2011:
Fatal accident count: 2
Vehicles involved in fatal accidents: 3
Fatal accidents caused by drunken drivers: 0
Fatalities: 2
Persons involved in fatal accidents: 3
Pedestrians involved in fatal accidents: 0
Home Mortgage Disclosure Act Aggregated Statistics For Year 2003 (Based on 8 partial tracts)
A) FHA, FSA/RHS & VA Home Purchase Loans
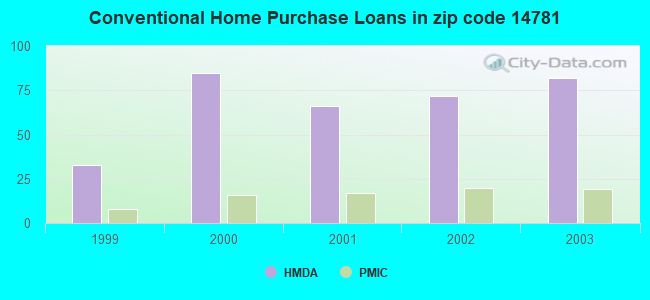
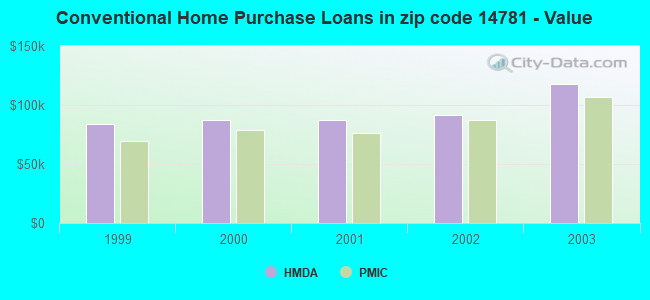
B) Conventional Home Purchase Loans
C) Refinancings
D) Home Improvement Loans
E) Loans on Dwellings For 5+ Families
F) Non-occupant Loans on < 5 Family Dwellings (A B C & D)
Number
Average Value
Number
Average Value
Number
Average Value
Number
Average Value
Number
Average Value
Number
Average Value
LOANS ORIGINATED
12
$66,612
82
$118,185
163
$83,015
63
$10,247
1
$153,720
57
$150,258
APPLICATIONS APPROVED, NOT ACCEPTED
1
$63,430
5
$88,240
27
$88,277
4
$19,342
0
$0
5
$175,734
APPLICATIONS DENIED
2
$68,760
18
$55,369
118
$76,314
25
$23,180
0
$0
8
$153,561
APPLICATIONS WITHDRAWN
0
$0
7
$70,123
73
$72,650
3
$23,523
0
$0
5
$100,302
FILES CLOSED FOR INCOMPLETENESS
0
$0
1
$87,590
4
$79,600
2
$45,440
0
$0
1
$119,390
Aggregated Statistics For Year 2002 (Based on 8 partial tracts)
A) FHA, FSA/RHS & VA Home Purchase Loans
B) Conventional Home Purchase Loans
C) Refinancings
D) Home Improvement Loans
F) Non-occupant Loans on < 5 Family Dwellings (A B C & D)
Number
Average Value
Number
Average Value
Number
Average Value
Number
Average Value
Number
Average Value
LOANS ORIGINATED
8
$67,876
72
$91,778
127
$87,979
52
$11,577
46
$144,470
APPLICATIONS APPROVED, NOT ACCEPTED
1
$46,190
10
$68,551
28
$74,829
2
$22,050
6
$138,373
APPLICATIONS DENIED
1
$42,840
14
$63,724
101
$63,616
14
$18,554
6
$101,733
APPLICATIONS WITHDRAWN
1
$54,060
5
$74,390
66
$73,559
4
$24,660
3
$169,200
FILES CLOSED FOR INCOMPLETENESS
0
$0
1
$29,380
7
$86,073
0
$0
1
$158,500
Aggregated Statistics For Year 2001 (Based on 8 partial tracts)
A) FHA, FSA/RHS & VA Home Purchase Loans
B) Conventional Home Purchase Loans
C) Refinancings
D) Home Improvement Loans
F) Non-occupant Loans on < 5 Family Dwellings (A B C & D)
Number
Average Value
Number
Average Value
Number
Average Value
Number
Average Value
Number
Average Value
LOANS ORIGINATED
7
$52,520
66
$87,683
107
$78,889
57
$12,335
35
$136,098
APPLICATIONS APPROVED, NOT ACCEPTED
1
$23,180
15
$71,648
19
$69,559
5
$32,446
6
$124,690
APPLICATIONS DENIED
2
$62,800
30
$51,387
93
$54,253
15
$21,371
6
$92,313
APPLICATIONS WITHDRAWN
1
$71,540
11
$96,617
57
$63,671
6
$19,845
4
$167,480
FILES CLOSED FOR INCOMPLETENESS
0
$0
1
$34,470
4
$74,342
1
$35,960
1
$58,350
Aggregated Statistics For Year 2000 (Based on 8 partial tracts)
A) FHA, FSA/RHS & VA Home Purchase Loans
B) Conventional Home Purchase Loans
C) Refinancings
D) Home Improvement Loans
F) Non-occupant Loans on < 5 Family Dwellings (A B C & D)
Number
Average Value
Number
Average Value
Number
Average Value
Number
Average Value
Number
Average Value
LOANS ORIGINATED
12
$62,369
85
$87,131
47
$48,149
40
$12,262
28
$131,456
APPLICATIONS APPROVED, NOT ACCEPTED
1
$41,500
13
$57,081
17
$55,678
8
$23,876
4
$82,950
APPLICATIONS DENIED
3
$67,013
39
$55,433
54
$49,293
22
$23,068
5
$73,748
APPLICATIONS WITHDRAWN
1
$33,390
4
$69,065
29
$43,838
3
$29,517
1
$112,780
FILES CLOSED FOR INCOMPLETENESS
0
$0
2
$93,830
3
$49,147
0
$0
1
$122,570
Aggregated Statistics For Year 1999 (Based on 4 partial tracts)
A) FHA, FSA/RHS & VA Home Purchase Loans
B) Conventional Home Purchase Loans
C) Refinancings
D) Home Improvement Loans
F) Non-occupant Loans on < 5 Family Dwellings (A B C & D)
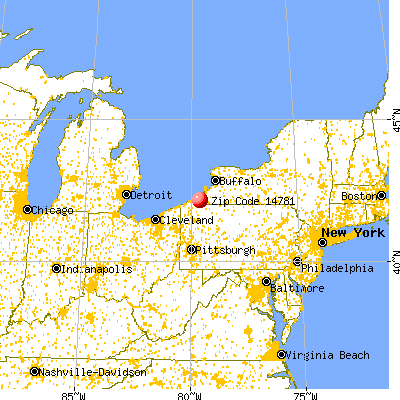


 Nearest zip codes: 14775, 14757, 14724, 14767, 14722, 14736.