Estimated zip code population in 2022: 1,417 Zip code population in 2010: 1,454 Zip code population in 2000: 2,531
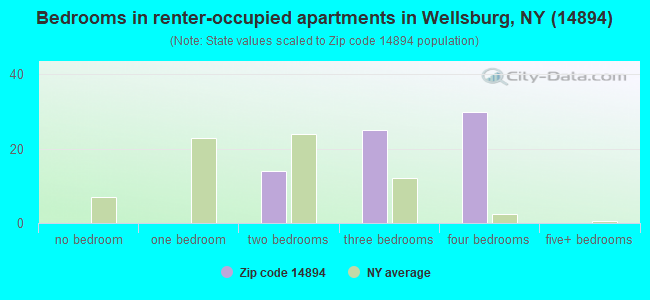
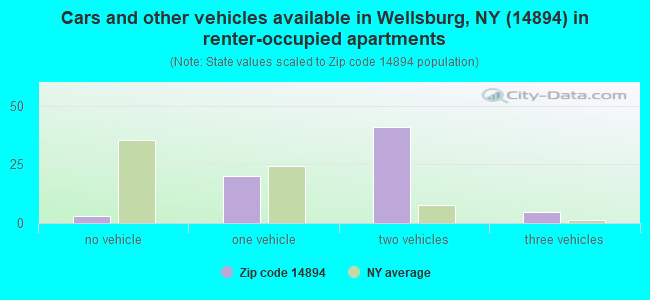
Houses and condos: 536 Renter-occupied apartments: 69
% of renters here:
15%
State:
46%
March 2022 cost of living index in zip code 14894: 94.7 (less than average, U.S. average is 100)
Land area: 11.3 sq. mi. Water area: 0.0 sq. mi.
Population density: 126 people per square mile
(very low).
OSM Map
General Map
Google Map
MSN Map
OSM Map
General Map
Google Map
MSN Map
OSM Map
General Map
Google Map
MSN Map
OSM Map
General Map
Google Map
MSN Map
Please wait while loading the map...
Real estate property taxes paid for housing units in 2022:
This zip code:
3.6% ($3,506)
New York:
1.5% ($6,180)
Median real estate property taxes paid for housing units with mortgages in 2022: $3,505 (2.5%) Median real estate property taxes paid for housing units with no mortgage in 2022: $3,505 (5.0%)
Business Search- 14 Million verified businesses
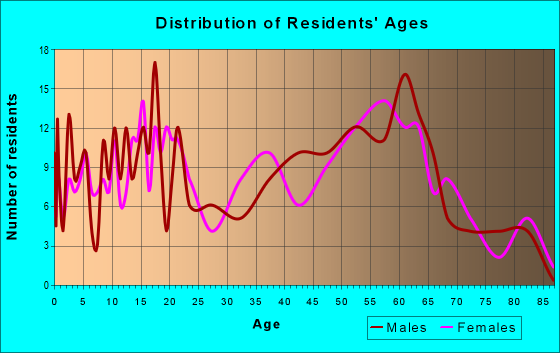
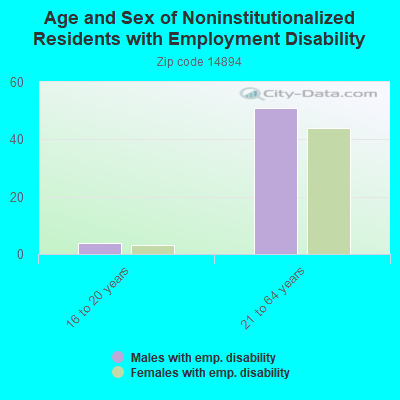
Males: 825
(58.3%)
Females: 591
(41.7%)
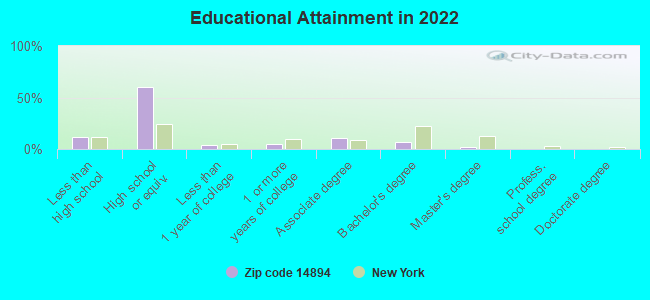
For population 25 years and over in 14894:
High school or higher: 86.3%
Bachelor's degree or higher: 8.5%
Graduate or professional degree: 2.0%
Unemployed: 4.0%
Mean travel time to work (commute): 22.2 minutes
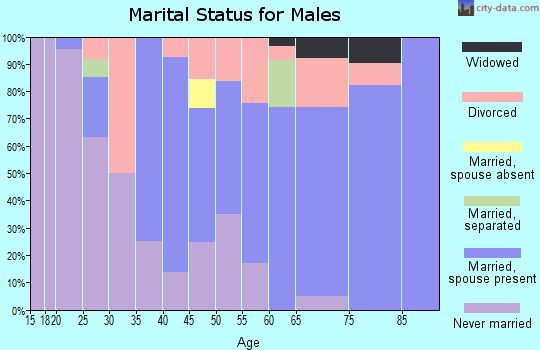
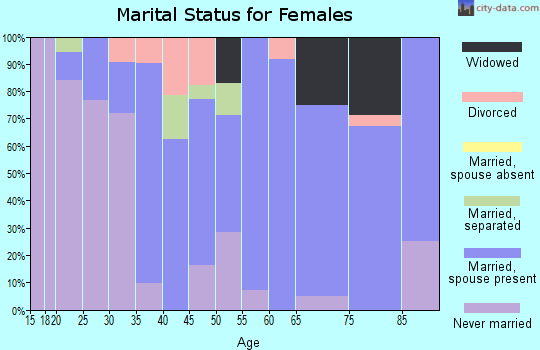
For population 15 years and over in 14894:
Never married: 31.7%
Now married: 42.4%
Separated: 5.1%
Widowed: 4.3%
Divorced: 16.5%
Zip code 14894 compared to state average:
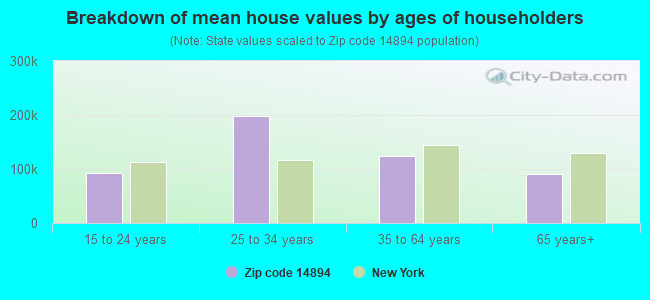
Median house value significantly below state average.
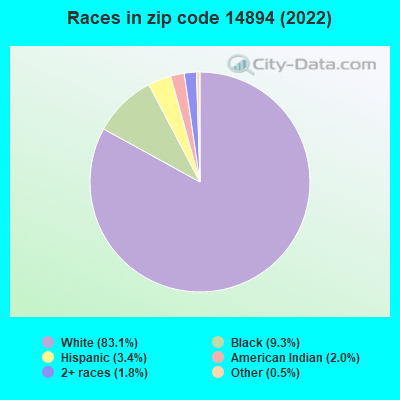
Hispanic race population percentage significantly below state average.
Foreign-born population percentage significantly below state average.
Renting percentage significantly below state average.
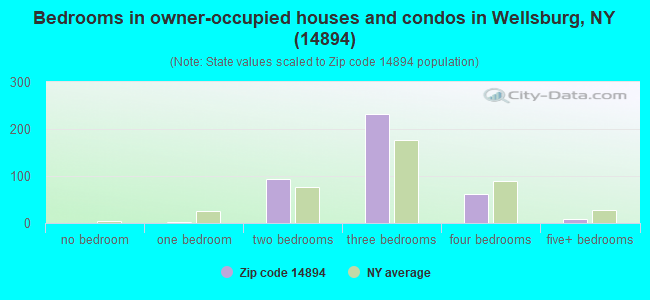
Number of rooms per house above state average.
House age below state average.
Number of college students below state average.
Percentage of population with a bachelor's degree or higher significantly below state average.
Averages for the 2020 tax year for zip code 14894, filed in 2021:
Average Adjusted Gross Income (AGI) in 2020: $48,757 (Individual Income Tax Returns)
Here:
$48,757
State:
$90,930
Salary/wage: $43,998 (reported on 80.0% of returns)
Here:
$43,998
State:
$72,104
(% of AGI for various income ranges: 1068.6% for AGIs below $25k, 3018.1% for AGIs $25k-50k, 6741.7% for AGIs $50k-75k, 9870.0% for AGIs $75k-100k, 17002.5% for AGIs $100k-200k)
Taxable interest for individuals: $272 (reported on 30.0% of returns)
This zip code:
$272
New York:
$3,075
(% of AGI for various income ranges: 8.6% for AGIs below $25k, 1.9% for AGIs $25k-50k, 28.3% for AGIs $50k-75k, 22.5% for AGIs $75k-100k, 20.0% for AGIs $100k-200k)
Ordinary dividends: $1,429 (reported on 11.7% of returns)
Here:
$1,429
State:
$11,095
(% of AGI for various income ranges: 39.4% for AGIs $25k-50k, 92.5% for AGIs $75k-100k)
Net capital gain/loss in AGI: +$1,760 (reported on 8.3% of returns)
Here:
+$1,760
State:
+$44,925
(% of AGI for various income ranges: 12.1% for AGIs below $25k, 177.5% for AGIs $75k-100k)
Profit/loss from business: +$3,125 (reported on 6.7% of returns)
Here:
+$3,125
State:
+$14,940
(% of AGI for various income ranges: 78.1% for AGIs $25k-50k)
Taxable individual retirement arrangement distribution: $10,620 (reported on 8.3% of returns)
14894:
$10,620
New York:
$19,609
(% of AGI for various income ranges: 331.9% for AGIs $25k-50k)
Earned income credit: $2,118 (reported on 18.3% of returns)
Here:
$2,118
State:
$2,138
(% of AGI for various income ranges: 84.3% for AGIs below $25k, 71.9% for AGIs $25k-50k)
Percentage of individuals using paid preparers for their 2020 taxes: 96.7%
Here:
97%
State:
95%
(% for various income ranges: 100.0% for AGIs below $25k, 94.4% for AGIs $25k-50k, 90.0% for AGIs $50k-75k, 100.0% for AGIs $75k-100k, 100.0% for AGIs $100k-200k)
Averages for the 2012 tax year for zip code 14894, filed in 2013:
Average Adjusted Gross Income (AGI) in 2012: $42,683 (Individual Income Tax Returns)
Here:
$42,683
State:
$77,088
Salary/wage: $36,144 (reported on 89.1% of returns)
Here:
$36,144
State:
$60,593
(% of AGI for various income ranges: 74.7% for AGIs below $25k, 79.4% for AGIs $25k-50k, 75.1% for AGIs $50k-75k, 77.0% for AGIs $75k-100k, 72.1% for AGIs $100k-200k)
Taxable interest for individuals: $310 (reported on 31.2% of returns)
This zip code:
$310
New York:
$3,125
(% of AGI for various income ranges: 0.9% for AGIs below $25k, 0.2% for AGIs $25k-50k, 0.1% for AGIs $75k-100k, 0.1% for AGIs $100k-200k)
Ordinary dividends: $878 (reported on 14.1% of returns)
Here:
$878
State:
$10,299
(% of AGI for various income ranges: 0.4% for AGIs below $25k, 0.8% for AGIs $25k-50k, 0.4% for AGIs $75k-100k)
Net capital gain/loss in AGI: +$33 (reported on 4.7% of returns)
Here:
+$33
State:
+$42,474
Profit/loss from business: +$4,660 (reported on 7.8% of returns)
Here:
+$4,660
State:
+$16,168
Taxable individual retirement arrangement distribution: $5,280 (reported on 7.8% of returns)
14894:
$5,280
New York:
$17,621
Total itemized deductions: $17,992 (20% of AGI, reported on 18.8% of returns)
Here:
$17,992
State:
$34,985
Here:
20.2% of AGI
State:
21.3% of AGI
(% of AGI for various income ranges: 7.4% for AGIs below $25k, 9.5% for AGIs $50k-75k, 9.9% for AGIs $75k-100k, 10.9% for AGIs $100k-200k)
Charity contributions: $3,188 (reported on 12.5% of returns)
Here:
$3,188
State:
$5,572
(% of AGI for various income ranges: 1.6% for AGIs $50k-75k, 1.2% for AGIs $75k-100k, 1.3% for AGIs $100k-200k)
Taxes paid: $7,858 (reported on 18.8% of returns)
14894:
$7,858
State:
$18,656
(% of AGI for various income ranges: 2.2% for AGIs below $25k, 3.5% for AGIs $50k-75k, 4.2% for AGIs $75k-100k, 5.9% for AGIs $100k-200k)
Earned income credit: $2,086 (reported on 21.9% of returns)
Here:
$2,086
State:
$2,230
(% of AGI for various income ranges: 6.3% for AGIs below $25k, 1.4% for AGIs $25k-50k)
Percentage of individuals using paid preparers for their 2012 taxes: 50.0%
Here:
50%
State:
66%
(% for various income ranges: 37.9% for AGIs below $25k, 50.0% for AGIs $25k-50k, 60.0% for AGIs $50k-75k, 66.7% for AGIs $75k-100k, 80.0% for AGIs $100k-200k)
Averages for the 2004 tax year for zip code 14894, filed in 2005:
Average Adjusted Gross Income (AGI) in 2004: $32,427 (Individual Income Tax Returns)
Here:
$32,427
State:
$59,519
Salary/wage: $30,799 (reported on 86.8% of returns)
Here:
$30,799
State:
$50,673
(% of AGI for various income ranges: 118.6% for AGIs below $10k, 74.7% for AGIs $10k-25k, 84.7% for AGIs $25k-50k, 85.0% for AGIs $50k-75k, 81.1% for AGIs $75k-100k, 69.0% for AGIs over 100k)
Taxable interest for individuals: $536 (reported on 40.1% of returns)
This zip code:
$536
New York:
$2,377
(% of AGI for various income ranges: 4.3% for AGIs below $10k, 1.1% for AGIs $10k-25k, 0.3% for AGIs $25k-50k, 0.7% for AGIs $50k-75k, 0.2% for AGIs $75k-100k, 0.8% for AGIs over 100k)
Taxable dividends: $561 (reported on 16.6% of returns)
Here:
$561
State:
$5,394
(% of AGI for various income ranges: 1.8% for AGIs below $10k, 0.4% for AGIs $10k-25k, 0.3% for AGIs $25k-50k, 0.2% for AGIs $50k-75k, 0.2% for AGIs $75k-100k)
Net capital gain/loss: +$703 (reported on 10.8% of returns)
Here:
+$703
State:
+$23,581
(% of AGI for various income ranges: -0.7% for AGIs $10k-25k, 0.3% for AGIs $25k-50k, 0.5% for AGIs $50k-75k, 0.6% for AGIs $75k-100k)
Profit/loss from business: +$4,216 (reported on 10.8% of returns)
Here:
+$4,216
State:
+$13,809
(% of AGI for various income ranges: 15.2% for AGIs below $10k, 2.2% for AGIs $10k-25k, 0.8% for AGIs $25k-50k, 1.3% for AGIs $50k-75k)
Total itemized deductions: $12,916 (21% of AGI, reported on 17.3% of returns)
Here:
$12,916
State:
$25,864
Here:
21.0% of AGI
State:
21.9% of AGI
(% of AGI for various income ranges: 6.4% for AGIs $10k-25k, 3.3% for AGIs $25k-50k, 8.6% for AGIs $50k-75k, 8.9% for AGIs $75k-100k, 12.9% for AGIs over 100k)
Charity contributions deductions: $2,237 (3% of AGI, reported on 14.1% of returns)
Here:
$2,237
State:
$4,439
Here:
3.4% of AGI
State:
3.6% of AGI
(% of AGI for various income ranges: 2.4% for AGIs below $10k, 0.4% for AGIs $25k-50k, 1.6% for AGIs $50k-75k, 0.9% for AGIs $75k-100k, 1.8% for AGIs over 100k)
Total tax: $3,781 (reported on 70.2% of returns)
14894:
$3,781
State:
$11,730
(% of AGI for various income ranges: 3.5% for AGIs below $10k, 3.4% for AGIs $10k-25k, 6.5% for AGIs $25k-50k, 9.1% for AGIs $50k-75k, 10.3% for AGIs $75k-100k, 16.0% for AGIs over 100k)
Earned income credit: $1,413 (reported on 20.1% of returns)
Here:
$1,413
State:
$1,757
Percentage of individuals using paid preparers for their 2004 taxes: 61.0%
Here:
61%
State:
67%
(% for various income ranges: 52.8% for AGIs below $10k, 62.4% for AGIs $10k-25k, 63.1% for AGIs $25k-50k, 65.7% for AGIs $50k-75k, 62.8% for AGIs $75k-100k, 70.6% for AGIs over 100k)
Likely homosexual households (counted as self-reported same-sex unmarried-partner households)
Lesbian couples: 1.2% of all households
Gay men: 0.0% of all households
Household received Food Stamps/SNAP in the past 12 months: 136 Household did not receive Food Stamps/SNAP in the past 12 months: 340
Women who had a birth in the past 12 months: 25 (5 now married, 21 unmarried) Women who did not have a birth in the past 12 months: 258 (104 now married, 153 unmarried)
Housing units in zip code 14894 with a mortgage: 207 (30 second mortgage, 6 home equity loan, 24 both second mortgage and home equity loan) Houses without a mortgage: 9
Median monthly owner costs for units with a mortgage: $1,367 Median monthly owner costs for units without a mortgage: $608
Residents with income below the poverty level in 2022:
This zip code:
25.7%
Whole state:
14.3%
Residents with income below 50% of the poverty level in 2022:
This zip code:
14.4%
Whole state:
6.8%
Median number of rooms in houses and condos:
Here:
6.2
State:
6.3
Median number of rooms in apartments:
Here:
6.4
State:
3.8
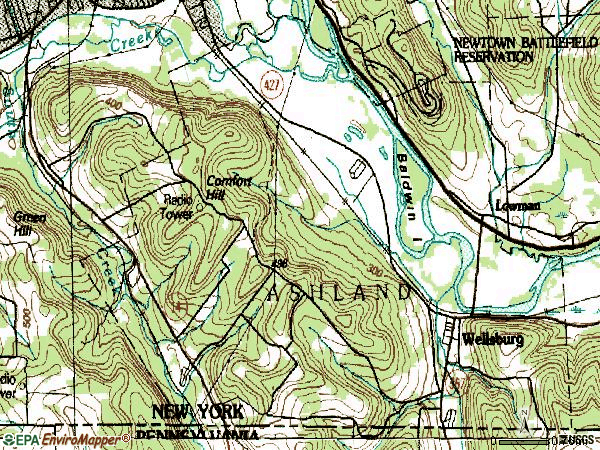
Notable locations in this zip code not listed on our city pages
In group quarters: 262 (-1 institutionalized population)
Size of family households: 117 2-persons, 47 3-persons, 55 4-persons, 41 5-persons, 3 6-persons, 9 7-or-more-persons
Size of nonfamily households: 135 1-person, 59 2-persons, 1 3-persons
135 married couples with children.
62 single-parent households (44 men, 18 women).
97.4% of residents of 14894 zip code speak English at home.
0.2% of residents speak Spanish at home (100% very well).
0.2% of residents speak other Indo-European language at home (33% very well, 67% well).
1.7% of residents speak other language at home (100% very well).
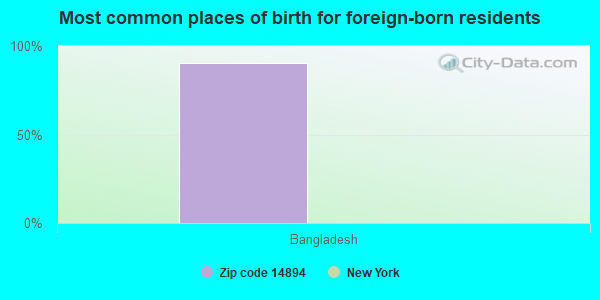
Foreign born population: 22 (1.6%) (100.0% of them are naturalized citizens)
This zip code:
1.6%
Whole state:
22.7%
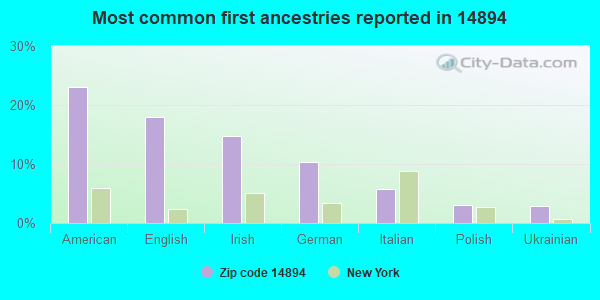
90%Bangladesh
23%American
18%English
15%Irish
10%German
6%Italian
3%Polish
3%Ukrainian
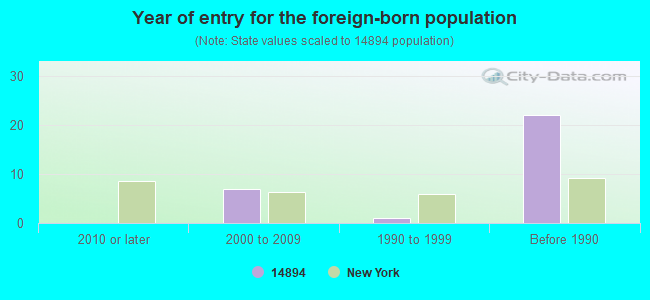
Year of entry for the foreign-born population
02010 or later
72000 to 2009
11990 to 1999
22Before 1990
Facilities with environmental interests located in this zip code:
ALCOR EQUIPMENT CO/STEROMAK REALTY CO (3684 FRONT ST in WELLSBURG, NY)
(Integrated Compliance Information System) - ICIS-02-1994-0014, FORMAL ENFORCEMENT ACTION
Housing units lacking complete plumbing facilities: 1.9% Housing units lacking complete kitchen facilities: 0.9%
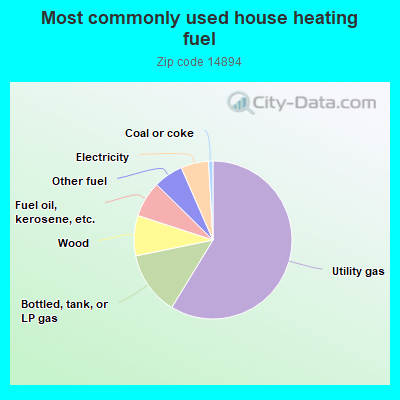
59.1%Utility gas
13.1%Bottled, tank, or LP gas
8.3%Wood
7.4%Fuel oil, kerosene, etc.
6.1%Other fuel
5.7%Electricity
0.9%Coal or coke
Population in 1990: 2,829.
Place of birth for U.S.-born residents:
This state: 1,113
Northeast: 195
Midwest: 11
South: 53
West: 5
59% of the 14894 zip code residents lived in the same house 5 years ago. Out of people who lived in different houses, 41% lived in this county. Out of people who lived in different counties, 50% lived in New York.
94% of the 14894 zip code residents lived in the same house 1 year ago. Out of people who lived in different houses, 70% moved from this county. Out of people who lived in different houses, 19% moved from different county within same state. Out of people who lived in different houses, 6% moved from different state.
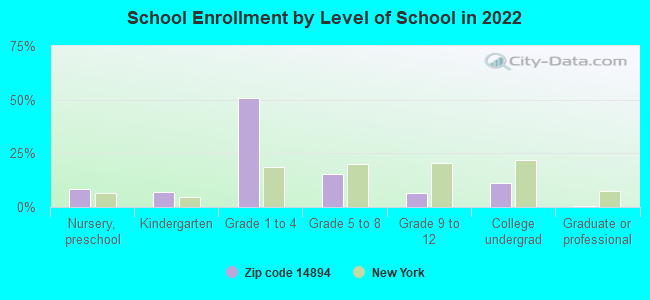
Private vs. public school enrollment:
Students in private schools in grades 1 to 8 (elementary and middle school): 1
Here:
0.7%
New York:
15.6%
Students in private schools in grades 9 to 12 (high school):
Here:
0.0%
New York:
15.0%
Students in private undergraduate colleges: 10
Here:
44.0%
New York:
39.2%
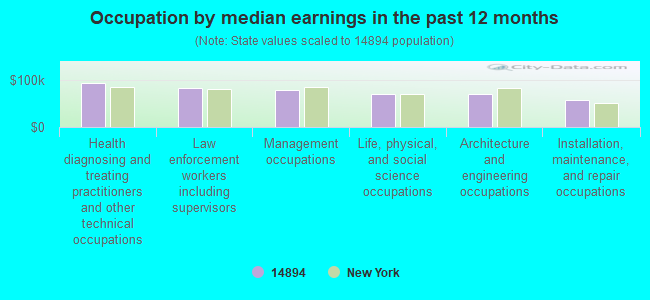
Occupation by median earnings in the past 12 months ($)
92,960Health diagnosing and treating practitioners and other technical occupations
82,888Law enforcement workers including supervisors
78,506Management occupations
70,141Life, physical, and social science occupations
68,844Architecture and engineering occupations
58,081Installation, maintenance, and repair occupations
Top industries in this zip code by the number of employees in 2005:
Health Care and Social Assistance: Other Residential Care Facilities (10-19 employees: 1 establishment)
Health Care and Social Assistance: Residential Mental Retardation Facilities (10-19: 1)
Construction: Commercial and Institutional Building Construction (10-19: 1)
Other Services (except Public Administration): Labor Unions and Similar Labor Organizations (1-4: 2)
People in group quarters in 2010:
9 people in group homes for juveniles (non-correctional)
8 people in group homes intended for adults
People in group quarters in 2000:
944 people in state prisons
8 people in homes for the mentally retarded
Fatal accident statistics in 2012:
Fatal accident count: 1
Vehicles involved in fatal accidents: 1
Fatal accidents caused by drunken drivers: 0
Fatalities: 1
Persons involved in fatal accidents: 2
Pedestrians involved in fatal accidents: 0
Fatal accident statistics in 2011:
Fatal accident count: 1
Vehicles involved in fatal accidents: 3
Fatal accidents caused by drunken drivers: 0
Fatalities: 1
Persons involved in fatal accidents: 6
Pedestrians involved in fatal accidents: 0
Home Mortgage Disclosure Act Aggregated Statistics For Year 2009 (Based on 2 partial tracts)
A) FHA, FSA/RHS & VA Home Purchase Loans
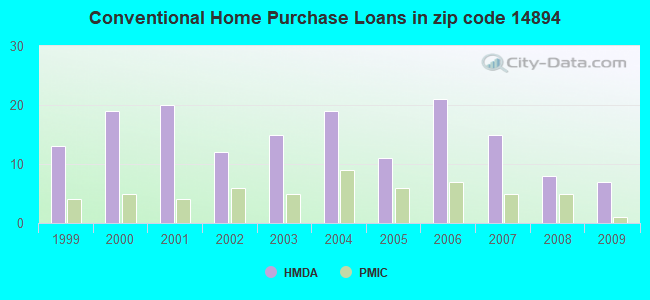
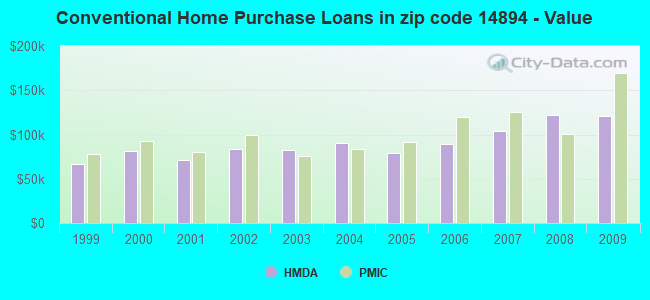
B) Conventional Home Purchase Loans
C) Refinancings
D) Home Improvement Loans
F) Non-occupant Loans on < 5 Family Dwellings (A B C & D)
G) Loans On Manufactured Home Dwelling (A B C & D)
Number
Average Value
Number
Average Value
Number
Average Value
Number
Average Value
Number
Average Value
Number
Average Value
LOANS ORIGINATED
7
$103,270
7
$120,450
24
$106,163
12
$26,536
1
$51,350
0
$0
APPLICATIONS APPROVED, NOT ACCEPTED
0
$0
1
$106,740
2
$136,470
0
$0
0
$0
1
$104,940
APPLICATIONS DENIED
0
$0
6
$85,125
8
$119,919
3
$20,567
0
$0
4
$54,950
APPLICATIONS WITHDRAWN
0
$0
1
$136,920
5
$82,604
0
$0
0
$0
0
$0
FILES CLOSED FOR INCOMPLETENESS
0
$0
0
$0
1
$120,710
0
$0
0
$0
0
$0
Aggregated Statistics For Year 2008 (Based on 2 partial tracts)
A) FHA, FSA/RHS & VA Home Purchase Loans
B) Conventional Home Purchase Loans
C) Refinancings
D) Home Improvement Loans
F) Non-occupant Loans on < 5 Family Dwellings (A B C & D)
Number
Average Value
Number
Average Value
Number
Average Value
Number
Average Value
Number
Average Value
LOANS ORIGINATED
3
$84,827
8
$121,608
10
$97,061
12
$26,536
1
$161,240
APPLICATIONS APPROVED, NOT ACCEPTED
0
$0
1
$132,420
2
$92,555
0
$0
0
$0
APPLICATIONS DENIED
1
$133,770
0
$0
13
$99,262
6
$43,613
1
$32,880
APPLICATIONS WITHDRAWN
0
$0
0
$0
6
$98,938
1
$84,680
0
$0
FILES CLOSED FOR INCOMPLETENESS
0
$0
0
$0
0
$0
0
$0
0
$0
Aggregated Statistics For Year 2007 (Based on 2 partial tracts)
A) FHA, FSA/RHS & VA Home Purchase Loans
B) Conventional Home Purchase Loans
C) Refinancings
D) Home Improvement Loans
F) Non-occupant Loans on < 5 Family Dwellings (A B C & D)
G) Loans On Manufactured Home Dwelling (A B C & D)
Number
Average Value
Number
Average Value
Number
Average Value
Number
Average Value
Number
Average Value
Number
Average Value
LOANS ORIGINATED
3
$105,693
15
$104,103
18
$88,103
19
$34,231
1
$71,610
2
$28,600
APPLICATIONS APPROVED, NOT ACCEPTED
0
$0
2
$79,495
7
$105,329
2
$17,790
1
$86,930
0
$0
APPLICATIONS DENIED
0
$0
3
$104,193
16
$70,826
5
$33,150
0
$0
1
$4,050
APPLICATIONS WITHDRAWN
0
$0
3
$60,353
8
$105,225
2
$70,490
0
$0
0
$0
FILES CLOSED FOR INCOMPLETENESS
0
$0
0
$0
2
$108,320
0
$0
0
$0
0
$0
Aggregated Statistics For Year 2006 (Based on 2 partial tracts)
A) FHA, FSA/RHS & VA Home Purchase Loans
B) Conventional Home Purchase Loans
C) Refinancings
D) Home Improvement Loans
F) Non-occupant Loans on < 5 Family Dwellings (A B C & D)
G) Loans On Manufactured Home Dwelling (A B C & D)
Number
Average Value
Number
Average Value
Number
Average Value
Number
Average Value
Number
Average Value
Number
Average Value
LOANS ORIGINATED
1
$60,800
21
$89,093
27
$66,976
21
$36,568
5
$56,930
2
$25,900
APPLICATIONS APPROVED, NOT ACCEPTED
0
$0
4
$62,155
5
$112,240
2
$43,690
1
$94,130
1
$29,280
APPLICATIONS DENIED
0
$0
5
$69,632
31
$93,422
14
$27,249
1
$61,700
3
$28,227
APPLICATIONS WITHDRAWN
0
$0
2
$100,890
17
$88,464
1
$64,860
2
$117,555
0
$0
FILES CLOSED FOR INCOMPLETENESS
0
$0
0
$0
4
$94,132
0
$0
0
$0
0
$0
Aggregated Statistics For Year 2005 (Based on 2 partial tracts)
A) FHA, FSA/RHS & VA Home Purchase Loans
B) Conventional Home Purchase Loans
C) Refinancings
D) Home Improvement Loans
F) Non-occupant Loans on < 5 Family Dwellings (A B C & D)
G) Loans On Manufactured Home Dwelling (A B C & D)
Number
Average Value
Number
Average Value
Number
Average Value
Number
Average Value
Number
Average Value
Number
Average Value
LOANS ORIGINATED
3
$85,577
11
$79,311
22
$81,338
22
$17,074
1
$19,820
1
$29,280
APPLICATIONS APPROVED, NOT ACCEPTED
0
$0
2
$38,510
5
$97,016
1
$47,740
0
$0
0
$0
APPLICATIONS DENIED
0
$0
5
$65,668
24
$108,021
9
$51,997
1
$73,420
2
$18,465
APPLICATIONS WITHDRAWN
0
$0
3
$68,310
20
$94,832
2
$36,710
1
$95,940
0
$0
FILES CLOSED FOR INCOMPLETENESS
0
$0
0
$0
4
$91,770
1
$69,810
0
$0
0
$0
Aggregated Statistics For Year 2004 (Based on 2 partial tracts)
B) Conventional Home Purchase Loans
C) Refinancings
D) Home Improvement Loans
F) Non-occupant Loans on < 5 Family Dwellings (A B C & D)
G) Loans On Manufactured Home Dwelling (A B C & D)
Number
Average Value
Number
Average Value
Number
Average Value
Number
Average Value
Number
Average Value
LOANS ORIGINATED
19
$90,198
34
$76,740
19
$20,410
1
$83,320
1
$151,780
APPLICATIONS APPROVED, NOT ACCEPTED
2
$128,365
5
$57,562
3
$34,380
0
$0
0
$0
APPLICATIONS DENIED
5
$142,506
16
$78,454
10
$20,854
1
$47,740
2
$46,840
APPLICATIONS WITHDRAWN
2
$78,145
18
$78,394
2
$67,110
1
$73,420
0
$0
FILES CLOSED FOR INCOMPLETENESS
0
$0
5
$79,540
0
$0
0
$0
0
$0
Aggregated Statistics For Year 2003 (Based on 2 partial tracts)
A) FHA, FSA/RHS & VA Home Purchase Loans
B) Conventional Home Purchase Loans
C) Refinancings
D) Home Improvement Loans
F) Non-occupant Loans on < 5 Family Dwellings (A B C & D)
Number
Average Value
Number
Average Value
Number
Average Value
Number
Average Value
Number
Average Value
LOANS ORIGINATED
2
$98,640
15
$82,363
64
$77,208
13
$16,561
3
$52,997
APPLICATIONS APPROVED, NOT ACCEPTED
1
$40,990
3
$84,977
8
$75,611
0
$0
0
$0
APPLICATIONS DENIED
0
$0
6
$53,297
24
$65,890
7
$21,169
1
$64,410
APPLICATIONS WITHDRAWN
0
$0
2
$46,840
14
$75,635
1
$72,960
1
$40,990
FILES CLOSED FOR INCOMPLETENESS
0
$0
1
$92,330
4
$87,828
0
$0
0
$0
Aggregated Statistics For Year 2002 (Based on 2 partial tracts)
A) FHA, FSA/RHS & VA Home Purchase Loans
B) Conventional Home Purchase Loans
C) Refinancings
D) Home Improvement Loans
F) Non-occupant Loans on < 5 Family Dwellings (A B C & D)
Number
Average Value
Number
Average Value
Number
Average Value
Number
Average Value
Number
Average Value
LOANS ORIGINATED
2
$65,760
12
$83,924
36
$75,454
11
$25,673
1
$55,850
APPLICATIONS APPROVED, NOT ACCEPTED
0
$0
1
$59,450
6
$92,332
2
$26,575
0
$0
APPLICATIONS DENIED
1
$121,610
10
$32,429
25
$60,282
6
$10,058
3
$54,500
APPLICATIONS WITHDRAWN
0
$0
1
$116,650
14
$80,557
0
$0
0
$0
FILES CLOSED FOR INCOMPLETENESS
0
$0
0
$0
4
$63,055
0
$0
0
$0
Aggregated Statistics For Year 2001 (Based on 2 partial tracts)
A) FHA, FSA/RHS & VA Home Purchase Loans
B) Conventional Home Purchase Loans
C) Refinancings
D) Home Improvement Loans
F) Non-occupant Loans on < 5 Family Dwellings (A B C & D)
Number
Average Value
Number
Average Value
Number
Average Value
Number
Average Value
Number
Average Value
LOANS ORIGINATED
5
$78,100
20
$70,938
37
$69,995
16
$18,692
4
$42,225
APPLICATIONS APPROVED, NOT ACCEPTED
0
$0
6
$61,630
5
$87,108
1
$6,310
0
$0
APPLICATIONS DENIED
0
$0
18
$39,210
18
$58,427
7
$5,856
1
$62,610
APPLICATIONS WITHDRAWN
0
$0
2
$83,775
11
$50,608
2
$16,215
1
$46,390
FILES CLOSED FOR INCOMPLETENESS
0
$0
1
$39,640
2
$50,445
0
$0
0
$0
Aggregated Statistics For Year 2000 (Based on 2 partial tracts)
A) FHA, FSA/RHS & VA Home Purchase Loans
B) Conventional Home Purchase Loans
C) Refinancings
D) Home Improvement Loans
F) Non-occupant Loans on < 5 Family Dwellings (A B C & D)
Number
Average Value
Number
Average Value
Number
Average Value
Number
Average Value
Number
Average Value
LOANS ORIGINATED
2
$55,850
19
$81,380
10
$57,966
11
$11,997
0
$0
APPLICATIONS APPROVED, NOT ACCEPTED
0
$0
12
$57,651
8
$60,129
1
$23,420
0
$0
APPLICATIONS DENIED
1
$45,040
50
$37,617
15
$44,169
6
$17,340
2
$56,075
APPLICATIONS WITHDRAWN
0
$0
2
$38,960
8
$46,954
0
$0
0
$0
FILES CLOSED FOR INCOMPLETENESS
0
$0
0
$0
1
$86,480
0
$0
0
$0
Aggregated Statistics For Year 1999 (Based on 1 partial tract)
Detailed PMIC statistics for the following Tracts:0112.00
2002 - 2018 National Fire Incident Reporting System (NFIRS) incidents
According to the data from the years 2002 - 2018 the average number of fires per year is 7. The highest number of reported fire incidents - 17 took place in 2016, and the least - 1 in 2004. The data has a decreasing trend.
When looking into fire subcategories, the most reports belonged to: Structure Fires (39.1%), and Outside Fires (32.2%).
Fire incident types reported to NFIRS in Zip Code 14894


 Nearest zip codes: 14904, 16925, 14901, 14905, 14861, 14871.
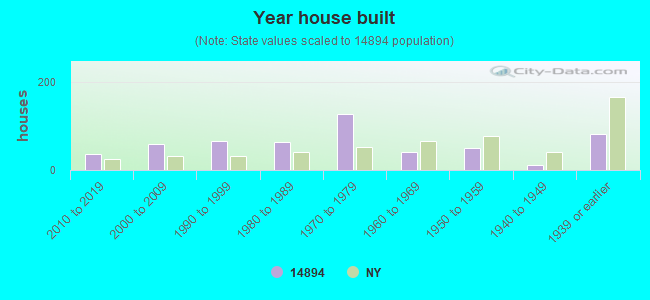


 According to the data from the years 2002 - 2018 the average number of fires per year is 7. The highest number of reported fire incidents - 17 took place in 2016, and the least - 1 in 2004. The data has a decreasing trend.
 When looking into fire subcategories, the most reports belonged to: Structure Fires (39.1%), and Outside Fires (32.2%).