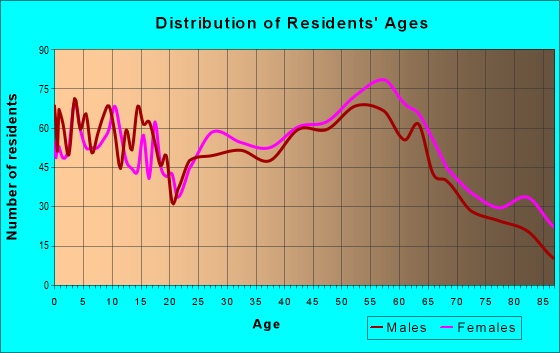
Estimated zip code population in 2022: 8,711 Zip code population in 2010: 9,070 Zip code population in 2000: 9,407
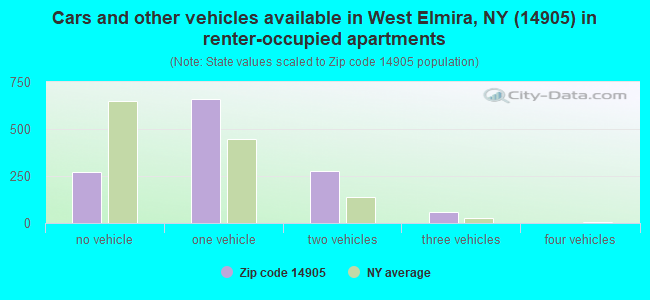
Houses and condos: 4,302 Renter-occupied apartments: 1,264
% of renters here:
32%
State:
46%
March 2022 cost of living index in zip code 14905: 101.9 (near average, U.S. average is 100)
Land area: 4.2 sq. mi. Water area: 0.2 sq. mi.
Population density: 2,091 people per square mile
(low).
OSM Map
General Map
Google Map
MSN Map
OSM Map
General Map
Google Map
MSN Map
OSM Map
General Map
Google Map
MSN Map
OSM Map
General Map
Google Map
MSN Map
Please wait while loading the map...
Real estate property taxes paid for housing units in 2022:
This zip code:
2.5% ($4,225)
New York:
1.5% ($6,180)
Median real estate property taxes paid for housing units with mortgages in 2022: $4,440 (2.6%) Median real estate property taxes paid for housing units with no mortgage in 2022: $3,782 (2.4%)
Averages for the 2020 tax year for zip code 14905, filed in 2021:
Average Adjusted Gross Income (AGI) in 2020: $72,667 (Individual Income Tax Returns)
Here:
$72,667
State:
$90,930
Salary/wage: $57,330 (reported on 78.8% of returns)
Here:
$57,330
State:
$72,104
(% of AGI for various income ranges: 1024.9% for AGIs below $25k, 3224.9% for AGIs $25k-50k, 5534.2% for AGIs $50k-75k, 8201.6% for AGIs $75k-100k, 15457.3% for AGIs $100k-200k, 83094.0% for AGIs over 200k)
Taxable interest for individuals: $996 (reported on 44.6% of returns)
This zip code:
$996
New York:
$3,075
(% of AGI for various income ranges: 15.7% for AGIs below $25k, 23.1% for AGIs $25k-50k, 33.1% for AGIs $50k-75k, 70.0% for AGIs $75k-100k, 92.2% for AGIs $100k-200k, 1634.0% for AGIs over 200k)
Ordinary dividends: $7,205 (reported on 24.7% of returns)
Here:
$7,205
State:
$11,095
(% of AGI for various income ranges: 33.9% for AGIs below $25k, 58.4% for AGIs $25k-50k, 106.5% for AGIs $50k-75k, 157.5% for AGIs $75k-100k, 333.7% for AGIs $100k-200k, 8996.0% for AGIs over 200k)
Net capital gain/loss in AGI: +$18,219 (reported on 19.9% of returns)
Here:
+$18,219
State:
+$44,925
(% of AGI for various income ranges: 10.9% for AGIs below $25k, 29.0% for AGIs $25k-50k, 122.1% for AGIs $50k-75k, 94.4% for AGIs $75k-100k, 638.3% for AGIs $100k-200k, 23558.0% for AGIs over 200k)
Profit/loss from business: +$15,041 (reported on 11.8% of returns)
Here:
+$15,041
State:
+$14,940
(% of AGI for various income ranges: 44.8% for AGIs below $25k, 86.8% for AGIs $25k-50k, 145.8% for AGIs $50k-75k, 267.2% for AGIs $75k-100k, 568.8% for AGIs $100k-200k, 5222.0% for AGIs over 200k)
Taxable individual retirement arrangement distribution: $19,875 (reported on 12.9% of returns)
14905:
$19,875
New York:
$19,609
(% of AGI for various income ranges: 63.3% for AGIs below $25k, 121.5% for AGIs $25k-50k, 256.3% for AGIs $50k-75k, 664.1% for AGIs $75k-100k, 777.3% for AGIs $100k-200k, 5838.0% for AGIs over 200k)
Self-employed (Keogh) retirement plans: $41,450 (reported on 0.5% of returns)
14905:
$41,450
New York:
$32,497
(% of AGI for various income ranges: 202.2% for AGIs $100k-200k)
Total itemized deductions: $30,858 (reported on 5.5% of returns)
Here:
$30,858
State:
$39,326
(% of AGI for various income ranges: 112.2% for AGIs $25k-50k, 178.8% for AGIs $50k-75k, 284.4% for AGIs $75k-100k, 577.6% for AGIs $100k-200k, 4578.0% for AGIs over 200k)
Charity contributions: $12,415 (reported on 4.6% of returns)
Here:
$12,415
State:
$15,420
(% of AGI for various income ranges: 63.3% for AGIs $50k-75k, 62.2% for AGIs $75k-100k, 153.9% for AGIs $100k-200k, 2648.0% for AGIs over 200k)
Taxes paid: $8,683 (reported on 5.5% of returns)
14905:
$8,683
State:
$9,183
(% of AGI for various income ranges: 22.3% for AGIs $25k-50k, 55.0% for AGIs $50k-75k, 114.4% for AGIs $75k-100k, 161.5% for AGIs $100k-200k, 1178.0% for AGIs over 200k)
Earned income credit: $2,104 (reported on 12.0% of returns)
Here:
$2,104
State:
$2,138
(% of AGI for various income ranges: 77.3% for AGIs below $25k, 47.3% for AGIs $25k-50k)
Percentage of individuals using paid preparers for their 2020 taxes: 96.1%
Here:
96%
State:
95%
(% for various income ranges: 96.0% for AGIs below $25k, 96.1% for AGIs $25k-50k, 95.7% for AGIs $50k-75k, 95.7% for AGIs $75k-100k, 95.7% for AGIs $100k-200k, 100.0% for AGIs over 200k)
Averages for the 2012 tax year for zip code 14905, filed in 2013:
Average Adjusted Gross Income (AGI) in 2012: $64,286 (Individual Income Tax Returns)
Here:
$64,286
State:
$77,088
Salary/wage: $52,571 (reported on 80.2% of returns)
Here:
$52,571
State:
$60,593
(% of AGI for various income ranges: 72.2% for AGIs below $25k, 69.8% for AGIs $25k-50k, 70.6% for AGIs $50k-75k, 66.9% for AGIs $75k-100k, 70.9% for AGIs $100k-200k, 53.2% for AGIs over 200k)
Taxable interest for individuals: $1,211 (reported on 47.1% of returns)
This zip code:
$1,211
New York:
$3,125
(% of AGI for various income ranges: 1.5% for AGIs below $25k, 0.8% for AGIs $25k-50k, 0.8% for AGIs $50k-75k, 0.7% for AGIs $75k-100k, 0.7% for AGIs $100k-200k, 1.2% for AGIs over 200k)
Ordinary dividends: $6,080 (reported on 29.7% of returns)
Here:
$6,080
State:
$10,299
(% of AGI for various income ranges: 2.6% for AGIs below $25k, 1.8% for AGIs $25k-50k, 1.6% for AGIs $50k-75k, 2.6% for AGIs $75k-100k, 1.9% for AGIs $100k-200k, 5.0% for AGIs over 200k)
Net capital gain/loss in AGI: +$7,963 (reported on 20.0% of returns)
Here:
+$7,963
State:
+$42,474
(% of AGI for various income ranges: 0.3% for AGIs $25k-50k, 0.3% for AGIs $50k-75k, 0.8% for AGIs $75k-100k, 0.9% for AGIs $100k-200k, 7.9% for AGIs over 200k)
Profit/loss from business: +$22,225 (reported on 11.7% of returns)
Here:
+$22,225
State:
+$16,168
(% of AGI for various income ranges: 4.1% for AGIs below $25k, 2.3% for AGIs $25k-50k, 1.5% for AGIs $50k-75k, 2.4% for AGIs $75k-100k, 3.7% for AGIs $100k-200k, 7.5% for AGIs over 200k)
Taxable individual retirement arrangement distribution: $14,723 (reported on 14.7% of returns)
14905:
$14,723
New York:
$17,621
(% of AGI for various income ranges: 3.5% for AGIs below $25k, 3.1% for AGIs $25k-50k, 3.3% for AGIs $50k-75k, 4.5% for AGIs $75k-100k, 3.6% for AGIs $100k-200k, 2.6% for AGIs over 200k)
Self-employment retirement plans: $21,271 (reported on 1.6% of returns)
14905:
$21,271
New York:
$27,330
Total itemized deductions: $21,691 (17% of AGI, reported on 34.5% of returns)
Here:
$21,691
State:
$34,985
Here:
17.5% of AGI
State:
21.3% of AGI
(% of AGI for various income ranges: 6.5% for AGIs below $25k, 8.3% for AGIs $25k-50k, 10.2% for AGIs $50k-75k, 10.8% for AGIs $75k-100k, 14.2% for AGIs $100k-200k, 13.1% for AGIs over 200k)
Charity contributions: $4,127 (reported on 29.2% of returns)
Here:
$4,127
State:
$5,572
(% of AGI for various income ranges: 0.7% for AGIs below $25k, 1.4% for AGIs $25k-50k, 1.4% for AGIs $50k-75k, 1.9% for AGIs $75k-100k, 2.1% for AGIs $100k-200k, 2.4% for AGIs over 200k)
Taxes paid: $11,929 (reported on 34.3% of returns)
14905:
$11,929
State:
$18,656
(% of AGI for various income ranges: 2.1% for AGIs below $25k, 3.0% for AGIs $25k-50k, 4.3% for AGIs $50k-75k, 4.9% for AGIs $75k-100k, 7.8% for AGIs $100k-200k, 9.4% for AGIs over 200k)
Earned income credit: $1,986 (reported on 14.9% of returns)
Here:
$1,986
State:
$2,230
(% of AGI for various income ranges: 5.5% for AGIs below $25k, 0.8% for AGIs $25k-50k)
Percentage of individuals using paid preparers for their 2012 taxes: 53.6%
Here:
54%
State:
66%
(% for various income ranges: 44.0% for AGIs below $25k, 53.3% for AGIs $25k-50k, 54.7% for AGIs $50k-75k, 63.0% for AGIs $75k-100k, 64.3% for AGIs $100k-200k, 77.8% for AGIs over 200k)
Averages for the 2004 tax year for zip code 14905, filed in 2005:
Average Adjusted Gross Income (AGI) in 2004: $51,811 (Individual Income Tax Returns)
Here:
$51,811
State:
$59,519
Salary/wage: $43,398 (reported on 78.7% of returns)
Here:
$43,398
State:
$50,673
(% of AGI for various income ranges: 105.3% for AGIs below $10k, 68.5% for AGIs $10k-25k, 72.7% for AGIs $25k-50k, 71.7% for AGIs $50k-75k, 73.7% for AGIs $75k-100k, 57.3% for AGIs over 100k)
Taxable interest for individuals: $2,039 (reported on 59.2% of returns)
This zip code:
$2,039
New York:
$2,377
(% of AGI for various income ranges: 6.7% for AGIs below $10k, 3.9% for AGIs $10k-25k, 1.9% for AGIs $25k-50k, 2.1% for AGIs $50k-75k, 1.9% for AGIs $75k-100k, 2.3% for AGIs over 100k)
Taxable dividends: $4,158 (reported on 36.5% of returns)
Here:
$4,158
State:
$5,394
(% of AGI for various income ranges: 6.4% for AGIs below $10k, 3.2% for AGIs $10k-25k, 2.1% for AGIs $25k-50k, 2.1% for AGIs $50k-75k, 2.0% for AGIs $75k-100k, 3.6% for AGIs over 100k)
Net capital gain/loss: +$3,559 (reported on 29.2% of returns)
Here:
+$3,559
State:
+$23,581
(% of AGI for various income ranges: -4.2% for AGIs below $10k, 0.4% for AGIs $10k-25k, 0.7% for AGIs $25k-50k, 1.1% for AGIs $50k-75k, 1.4% for AGIs $75k-100k, 3.4% for AGIs over 100k)
Profit/loss from business: +$15,725 (reported on 13.4% of returns)
Here:
+$15,725
State:
+$13,809
(% of AGI for various income ranges: 5.6% for AGIs below $10k, 2.1% for AGIs $10k-25k, 2.9% for AGIs $25k-50k, 2.0% for AGIs $50k-75k, 3.5% for AGIs $75k-100k, 5.7% for AGIs over 100k)
IRA payment deduction: $2,740 (reported on 2.8% of returns)
14905:
$2,740
New York:
$3,115
(% of AGI for various income ranges: 0.3% for AGIs $10k-25k, 0.4% for AGIs $25k-50k, 0.2% for AGIs $50k-75k, 0.1% for AGIs $75k-100k, 0.1% for AGIs over 100k)
Self-employed pension: $17,212 (reported on 1.8% of returns)
Here:
$17,212
New York:
$19,016
Total itemized deductions: $19,191 (19% of AGI, reported on 35.9% of returns)
Here:
$19,191
State:
$25,864
Here:
19.2% of AGI
State:
21.9% of AGI
(% of AGI for various income ranges: 14.4% for AGIs below $10k, 10.5% for AGIs $10k-25k, 10.6% for AGIs $25k-50k, 13.2% for AGIs $50k-75k, 13.5% for AGIs $75k-100k, 14.6% for AGIs over 100k)
Charity contributions deductions: $3,638 (4% of AGI, reported on 33.1% of returns)
Here:
$3,638
State:
$4,439
Here:
3.5% of AGI
State:
3.6% of AGI
(% of AGI for various income ranges: 0.6% for AGIs below $10k, 1.1% for AGIs $10k-25k, 1.4% for AGIs $25k-50k, 2.0% for AGIs $50k-75k, 2.3% for AGIs $75k-100k, 3.1% for AGIs over 100k)
Total tax: $9,164 (reported on 75.6% of returns)
14905:
$9,164
State:
$11,730
(% of AGI for various income ranges: 2.5% for AGIs below $10k, 3.9% for AGIs $10k-25k, 7.6% for AGIs $25k-50k, 9.1% for AGIs $50k-75k, 10.8% for AGIs $75k-100k, 19.7% for AGIs over 100k)
Earned income credit: $1,498 (reported on 12.3% of returns)
Here:
$1,498
State:
$1,757
Percentage of individuals using paid preparers for their 2004 taxes: 61.8%
Here:
62%
State:
67%
(% for various income ranges: 53.0% for AGIs below $10k, 61.1% for AGIs $10k-25k, 59.7% for AGIs $25k-50k, 65.7% for AGIs $50k-75k, 65.5% for AGIs $75k-100k, 76.2% for AGIs over 100k)
Likely homosexual households (counted as self-reported same-sex unmarried-partner households)
Lesbian couples: 0.0% of all households
Gay men: 0.3% of all households
Household received Food Stamps/SNAP in the past 12 months: 554 Household did not receive Food Stamps/SNAP in the past 12 months: 3,341
Women who had a birth in the past 12 months: 170 (52 now married, 121 unmarried) Women who did not have a birth in the past 12 months: 2,222 (834 now married, 1,385 unmarried)
Housing units in zip code 14905 with a mortgage: 1,541 (184 second mortgage, 175 both second mortgage and home equity loan) Houses without a mortgage: 96
Median monthly owner costs for units with a mortgage: $1,415 Median monthly owner costs for units without a mortgage: $653
Residents with income below the poverty level in 2022:
This zip code:
13.5%
Whole state:
14.3%
Residents with income below 50% of the poverty level in 2022:
This zip code:
7.3%
Whole state:
6.8%
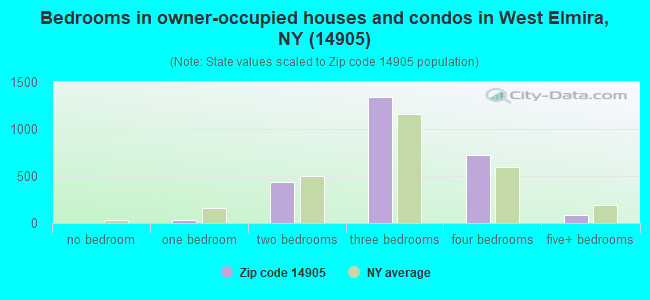
Median number of rooms in houses and condos:
Here:
7.3
State:
6.3
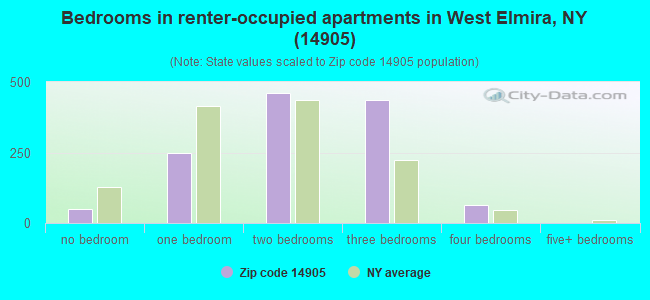
Median number of rooms in apartments:
Here:
5.0
State:
3.8
Notable locations in this zip code not listed on our city pages
Notable locations in zip code 14905: Elmira Country Club (A), Elmira Water Board Pumping Station and Filtration Plant (B), West Elmira Branch Steele Memorial Library (C), West Elmira Fire Volunteer Department (D), Town of Elmira Offices (E), The Barton Home Assisted Living Center (F), Elmira Town Hall (G), The Knoll (H), Oak Hill (I), Strathmont Museum (J), Elmira Water Board Winsor Avenue Pumping Station (K), Golden Glow Fire Department (L). Display/hide their locations on the map
Churches in zip code 14905 include: First Presbyterian Church of Elmira (A), Kingdom Hall of Jehovahs Witnesses (B), Saint Casimir's Church (C), First Church of Christ Scientist (D), First Free Methodist Church (E), Westside United Methodist Church (F), Congregation B'nai Israel Synagogue (G), Congregation Shomray Hadath Synagogue (H), Calvary Nazarene Church (I). Display/hide their locations on the map
In group quarters: 84 (-1 institutionalized population)
Size of family households: 1,212 2-persons, 529 3-persons, 498 4-persons, 181 5-persons, 49 6-persons, 13 7-or-more-persons
Size of nonfamily households: 1,136 1-person, 272 2-persons, 14 5-persons
906 married couples with children.
771 single-parent households (41 men, 730 women).
93.3% of residents of 14905 zip code speak English at home.
2.2% of residents speak Spanish at home (85% very well, 10% well, 5% not at all).
1.0% of residents speak other Indo-European language at home (100% very well).
2.2% of residents speak Asian or Pacific Island language at home (65% very well, 35% not well).
1.4% of residents speak other language at home (100% very well).
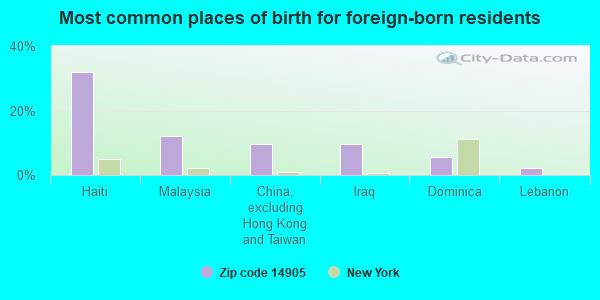
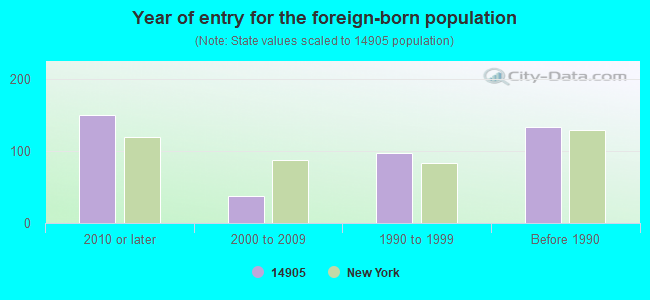
Foreign born population: 323 (3.7%) (73.0% of them are naturalized citizens)
Facilities with environmental interests located in this zip code:
ARNOT OGDEN MEM HOSPITAL & MEDICAL CENTE (600 ROE AVENUE in ELMIRA, NY)
AIR SYNTHETIC MINOR (AIRS/AFS) STATE MASTER (New York facility tracking) - AIR PROGRAM, REFUSE DISPOSAL, AIR PROGRAM, National Pollutant Discharge Elimination System Permit (Resource Conservation and Recovery Act (tracking hazardous waste)) - ICIS-, ENFORCEMENT/COMPLIANCE ACTIVITY Business SIC and NAICS classification: GENERAL MEDICAL AND SURGICAL HOSPITALS Organizations: ARNOT OGDEN MEMORIAL HOSPITAL (LEGALLY RESPONSIBLE PARTY)
Alternative names: ARNOT OGDEN MEDICAL CENTER, ARNOT OGDEN MEMORIAL HOSPITAL
HENDY AVE SCHOOL ( in ELMIRA, NY)
(Geographic Names Information System) (National Center for Education Statistics) - STATE ID-070600010010 Organizations: ELMIRA CITY SD (SCHOOL DISTRICT)
AMERICAN LAFRANCE FACILITY (1051 SOUTH MAIN STREET in ELMIRA, NY)
SUPERFUND (Superfund database) Alternative names: FIGGIE INTL, INC
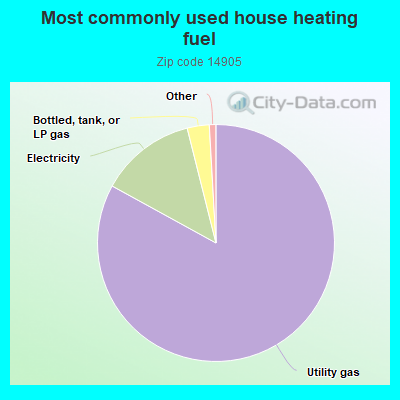
83.0%Utility gas
13.1%Electricity
3.0%Bottled, tank, or LP gas
Population in 1990: 10,018.
Place of birth for U.S.-born residents:
This state: 6,608
Northeast: 860
Midwest: 216
South: 296
West: 310
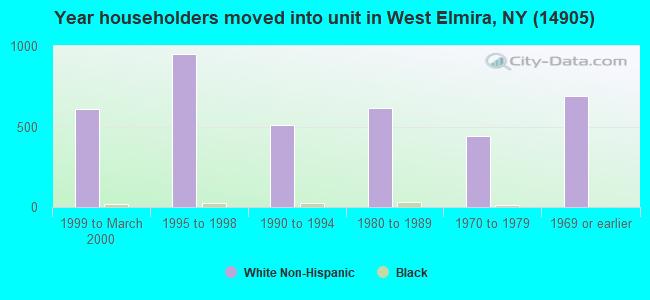
59% of the 14905 zip code residents lived in the same house 5 years ago. Out of people who lived in different houses, 67% lived in this county. Out of people who lived in different counties, 50% lived in New York.
90% of the 14905 zip code residents lived in the same house 1 year ago. Out of people who lived in different houses, 60% moved from this county. Out of people who lived in different houses, 23% moved from different county within same state. Out of people who lived in different houses, 11% moved from different state. Out of people who lived in different houses, 5% moved from abroad.
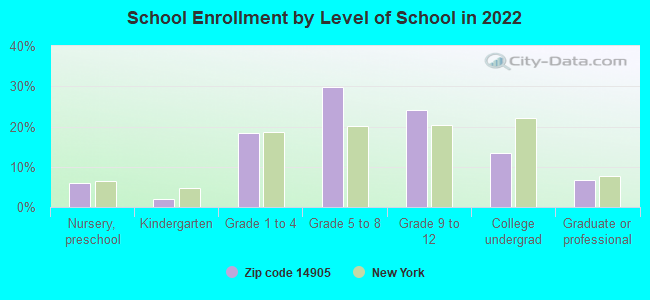
Private vs. public school enrollment:
Students in private schools in grades 1 to 8 (elementary and middle school): 149
Here:
17.7%
New York:
15.6%
Students in private schools in grades 9 to 12 (high school): 56
Here:
13.4%
New York:
15.0%
Students in private undergraduate colleges: 48
Here:
20.9%
New York:
39.2%
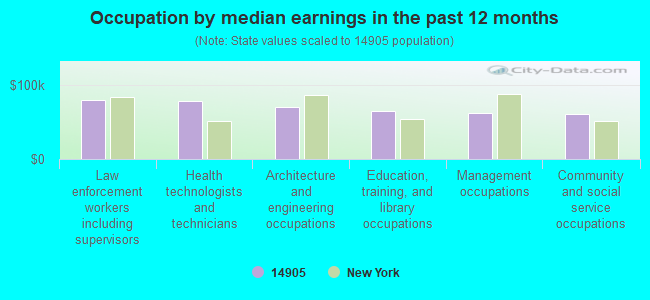
Occupation by median earnings in the past 12 months ($)
79,156Law enforcement workers including supervisors
78,502Health technologists and technicians
69,680Architecture and engineering occupations
64,563Education, training, and library occupations
61,798Management occupations
61,256Community and social service occupations
Companies with federal contracts located in this zip code:
BASAL W C CO (914 W 1ST ST in ELMIRA, NY; small business)
$3,100 with Army for Miscellaneous Printed Matter. Signed on 2003-09-04. Completion date: 2003-09-24.
Top industries in this zip code by the number of employees in 2005:
Health Care and Social Assistance: General Medical and Surgical Hospitals (over 1000 employees: 1 establishment)
Health Care and Social Assistance: Offices of Physicians (except Mental Health Specialists) (50-99: 1, 20-49: 1, 10-19: 5, 5-9: 4, 1-4: 6)
Other Services (except Public Administration): Religious Organizations (50-99: 1, 10-19: 2, 5-9: 1, 1-4: 3)
Health Care and Social Assistance: Offices of Dentists (10-19: 2, 5-9: 2, 1-4: 4)
Health Care and Social Assistance: Residential Mental Retardation Facilities (20-49: 1, 1-4: 2)
Other Services (except Public Administration): Car Washes (20-49: 1, 1-4: 1)
Arts, Entertainment, and Recreation: Golf Courses and Country Clubs (20-49: 1)
Accommodation and Food Services: Full-Service Restaurants (20-49: 1)
Health Care and Social Assistance: Other Residential Care Facilities (10-19: 2)
People in group quarters in 2010:
39 people in nursing facilities/skilled-nursing facilities
21 people in group homes intended for adults
14 people in other noninstitutional facilities
8 people in group homes for juveniles (non-correctional)
People in group quarters in 2000:
62 people in nursing homes
29 people in other noninstitutional group quarters
20 people in homes for abused, dependent, and neglected children
19 people in religious group quarters
6 people in homes for the mentally retarded
2 people in other group homes
Fatal accident statistics in 2011:
Fatal accident count: 1
Vehicles involved in fatal accidents: 1
Fatal accidents caused by drunken drivers: 0
Fatalities: 1
Persons involved in fatal accidents: 1
Pedestrians involved in fatal accidents: 1
Fatal accident statistics in 2010:
Fatal accident count: 3
Vehicles involved in fatal accidents: 3
Fatal accidents caused by drunken drivers: 1
Fatalities: 3
Persons involved in fatal accidents: 3
Pedestrians involved in fatal accidents: 3
Home Mortgage Disclosure Act Aggregated Statistics For Year 2009 (Based on 8 partial tracts)
A) FHA, FSA/RHS & VA Home Purchase Loans
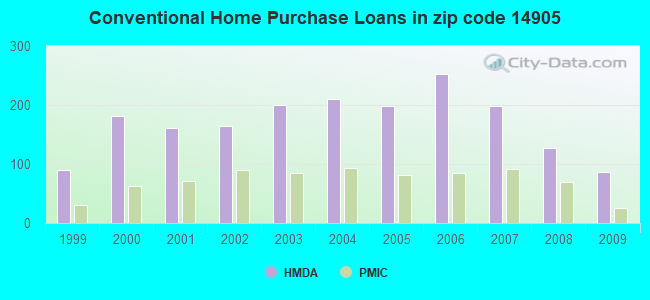
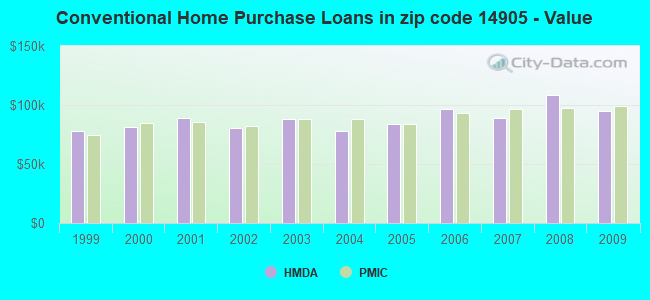
B) Conventional Home Purchase Loans
C) Refinancings
D) Home Improvement Loans
E) Loans on Dwellings For 5+ Families
F) Non-occupant Loans on < 5 Family Dwellings (A B C & D)
Number
Average Value
Number
Average Value
Number
Average Value
Number
Average Value
Number
Average Value
Number
Average Value
LOANS ORIGINATED
76
$107,027
86
$94,781
218
$100,234
88
$35,698
5
$497,370
21
$59,330
APPLICATIONS APPROVED, NOT ACCEPTED
3
$128,997
5
$67,676
8
$74,448
5
$15,766
0
$0
3
$35,520
APPLICATIONS DENIED
8
$72,808
9
$131,401
67
$96,543
26
$20,305
1
$631,860
10
$76,776
APPLICATIONS WITHDRAWN
2
$98,205
12
$70,358
64
$112,782
7
$47,981
0
$0
8
$103,232
FILES CLOSED FOR INCOMPLETENESS
0
$0
1
$95,790
10
$120,267
1
$14,050
0
$0
0
$0
Aggregated Statistics For Year 2008 (Based on 8 partial tracts)
A) FHA, FSA/RHS & VA Home Purchase Loans
B) Conventional Home Purchase Loans
C) Refinancings
D) Home Improvement Loans
E) Loans on Dwellings For 5+ Families
F) Non-occupant Loans on < 5 Family Dwellings (A B C & D)
G) Loans On Manufactured Home Dwelling (A B C & D)
Number
Average Value
Number
Average Value
Number
Average Value
Number
Average Value
Number
Average Value
Number
Average Value
Number
Average Value
LOANS ORIGINATED
39
$92,810
127
$108,226
82
$86,324
101
$27,541
1
$362,500
28
$58,423
0
$0
APPLICATIONS APPROVED, NOT ACCEPTED
3
$79,860
9
$119,019
19
$100,779
12
$15,316
0
$0
3
$65,910
0
$0
APPLICATIONS DENIED
6
$85,248
28
$86,965
85
$80,884
62
$18,869
0
$0
11
$48,801
3
$54,727
APPLICATIONS WITHDRAWN
7
$96,676
4
$100,820
40
$100,975
4
$10,292
0
$0
2
$48,425
0
$0
FILES CLOSED FOR INCOMPLETENESS
0
$0
0
$0
11
$94,075
1
$46,080
0
$0
0
$0
0
$0
Aggregated Statistics For Year 2007 (Based on 8 partial tracts)
A) FHA, FSA/RHS & VA Home Purchase Loans
B) Conventional Home Purchase Loans
C) Refinancings
D) Home Improvement Loans
F) Non-occupant Loans on < 5 Family Dwellings (A B C & D)
Number
Average Value
Number
Average Value
Number
Average Value
Number
Average Value
Number
Average Value
LOANS ORIGINATED
15
$90,555
199
$89,206
159
$82,510
116
$31,910
63
$64,788
APPLICATIONS APPROVED, NOT ACCEPTED
0
$0
15
$93,871
19
$69,709
6
$36,225
4
$81,962
APPLICATIONS DENIED
4
$83,698
33
$71,176
125
$87,606
65
$29,014
21
$38,761
APPLICATIONS WITHDRAWN
3
$89,017
24
$71,887
74
$89,082
9
$78,328
10
$44,968
FILES CLOSED FOR INCOMPLETENESS
1
$43,780
11
$76,635
14
$103,446
0
$0
3
$47,857
Aggregated Statistics For Year 2006 (Based on 8 partial tracts)
A) FHA, FSA/RHS & VA Home Purchase Loans
B) Conventional Home Purchase Loans
C) Refinancings
D) Home Improvement Loans
E) Loans on Dwellings For 5+ Families
F) Non-occupant Loans on < 5 Family Dwellings (A B C & D)
G) Loans On Manufactured Home Dwelling (A B C & D)
Number
Average Value
Number
Average Value
Number
Average Value
Number
Average Value
Number
Average Value
Number
Average Value
Number
Average Value
LOANS ORIGINATED
18
$76,578
253
$96,767
163
$69,692
105
$23,191
0
$0
55
$57,407
4
$41,008
APPLICATIONS APPROVED, NOT ACCEPTED
1
$118,920
19
$92,332
26
$80,840
10
$38,761
0
$0
6
$43,907
1
$74,880
APPLICATIONS DENIED
0
$0
40
$62,308
122
$82,485
46
$15,760
0
$0
35
$63,472
0
$0
APPLICATIONS WITHDRAWN
0
$0
20
$86,614
95
$77,615
8
$44,159
2
$43,795
10
$62,717
3
$57,437
FILES CLOSED FOR INCOMPLETENESS
0
$0
0
$0
14
$114,484
1
$12,770
0
$0
0
$0
0
$0
Aggregated Statistics For Year 2005 (Based on 8 partial tracts)
A) FHA, FSA/RHS & VA Home Purchase Loans
B) Conventional Home Purchase Loans
C) Refinancings
D) Home Improvement Loans
E) Loans on Dwellings For 5+ Families
F) Non-occupant Loans on < 5 Family Dwellings (A B C & D)
G) Loans On Manufactured Home Dwelling (A B C & D)
Number
Average Value
Number
Average Value
Number
Average Value
Number
Average Value
Number
Average Value
Number
Average Value
Number
Average Value
LOANS ORIGINATED
16
$105,508
199
$83,881
170
$79,135
113
$25,747
2
$36,705
31
$57,004
0
$0
APPLICATIONS APPROVED, NOT ACCEPTED
1
$73,070
14
$73,361
45
$73,126
7
$31,256
0
$0
2
$68,510
1
$26,820
APPLICATIONS DENIED
2
$39,890
24
$69,570
138
$89,669
55
$29,662
0
$0
20
$52,468
0
$0
APPLICATIONS WITHDRAWN
0
$0
15
$83,892
117
$92,780
19
$78,418
0
$0
11
$61,540
0
$0
FILES CLOSED FOR INCOMPLETENESS
0
$0
8
$141,052
31
$87,296
0
$0
0
$0
4
$69,048
0
$0
Aggregated Statistics For Year 2004 (Based on 8 partial tracts)
A) FHA, FSA/RHS & VA Home Purchase Loans
B) Conventional Home Purchase Loans
C) Refinancings
D) Home Improvement Loans
E) Loans on Dwellings For 5+ Families
F) Non-occupant Loans on < 5 Family Dwellings (A B C & D)
G) Loans On Manufactured Home Dwelling (A B C & D)
Number
Average Value
Number
Average Value
Number
Average Value
Number
Average Value
Number
Average Value
Number
Average Value
Number
Average Value
LOANS ORIGINATED
22
$81,588
210
$77,550
216
$78,133
113
$27,847
3
$198,933
42
$55,200
0
$0
APPLICATIONS APPROVED, NOT ACCEPTED
2
$64,020
16
$75,147
32
$84,346
13
$17,012
0
$0
4
$55,625
1
$109,840
APPLICATIONS DENIED
4
$69,232
31
$69,004
136
$73,935
55
$24,493
1
$69,120
9
$42,727
1
$157,610
APPLICATIONS WITHDRAWN
5
$104,742
22
$98,718
78
$77,711
12
$26,507
0
$0
3
$59,097
0
$0
FILES CLOSED FOR INCOMPLETENESS
0
$0
6
$61,760
23
$105,554
5
$37,662
0
$0
4
$136,908
0
$0
Aggregated Statistics For Year 2003 (Based on 8 partial tracts)
A) FHA, FSA/RHS & VA Home Purchase Loans
B) Conventional Home Purchase Loans
C) Refinancings
D) Home Improvement Loans
E) Loans on Dwellings For 5+ Families
F) Non-occupant Loans on < 5 Family Dwellings (A B C & D)
Number
Average Value
Number
Average Value
Number
Average Value
Number
Average Value
Number
Average Value
Number
Average Value
LOANS ORIGINATED
24
$83,630
200
$88,054
459
$82,357
65
$17,520
5
$279,912
46
$51,755
APPLICATIONS APPROVED, NOT ACCEPTED
1
$111,120
9
$60,061
42
$79,974
3
$12,233
0
$0
9
$52,634
APPLICATIONS DENIED
8
$73,002
20
$48,722
136
$80,253
25
$12,834
0
$0
6
$48,660
APPLICATIONS WITHDRAWN
3
$54,177
15
$61,763
107
$83,982
9
$20,838
0
$0
8
$56,171
FILES CLOSED FOR INCOMPLETENESS
1
$84,300
3
$45,573
11
$86,745
4
$45,562
0
$0
3
$36,473
Aggregated Statistics For Year 2002 (Based on 8 partial tracts)
A) FHA, FSA/RHS & VA Home Purchase Loans
B) Conventional Home Purchase Loans
C) Refinancings
D) Home Improvement Loans
E) Loans on Dwellings For 5+ Families
F) Non-occupant Loans on < 5 Family Dwellings (A B C & D)
Number
Average Value
Number
Average Value
Number
Average Value
Number
Average Value
Number
Average Value
Number
Average Value
LOANS ORIGINATED
29
$70,107
165
$80,399
270
$87,213
75
$14,951
3
$270,117
33
$63,049
APPLICATIONS APPROVED, NOT ACCEPTED
0
$0
12
$90,178
37
$64,099
6
$14,323
0
$0
5
$47,472
APPLICATIONS DENIED
5
$73,640
19
$52,006
105
$60,017
17
$15,588
0
$0
15
$49,050
APPLICATIONS WITHDRAWN
0
$0
13
$63,712
82
$76,030
10
$36,498
0
$0
10
$56,628
FILES CLOSED FOR INCOMPLETENESS
0
$0
3
$67,853
15
$83,593
0
$0
0
$0
0
$0
Aggregated Statistics For Year 2001 (Based on 8 partial tracts)
A) FHA, FSA/RHS & VA Home Purchase Loans
B) Conventional Home Purchase Loans
C) Refinancings
D) Home Improvement Loans
E) Loans on Dwellings For 5+ Families
F) Non-occupant Loans on < 5 Family Dwellings (A B C & D)
Number
Average Value
Number
Average Value
Number
Average Value
Number
Average Value
Number
Average Value
Number
Average Value
LOANS ORIGINATED
54
$66,988
161
$88,776
232
$77,144
62
$16,898
4
$142,970
28
$47,551
APPLICATIONS APPROVED, NOT ACCEPTED
1
$90,270
20
$74,996
16
$57,353
6
$17,435
1
$110,330
9
$78,748
APPLICATIONS DENIED
5
$55,230
17
$57,750
101
$60,205
33
$14,371
0
$0
7
$23,019
APPLICATIONS WITHDRAWN
6
$54,395
9
$48,359
62
$63,679
8
$22,184
0
$0
4
$36,692
FILES CLOSED FOR INCOMPLETENESS
0
$0
0
$0
13
$68,640
5
$17,656
0
$0
0
$0
Aggregated Statistics For Year 2000 (Based on 8 partial tracts)
A) FHA, FSA/RHS & VA Home Purchase Loans
B) Conventional Home Purchase Loans
C) Refinancings
D) Home Improvement Loans
E) Loans on Dwellings For 5+ Families
F) Non-occupant Loans on < 5 Family Dwellings (A B C & D)
Number
Average Value
Number
Average Value
Number
Average Value
Number
Average Value
Number
Average Value
Number
Average Value
LOANS ORIGINATED
54
$67,777
181
$81,635
75
$57,029
85
$17,877
2
$25,195
20
$39,332
APPLICATIONS APPROVED, NOT ACCEPTED
3
$56,370
16
$75,495
19
$49,244
11
$25,498
0
$0
3
$20,467
APPLICATIONS DENIED
3
$51,283
30
$55,733
77
$50,167
29
$17,945
0
$0
6
$48,963
APPLICATIONS WITHDRAWN
6
$59,360
10
$109,053
61
$43,920
6
$14,420
0
$0
3
$34,697
FILES CLOSED FOR INCOMPLETENESS
1
$88,830
1
$108,560
7
$53,169
1
$48,530
0
$0
0
$0
Aggregated Statistics For Year 1999 (Based on 4 partial tracts)
A) FHA, FSA/RHS & VA Home Purchase Loans
B) Conventional Home Purchase Loans
C) Refinancings
D) Home Improvement Loans
F) Non-occupant Loans on < 5 Family Dwellings (A B C & D)
2002 - 2018 National Fire Incident Reporting System (NFIRS) incidents
According to the data from the years 2002 - 2018 the average number of fires per year is 29. The highest number of reported fire incidents - 45 took place in 2006, and the least - 8 in 2002. The data has an increasing trend.
When looking into fire subcategories, the most reports belonged to: Structure Fires (61.6%), and Outside Fires (21.9%).
Fire incident types reported to NFIRS in Zip Code 14905


 Nearest zip codes: 14904, 14903, 14871, 14894, 14901, 14845.
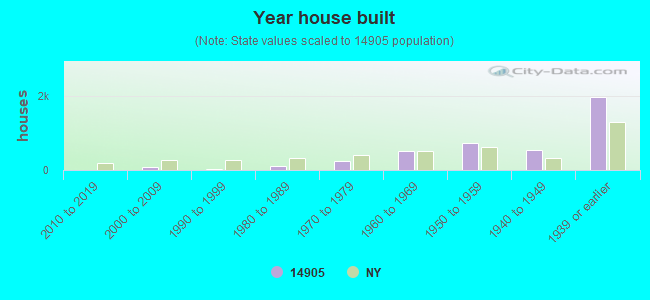


 According to the data from the years 2002 - 2018 the average number of fires per year is 29. The highest number of reported fire incidents - 45 took place in 2006, and the least - 8 in 2002. The data has an increasing trend.
 When looking into fire subcategories, the most reports belonged to: Structure Fires (61.6%), and Outside Fires (21.9%).