Estimated zip code population in 2022: 2,281 Zip code population in 2010: 2,281 Zip code population in 2000: 2,272
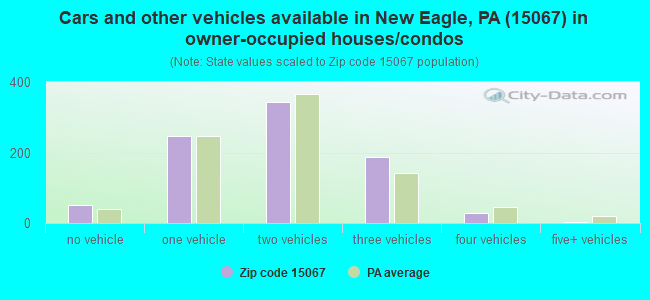
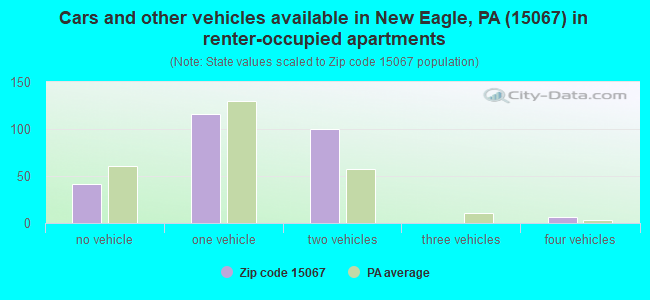
Houses and condos: 1,215 Renter-occupied apartments: 262
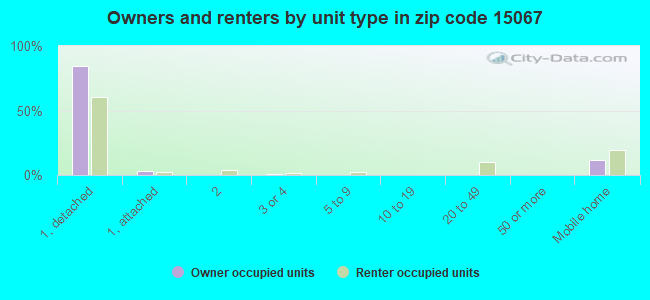
% of renters here:
23%
State:
31%
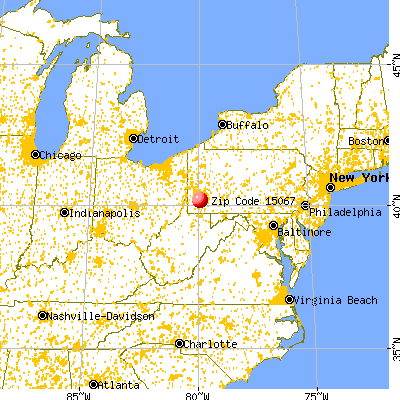
March 2022 cost of living index in zip code 15067: 88.7 (less than average, U.S. average is 100)
Land area: 2.0 sq. mi. Water area: 0.2 sq. mi.
Population density: 1,119 people per square mile
(low).
OSM Map
General Map
Google Map
MSN Map
OSM Map
General Map
Google Map
MSN Map
OSM Map
General Map
Google Map
MSN Map
OSM Map
General Map
Google Map
MSN Map
Please wait while loading the map...
Real estate property taxes paid for housing units in 2022:
This zip code:
1.5% ($1,769)
Pennsylvania:
1.3% ($3,094)
Median real estate property taxes paid for housing units with mortgages in 2022: $2,299 (1.5%) Median real estate property taxes paid for housing units with no mortgage in 2022: $1,463 (1.4%)
Business Search- 14 Million verified businesses
Males: 1,199
(52.6%)
Females: 1,081
(47.4%)
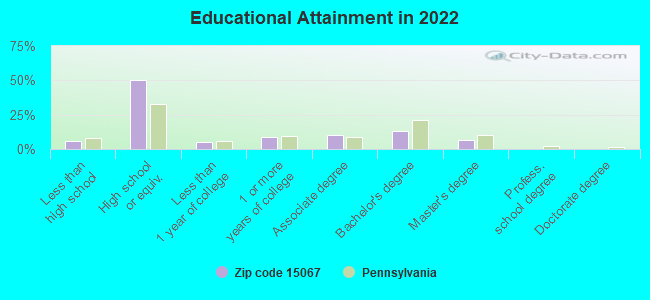
For population 25 years and over in 15067:
High school or higher: 93.5%
Bachelor's degree or higher: 19.6%
Graduate or professional degree: 6.7%
Unemployed: 11.0%
Mean travel time to work (commute): 32.1 minutes
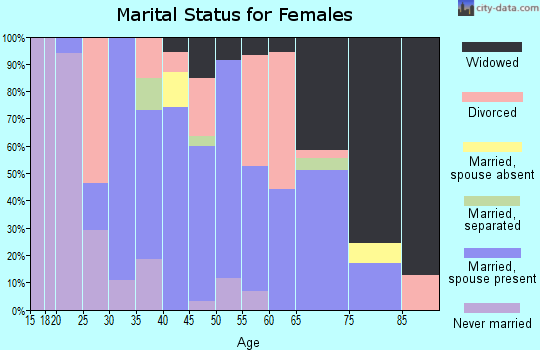
For population 15 years and over in 15067:
Never married: 28.9%
Now married: 48.9%
Separated: 2.6%
Widowed: 7.2%
Divorced: 12.3%
Zip code 15067 compared to state average:
Median house value below state average.
Unemployed percentage above state average.
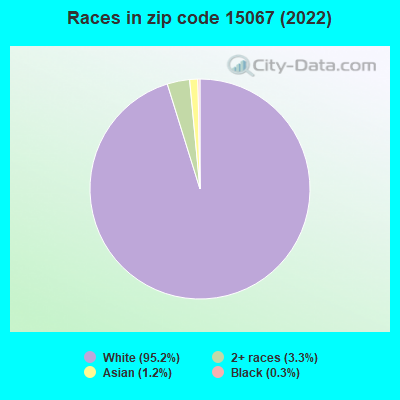
Black race population percentage significantly below state average.
Hispanic race population percentage significantly below state average.
Median age significantly above state average.
Foreign-born population percentage significantly below state average.
Length of stay since moving in above state average.
Percentage of population with a bachelor's degree or higher below state average.
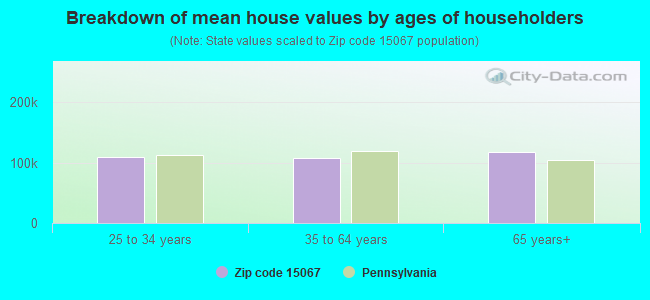
Estimated median house/condo value in 2022: $114,827
15067:
$114,827
Pennsylvania:
$245,500
According to our research of Pennsylvania and other state lists, there were 2 registered sex offenders living in 15067 zip code as of April 25, 2024. The ratio of all residents to sex offenders in zip code 15067 is 1,114 to 1. The ratio of registered sex offenders to all residents in this zip code is lower than the state average.
Median resident age:
This zip code:
49.4 years
Pennsylvania median age:
40.9 years
Average household size:
This zip code:
2.0 people
Pennsylvania:
2.4 people
Averages for the 2020 tax year for zip code 15067, filed in 2021:
Average Adjusted Gross Income (AGI) in 2020: $46,241 (Individual Income Tax Returns)
Here:
$46,241
State:
$75,707
Salary/wage: $42,454 (reported on 76.6% of returns)
Here:
$42,454
State:
$62,806
(% of AGI for various income ranges: 842.2% for AGIs below $25k, 3324.4% for AGIs $25k-50k, 5409.2% for AGIs $50k-75k, 7978.9% for AGIs $75k-100k, 15948.6% for AGIs $100k-200k)
Taxable interest for individuals: $464 (reported on 25.2% of returns)
This zip code:
$464
Pennsylvania:
$1,633
(% of AGI for various income ranges: 17.0% for AGIs below $25k, 13.0% for AGIs $25k-50k, 11.7% for AGIs $50k-75k, 7.8% for AGIs $75k-100k, 40.0% for AGIs $100k-200k)
Ordinary dividends: $1,813 (reported on 13.5% of returns)
Here:
$1,813
State:
$7,382
(% of AGI for various income ranges: 17.4% for AGIs below $25k, 4.8% for AGIs $25k-50k, 30.8% for AGIs $50k-75k, 28.9% for AGIs $75k-100k, 212.9% for AGIs $100k-200k)
Net capital gain/loss in AGI: +$3,917 (reported on 10.8% of returns)
Here:
+$3,917
State:
+$23,522
(% of AGI for various income ranges: 10.4% for AGIs below $25k, 14.1% for AGIs $25k-50k, 85.0% for AGIs $50k-75k, 431.4% for AGIs $100k-200k)
Profit/loss from business: +$7,230 (reported on 9.0% of returns)
Here:
+$7,230
State:
+$16,274
(% of AGI for various income ranges: 80.7% for AGIs below $25k, 114.4% for AGIs $25k-50k, 217.8% for AGIs $75k-100k)
Taxable individual retirement arrangement distribution: $10,264 (reported on 9.9% of returns)
15067:
$10,264
Pennsylvania:
$18,583
(% of AGI for various income ranges: 82.2% for AGIs below $25k, 194.1% for AGIs $25k-50k, 425.6% for AGIs $75k-100k)
Earned income credit: $2,025 (reported on 14.4% of returns)
Here:
$2,025
State:
$2,100
(% of AGI for various income ranges: 61.1% for AGIs below $25k, 58.9% for AGIs $25k-50k)
Percentage of individuals using paid preparers for their 2020 taxes: 87.4%
Here:
87%
State:
92%
(% for various income ranges: 87.2% for AGIs below $25k, 88.6% for AGIs $25k-50k, 93.3% for AGIs $50k-75k, 81.8% for AGIs $75k-100k, 81.8% for AGIs $100k-200k)
Averages for the 2012 tax year for zip code 15067, filed in 2013:
Average Adjusted Gross Income (AGI) in 2012: $38,207 (Individual Income Tax Returns)
Here:
$38,207
State:
$61,346
Salary/wage: $37,033 (reported on 81.1% of returns)
Here:
$37,033
State:
$51,902
(% of AGI for various income ranges: 66.5% for AGIs below $25k, 77.7% for AGIs $25k-50k, 81.3% for AGIs $50k-75k, 83.3% for AGIs $75k-100k, 80.7% for AGIs $100k-200k)
Taxable interest for individuals: $432 (reported on 30.6% of returns)
This zip code:
$432
Pennsylvania:
$1,588
(% of AGI for various income ranges: 1.2% for AGIs below $25k, 0.4% for AGIs $25k-50k, 0.2% for AGIs $50k-75k, 0.1% for AGIs $100k-200k)
Ordinary dividends: $912 (reported on 15.3% of returns)
Here:
$912
State:
$5,827
(% of AGI for various income ranges: 1.3% for AGIs below $25k, 0.2% for AGIs $25k-50k, 0.3% for AGIs $50k-75k, 0.2% for AGIs $100k-200k)
Profit/loss from business: +$6,900 (reported on 9.9% of returns)
Here:
+$6,900
State:
+$16,268
(% of AGI for various income ranges: 5.5% for AGIs below $25k, 2.2% for AGIs $25k-50k, 2.9% for AGIs $75k-100k)
Taxable individual retirement arrangement distribution: $9,830 (reported on 9.0% of returns)
15067:
$9,830
Pennsylvania:
$14,550
(% of AGI for various income ranges: 3.8% for AGIs below $25k, 3.0% for AGIs $25k-50k, 4.7% for AGIs $50k-75k)
Total itemized deductions: $14,956 (20% of AGI, reported on 14.4% of returns)
Here:
$14,956
State:
$23,538
Here:
20.2% of AGI
State:
18.4% of AGI
(% of AGI for various income ranges: 4.2% for AGIs $25k-50k, 4.4% for AGIs $50k-75k, 8.6% for AGIs $75k-100k, 9.8% for AGIs $100k-200k)
Charity contributions: $2,418 (reported on 9.9% of returns)
Here:
$2,418
State:
$4,025
(% of AGI for various income ranges: 0.8% for AGIs $25k-50k, 0.4% for AGIs $75k-100k, 1.6% for AGIs $100k-200k)
Taxes paid: $5,327 (reported on 13.5% of returns)
15067:
$5,327
State:
$9,982
(% of AGI for various income ranges: 0.9% for AGIs $25k-50k, 1.5% for AGIs $50k-75k, 2.8% for AGIs $75k-100k, 4.0% for AGIs $100k-200k)
Earned income credit: $2,071 (reported on 18.9% of returns)
Here:
$2,071
State:
$2,106
(% of AGI for various income ranges: 5.4% for AGIs below $25k, 1.2% for AGIs $25k-50k)
Percentage of individuals using paid preparers for their 2012 taxes: 48.6%
Here:
49%
State:
53%
(% for various income ranges: 43.8% for AGIs below $25k, 50.0% for AGIs $25k-50k, 60.0% for AGIs $50k-75k, 50.0% for AGIs $75k-100k, 50.0% for AGIs $100k-200k)
Averages for the 2004 tax year for zip code 15067, filed in 2005:
Average Adjusted Gross Income (AGI) in 2004: $31,242 (Individual Income Tax Returns)
Here:
$31,242
State:
$48,049
Salary/wage: $30,959 (reported on 81.6% of returns)
Here:
$30,959
State:
$42,646
(% of AGI for various income ranges: 70.9% for AGIs below $10k, 68.5% for AGIs $10k-25k, 85.0% for AGIs $25k-50k, 86.2% for AGIs $50k-75k, 84.5% for AGIs $75k-100k, 73.5% for AGIs over 100k)
Taxable interest for individuals: $853 (reported on 44.2% of returns)
This zip code:
$853
Pennsylvania:
$1,657
(% of AGI for various income ranges: 5.9% for AGIs below $10k, 2.5% for AGIs $10k-25k, 1.1% for AGIs $25k-50k, 0.6% for AGIs $50k-75k, 0.4% for AGIs $75k-100k, 0.7% for AGIs over 100k)
Taxable dividends: $630 (reported on 17.5% of returns)
Here:
$630
State:
$3,566
(% of AGI for various income ranges: 1.6% for AGIs below $10k, 0.4% for AGIs $10k-25k, 0.3% for AGIs $25k-50k, 0.2% for AGIs $50k-75k, 0.2% for AGIs $75k-100k, 0.5% for AGIs over 100k)
Net capital gain/loss: +$866 (reported on 9.8% of returns)
Here:
+$866
State:
+$9,716
(% of AGI for various income ranges: 1.1% for AGIs below $10k, 0.3% for AGIs $10k-25k, 0.4% for AGIs $25k-50k, -0.0% for AGIs $50k-75k, 0.5% for AGIs $75k-100k)
Profit/loss from business: +$2,637 (reported on 9.9% of returns)
Here:
+$2,637
State:
+$14,267
(% of AGI for various income ranges: -7.7% for AGIs below $10k, 3.3% for AGIs $10k-25k, 1.1% for AGIs $25k-50k, 0.8% for AGIs $50k-75k, 0.3% for AGIs $75k-100k)
IRA payment deduction: $2,318 (reported on 1.9% of returns)
15067:
$2,318
Pennsylvania:
$2,903
Total itemized deductions: $13,576 (20% of AGI, reported on 13.8% of returns)
Here:
$13,576
State:
$18,804
Here:
19.7% of AGI
State:
19.5% of AGI
(% of AGI for various income ranges: 3.1% for AGIs $10k-25k, 3.5% for AGIs $25k-50k, 6.3% for AGIs $50k-75k, 9.9% for AGIs $75k-100k, 12.2% for AGIs over 100k)
Charity contributions deductions: $1,761 (2% of AGI, reported on 12.1% of returns)
Here:
$1,761
State:
$3,337
Here:
2.4% of AGI
State:
3.3% of AGI
(% of AGI for various income ranges: 0.5% for AGIs $10k-25k, 0.4% for AGIs $25k-50k, 0.6% for AGIs $50k-75k, 1.5% for AGIs $75k-100k, 1.2% for AGIs over 100k)
Total tax: $3,741 (reported on 71.6% of returns)
15067:
$3,741
State:
$8,008
(% of AGI for various income ranges: 2.3% for AGIs below $10k, 4.0% for AGIs $10k-25k, 7.0% for AGIs $25k-50k, 8.9% for AGIs $50k-75k, 11.2% for AGIs $75k-100k, 16.4% for AGIs over 100k)
Earned income credit: $1,455 (reported on 16.7% of returns)
Here:
$1,455
State:
$1,643
Percentage of individuals using paid preparers for their 2004 taxes: 51.6%
Here:
52%
State:
56%
(% for various income ranges: 46.4% for AGIs below $10k, 50.9% for AGIs $10k-25k, 52.2% for AGIs $25k-50k, 53.5% for AGIs $50k-75k, 56.5% for AGIs $75k-100k, 78.8% for AGIs over 100k)
Household received Food Stamps/SNAP in the past 12 months: 216 Household did not receive Food Stamps/SNAP in the past 12 months: 910
Women who had a birth in the past 12 months: 27 (21 now married, 6 unmarried) Women who did not have a birth in the past 12 months: 340 (148 now married, 191 unmarried)
Housing units in zip code 15067 with a mortgage: 346 (24 second mortgage, 24 both second mortgage and home equity loan) Houses without a mortgage: 45
Median monthly owner costs for units with a mortgage: $1,143 Median monthly owner costs for units without a mortgage: $488
Residents with income below the poverty level in 2022:
This zip code:
13.2%
Whole state:
11.8%
Residents with income below 50% of the poverty level in 2022:
This zip code:
5.4%
Whole state:
6.1%
Median number of rooms in houses and condos:
Here:
6.0
State:
6.8
Median number of rooms in apartments:
Here:
5.0
State:
4.3
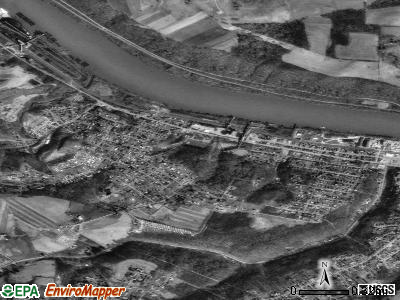
Notable locations in this zip code not listed on our city pages
Notable locations in zip code 15067: New Eagle Borough Hall (A), New Eagle Volunteer Fire Company Station 14 (B), Valley Inn Volunteer Fire Department Station 46 (C). Display/hide their locations on the map
Churches in zip code 15067 include: Riverview Baptist Church of New Eagle (A), New Beginnings Church of God of Prophecy (B). Display/hide their locations on the map
In group quarters: 4 (-1 institutionalized population)
Size of family households: 431 2-persons, 116 3-persons, 96 4-persons, 23 5-persons, 13 6-persons
Size of nonfamily households: 411 1-person, 33 2-persons
55 married couples with children.
224 single-parent households (100 men, 124 women).
99.1% of residents of 15067 zip code speak English at home.
0.2% of residents speak other Indo-European language at home (100% well).
0.4% of residents speak Asian or Pacific Island language at home (100% well).
0.1% of residents speak other language at home (100% very well).
Foreign born population: 13 (0.6%) (62.5% of them are naturalized citizens)
This zip code:
0.6%
Whole state:
7.5%
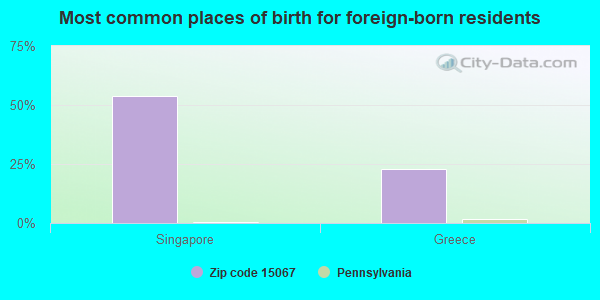
54%Singapore
23%Greece
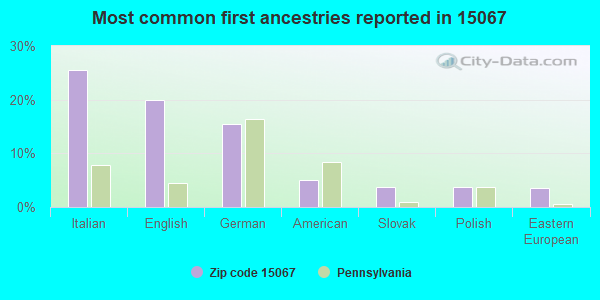
25%Italian
20%English
15%German
5%American
4%Slovak
4%Polish
3%Eastern European
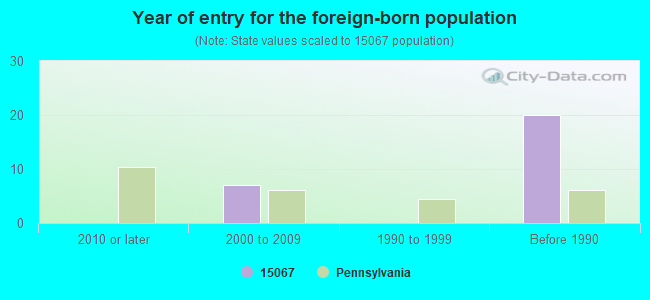
Year of entry for the foreign-born population
02010 or later
72000 to 2009
01990 to 1999
20Before 1990
Facilities with environmental interests located in this zip code:
ALLIED BLOCK INDUSTRIES INCORPORATED (PINE STREET in NEW EAGLE, PA)
(Integrated Compliance Information System) - ICIS-03-1986-0785, FORMAL ENFORCEMENT ACTION, ICIS-03-1986-0485, COMPLIANCE ACTIVITY (Tracking inspections of insecticide, fungicide, and rodenticide, and toxic substances) Small Quantity Generators, between 100 kg and 1000 kg of hazardous waste/month (Resource Conservation and Recovery Act (tracking hazardous waste)) - notification TRI REPORTER (Tracking of toxic chemicals releasing facilities) Business SIC classification: SPECIALTY CLEANING, POLISHING, AND SANITATION PREPARATIONS; MINERALS AND EARTHS, GROUND OR OTHERWISE TREATED Business NAICS classification: ALL OTHER MISCELLANEOUS CHEMICAL PRODUCT AND PREPARATION MANUFACTURING. Organizations: OPERNAME (CONTACT/OPERATOR)
, ALLIED BLOCK CHEMICAL (CONTACT/OWNER)
Housing units lacking complete plumbing facilities: 3.4% Housing units lacking complete kitchen facilities: 3.7%
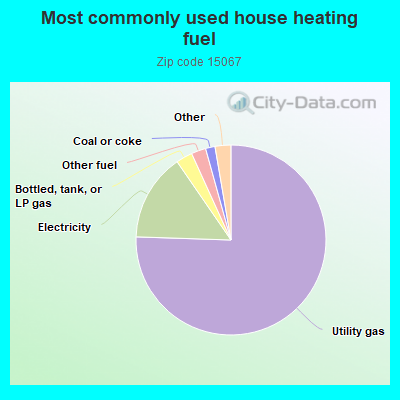
75.6%Utility gas
14.9%Electricity
2.8%Bottled, tank, or LP gas
2.5%Other fuel
1.6%Coal or coke
1.0%Fuel oil, kerosene, etc.
1.0%Wood
0.7%No fuel used
Population in 1990: 2,222. Population change in the 1990s: +50 (+2.3%).
Place of birth for U.S.-born residents:
This state: 2,046
Northeast: 59
Midwest: 51
South: 46
West: 29
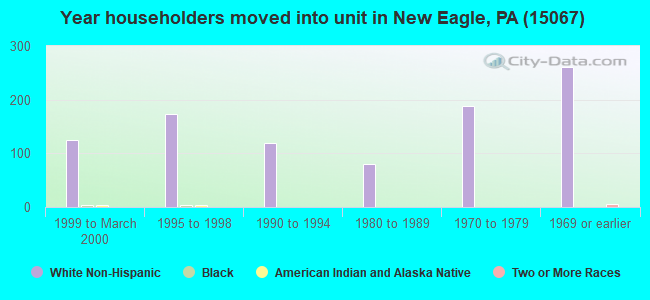
66% of the 15067 zip code residents lived in the same house 5 years ago. Out of people who lived in different houses, 70% lived in this county. Out of people who lived in different counties, 50% lived in Pennsylvania.
92% of the 15067 zip code residents lived in the same house 1 year ago. Out of people who lived in different houses, 34% moved from this county. Out of people who lived in different houses, 38% moved from different county within same state. Out of people who lived in different houses, 18% moved from different state. Out of people who lived in different houses, 11% moved from abroad.
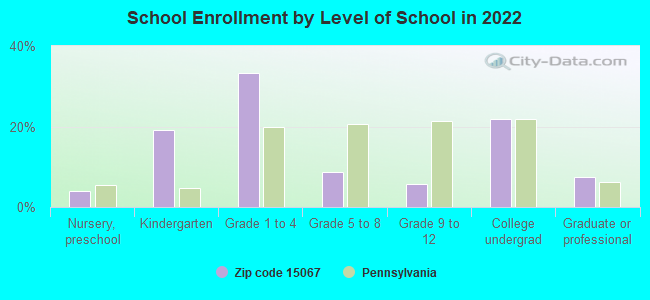
Private vs. public school enrollment:
Students in private schools in grades 1 to 8 (elementary and middle school):
Here:
0.0%
Pennsylvania:
15.7%
Students in private schools in grades 9 to 12 (high school):
Here:
0.0%
Pennsylvania:
13.4%
Students in private undergraduate colleges: 4
Here:
5.5%
Pennsylvania:
39.8%
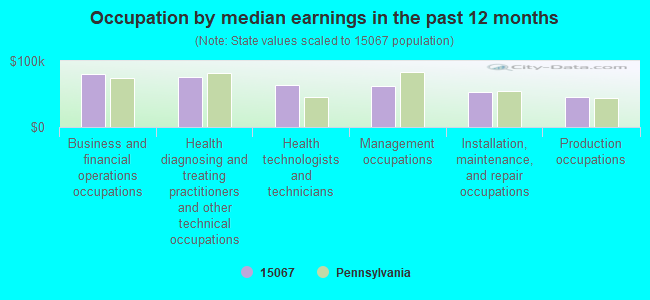
Occupation by median earnings in the past 12 months ($)
80,803Business and financial operations occupations
75,999Health diagnosing and treating practitioners and other technical occupations
63,014Health technologists and technicians
62,628Management occupations
53,760Installation, maintenance, and repair occupations
45,989Production occupations
Top industries in this zip code by the number of employees in 2005:
Utilities: Fossil Fuel Electric Power Generation (100-249 employees: 1 establishment)
Construction: Plumbing, Heating, and Air-Conditioning Contractors (20-49: 1, 1-4: 1)
Health Care and Social Assistance: Offices of Physicians (except Mental Health Specialists) (5-9: 3)
Construction: Framing Contractors (10-19: 1)
Accommodation and Food Services: Full-Service Restaurants (10-19: 1)
Administrative and Support and Waste Management and Remediation Services: Janitorial Services (10-19: 1)
Wholesale Trade: Petroleum and Petroleum Products Merchant Wholesalers (except Bulk Stations and Terminals) (5-9: 1)
People in group quarters in 2010:
4 people in group homes intended for adults
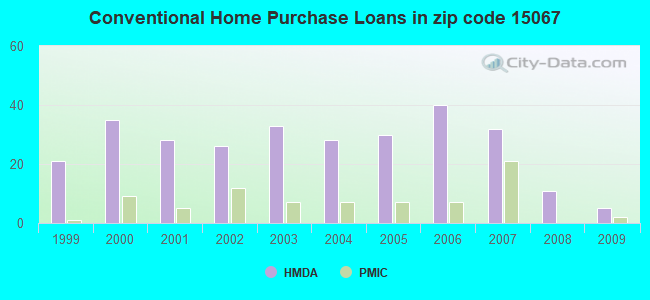
Home Mortgage Disclosure Act Aggregated Statistics For Year 2009 (Based on 2 partial tracts)
A) FHA, FSA/RHS & VA Home Purchase Loans
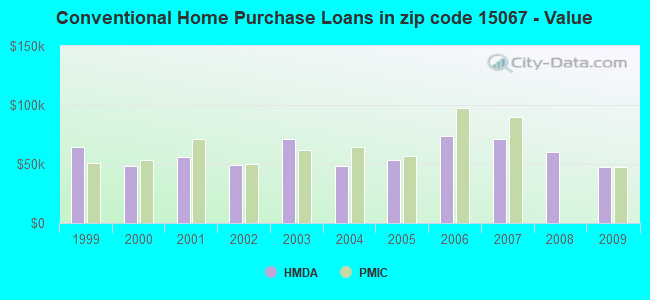
B) Conventional Home Purchase Loans
C) Refinancings
D) Home Improvement Loans
F) Non-occupant Loans on < 5 Family Dwellings (A B C & D)
G) Loans On Manufactured Home Dwelling (A B C & D)
Number
Average Value
Number
Average Value
Number
Average Value
Number
Average Value
Number
Average Value
Number
Average Value
LOANS ORIGINATED
21
$97,661
5
$47,450
21
$122,098
4
$17,575
0
$0
0
$0
APPLICATIONS APPROVED, NOT ACCEPTED
0
$0
0
$0
0
$0
0
$0
0
$0
0
$0
APPLICATIONS DENIED
0
$0
7
$54,730
23
$79,541
7
$8,787
4
$30,755
7
$35,650
APPLICATIONS WITHDRAWN
4
$59,752
0
$0
5
$105,444
2
$19,330
0
$0
0
$0
FILES CLOSED FOR INCOMPLETENESS
0
$0
0
$0
0
$0
0
$0
0
$0
0
$0
Aggregated Statistics For Year 2008 (Based on 2 partial tracts)
A) FHA, FSA/RHS & VA Home Purchase Loans
B) Conventional Home Purchase Loans
C) Refinancings
D) Home Improvement Loans
F) Non-occupant Loans on < 5 Family Dwellings (A B C & D)
G) Loans On Manufactured Home Dwelling (A B C & D)
Number
Average Value
Number
Average Value
Number
Average Value
Number
Average Value
Number
Average Value
Number
Average Value
LOANS ORIGINATED
12
$96,803
11
$59,911
16
$71,504
11
$17,574
4
$49,648
5
$106,850
APPLICATIONS APPROVED, NOT ACCEPTED
0
$0
0
$0
4
$111,155
0
$0
0
$0
0
$0
APPLICATIONS DENIED
0
$0
2
$35,150
39
$95,035
30
$30,696
2
$7,910
2
$39,540
APPLICATIONS WITHDRAWN
0
$0
0
$0
7
$67,786
0
$0
2
$29,875
0
$0
FILES CLOSED FOR INCOMPLETENESS
0
$0
0
$0
2
$13,180
0
$0
0
$0
0
$0
Aggregated Statistics For Year 2007 (Based on 2 partial tracts)
A) FHA, FSA/RHS & VA Home Purchase Loans
B) Conventional Home Purchase Loans
C) Refinancings
D) Home Improvement Loans
F) Non-occupant Loans on < 5 Family Dwellings (A B C & D)
G) Loans On Manufactured Home Dwelling (A B C & D)
Number
Average Value
Number
Average Value
Number
Average Value
Number
Average Value
Number
Average Value
Number
Average Value
LOANS ORIGINATED
9
$80,254
32
$71,394
30
$58,346
14
$24,604
5
$46,044
0
$0
APPLICATIONS APPROVED, NOT ACCEPTED
0
$0
0
$0
9
$71,663
4
$21,090
0
$0
0
$0
APPLICATIONS DENIED
0
$0
9
$48,036
53
$82,730
28
$26,424
4
$39,980
11
$59,592
APPLICATIONS WITHDRAWN
0
$0
5
$63,970
14
$43,182
5
$37,960
2
$61,510
0
$0
FILES CLOSED FOR INCOMPLETENESS
0
$0
2
$29,875
2
$10,545
0
$0
0
$0
0
$0
Aggregated Statistics For Year 2006 (Based on 2 partial tracts)
A) FHA, FSA/RHS & VA Home Purchase Loans
B) Conventional Home Purchase Loans
C) Refinancings
D) Home Improvement Loans
F) Non-occupant Loans on < 5 Family Dwellings (A B C & D)
G) Loans On Manufactured Home Dwelling (A B C & D)
Number
Average Value
Number
Average Value
Number
Average Value
Number
Average Value
Number
Average Value
Number
Average Value
LOANS ORIGINATED
5
$39,718
40
$73,459
46
$64,413
19
$32,928
5
$47,450
9
$37,687
APPLICATIONS APPROVED, NOT ACCEPTED
0
$0
2
$40,420
7
$75,819
7
$27,366
5
$19,682
0
$0
APPLICATIONS DENIED
2
$47,450
12
$40,713
56
$72,273
23
$43,859
4
$28,558
11
$48,248
APPLICATIONS WITHDRAWN
4
$47,890
9
$82,988
18
$68,929
0
$0
4
$27,680
0
$0
FILES CLOSED FOR INCOMPLETENESS
0
$0
0
$0
2
$114,230
0
$0
0
$0
0
$0
Aggregated Statistics For Year 2005 (Based on 2 partial tracts)
A) FHA, FSA/RHS & VA Home Purchase Loans
B) Conventional Home Purchase Loans
C) Refinancings
D) Home Improvement Loans
F) Non-occupant Loans on < 5 Family Dwellings (A B C & D)
G) Loans On Manufactured Home Dwelling (A B C & D)
Number
Average Value
Number
Average Value
Number
Average Value
Number
Average Value
Number
Average Value
Number
Average Value
LOANS ORIGINATED
11
$60,550
30
$53,718
65
$70,404
11
$32,592
9
$37,687
4
$38,662
APPLICATIONS APPROVED, NOT ACCEPTED
2
$76,445
0
$0
16
$67,879
2
$13,180
0
$0
2
$37,785
APPLICATIONS DENIED
2
$78,205
12
$37,198
53
$62,703
28
$20,649
12
$26,068
16
$21,748
APPLICATIONS WITHDRAWN
0
$0
7
$57,994
25
$77,466
14
$101,678
4
$54,920
0
$0
FILES CLOSED FOR INCOMPLETENESS
0
$0
0
$0
4
$86,552
0
$0
0
$0
0
$0
Aggregated Statistics For Year 2004 (Based on 2 partial tracts)
A) FHA, FSA/RHS & VA Home Purchase Loans
B) Conventional Home Purchase Loans
C) Refinancings
D) Home Improvement Loans
F) Non-occupant Loans on < 5 Family Dwellings (A B C & D)
G) Loans On Manufactured Home Dwelling (A B C & D)
Number
Average Value
Number
Average Value
Number
Average Value
Number
Average Value
Number
Average Value
Number
Average Value
LOANS ORIGINATED
2
$72,930
28
$48,391
67
$64,866
23
$36,218
5
$33,390
5
$82,950
APPLICATIONS APPROVED, NOT ACCEPTED
0
$0
2
$35,150
21
$60,672
2
$7,030
2
$7,030
2
$30,755
APPLICATIONS DENIED
0
$0
7
$67,033
60
$76,916
23
$16,810
5
$6,678
2
$880
APPLICATIONS WITHDRAWN
2
$72,055
5
$61,510
40
$87,167
0
$0
0
$0
0
$0
FILES CLOSED FOR INCOMPLETENESS
0
$0
2
$46,570
16
$67,879
2
$21,970
4
$66,780
0
$0
Aggregated Statistics For Year 2003 (Based on 2 partial tracts)
A) FHA, FSA/RHS & VA Home Purchase Loans
B) Conventional Home Purchase Loans
C) Refinancings
D) Home Improvement Loans
F) Non-occupant Loans on < 5 Family Dwellings (A B C & D)
Number
Average Value
Number
Average Value
Number
Average Value
Number
Average Value
Number
Average Value
LOANS ORIGINATED
4
$68,100
33
$70,828
116
$66,675
12
$32,219
7
$44,689
APPLICATIONS APPROVED, NOT ACCEPTED
0
$0
5
$78,028
33
$69,923
2
$11,425
2
$32,510
APPLICATIONS DENIED
0
$0
23
$37,364
120
$67,631
21
$11,883
9
$18,746
APPLICATIONS WITHDRAWN
0
$0
2
$47,450
33
$80,947
9
$16,402
0
$0
FILES CLOSED FOR INCOMPLETENESS
0
$0
2
$87,870
2
$27,240
0
$0
2
$87,870
Aggregated Statistics For Year 2002 (Based on 2 partial tracts)
A) FHA, FSA/RHS & VA Home Purchase Loans
B) Conventional Home Purchase Loans
C) Refinancings
D) Home Improvement Loans
F) Non-occupant Loans on < 5 Family Dwellings (A B C & D)
Number
Average Value
Number
Average Value
Number
Average Value
Number
Average Value
Number
Average Value
LOANS ORIGINATED
12
$55,065
26
$49,140
76
$56,769
14
$23,223
9
$26,361
APPLICATIONS APPROVED, NOT ACCEPTED
0
$0
12
$49,353
32
$62,882
2
$10,545
0
$0
APPLICATIONS DENIED
5
$62,914
7
$49,207
86
$55,358
18
$24,408
5
$33,040
APPLICATIONS WITHDRAWN
0
$0
4
$34,270
39
$49,478
2
$21,970
0
$0
FILES CLOSED FOR INCOMPLETENESS
0
$0
2
$43,055
4
$58,432
0
$0
0
$0
Aggregated Statistics For Year 2001 (Based on 2 partial tracts)
A) FHA, FSA/RHS & VA Home Purchase Loans
B) Conventional Home Purchase Loans
C) Refinancings
D) Home Improvement Loans
F) Non-occupant Loans on < 5 Family Dwellings (A B C & D)
Number
Average Value
Number
Average Value
Number
Average Value
Number
Average Value
Number
Average Value
LOANS ORIGINATED
18
$59,166
28
$55,609
81
$59,166
30
$26,595
5
$71,350
APPLICATIONS APPROVED, NOT ACCEPTED
0
$0
7
$39,416
35
$55,433
9
$12,692
2
$35,150
APPLICATIONS DENIED
2
$25,480
14
$32,889
65
$59,914
28
$21,465
4
$3,955
APPLICATIONS WITHDRAWN
0
$0
2
$32,510
28
$71,363
9
$9,178
2
$26,360
FILES CLOSED FOR INCOMPLETENESS
0
$0
0
$0
4
$32,513
0
$0
0
$0
Aggregated Statistics For Year 2000 (Based on 2 partial tracts)
A) FHA, FSA/RHS & VA Home Purchase Loans
B) Conventional Home Purchase Loans
C) Refinancings
D) Home Improvement Loans
F) Non-occupant Loans on < 5 Family Dwellings (A B C & D)
Number
Average Value
Number
Average Value
Number
Average Value
Number
Average Value
Number
Average Value
LOANS ORIGINATED
11
$64,545
35
$48,605
30
$48,973
21
$20,085
2
$147,620
APPLICATIONS APPROVED, NOT ACCEPTED
2
$48,330
4
$40,420
25
$57,713
4
$10,985
0
$0
APPLICATIONS DENIED
0
$0
16
$25,812
70
$53,676
25
$13,356
0
$0
APPLICATIONS WITHDRAWN
0
$0
5
$28,470
25
$52,160
4
$6,150
0
$0
FILES CLOSED FOR INCOMPLETENESS
0
$0
0
$0
4
$53,162
0
$0
0
$0
Aggregated Statistics For Year 1999 (Based on 1 partial tract)
A) FHA, FSA/RHS & VA Home Purchase Loans
B) Conventional Home Purchase Loans
C) Refinancings
D) Home Improvement Loans
F) Non-occupant Loans on < 5 Family Dwellings (A B C & D)


 Nearest zip codes: 15020, 15063, 15332, 15366, 15038, 15314.