Estimated zip code population in 2022: 12,630 Zip code population in 2010: 12,615 Zip code population in 2000: 13,212
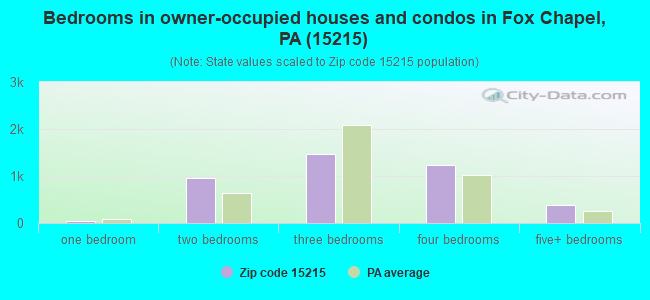
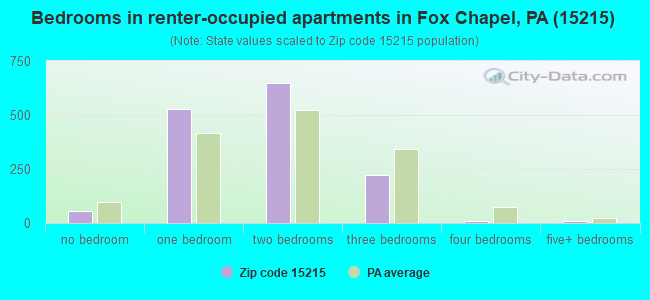
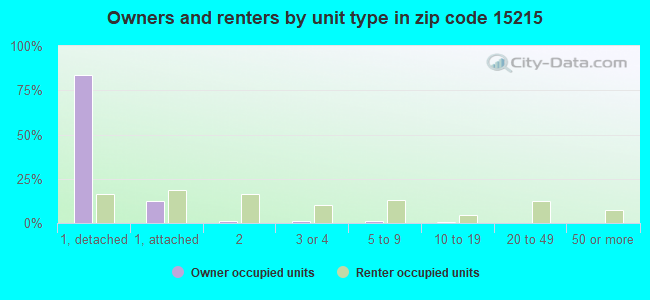
Houses and condos: 5,995 Renter-occupied apartments: 1,465
% of renters here:
26%
State:
31%
March 2022 cost of living index in zip code 15215: 94.5 (less than average, U.S. average is 100)
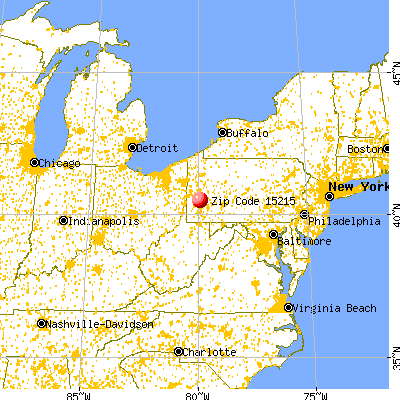
Land area: 6.2 sq. mi. Water area: 0.3 sq. mi.
Population density: 2,053 people per square mile
(low).
OSM Map
General Map
Google Map
MSN Map
OSM Map
General Map
Google Map
MSN Map
OSM Map
General Map
Google Map
MSN Map
OSM Map
General Map
Google Map
MSN Map
Please wait while loading the map...
Real estate property taxes paid for housing units in 2022:
This zip code:
1.4% ($4,367)
Pennsylvania:
1.3% ($3,094)
Median real estate property taxes paid for housing units with mortgages in 2022: $4,432 (1.3%) Median real estate property taxes paid for housing units with no mortgage in 2022: $4,286 (1.7%)
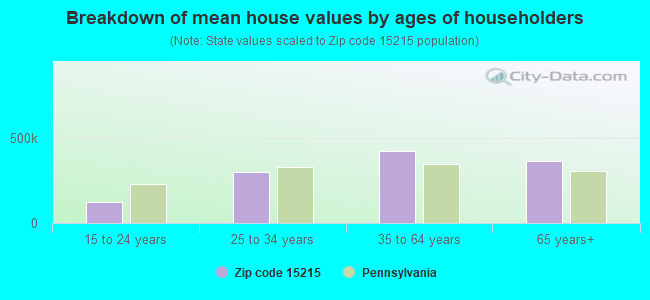
Estimated median house/condo value in 2022: $317,891
15215:
$317,891
Pennsylvania:
$245,500
According to our research of Pennsylvania and other state lists, there were 19 registered sex offenders living in 15215 zip code as of April 17, 2024. The ratio of all residents to sex offenders in zip code 15215 is 661 to 1. The ratio of registered sex offenders to all residents in this zip code is near the state average.
Median resident age:
This zip code:
41.9 years
Pennsylvania median age:
40.9 years
Average household size:
This zip code:
2.3 people
Pennsylvania:
2.4 people
Averages for the 2020 tax year for zip code 15215, filed in 2021:
Average Adjusted Gross Income (AGI) in 2020: $126,029 (Individual Income Tax Returns)
Here:
$126,029
State:
$75,707
Salary/wage: $95,759 (reported on 80.1% of returns)
Here:
$95,759
State:
$62,806
(% of AGI for various income ranges: 1013.6% for AGIs below $25k, 3453.3% for AGIs $25k-50k, 6381.5% for AGIs $50k-75k, 9090.0% for AGIs $75k-100k, 18405.1% for AGIs $100k-200k, 101593.8% for AGIs over 200k)
Taxable interest for individuals: $3,292 (reported on 40.8% of returns)
This zip code:
$3,292
Pennsylvania:
$1,633
(% of AGI for various income ranges: 28.6% for AGIs below $25k, 28.7% for AGIs $25k-50k, 49.0% for AGIs $50k-75k, 88.8% for AGIs $75k-100k, 137.5% for AGIs $100k-200k, 2503.5% for AGIs over 200k)
Ordinary dividends: $17,435 (reported on 34.8% of returns)
Here:
$17,435
State:
$7,382
(% of AGI for various income ranges: 73.3% for AGIs below $25k, 68.0% for AGIs $25k-50k, 170.8% for AGIs $50k-75k, 360.9% for AGIs $75k-100k, 895.4% for AGIs $100k-200k, 11349.6% for AGIs over 200k)
Net capital gain/loss in AGI: +$23,572 (reported on 31.1% of returns)
Here:
+$23,572
State:
+$23,522
(% of AGI for various income ranges: 54.9% for AGIs below $25k, 36.1% for AGIs $25k-50k, 165.7% for AGIs $50k-75k, 354.4% for AGIs $75k-100k, 816.7% for AGIs $100k-200k, 14855.4% for AGIs over 200k)
Profit/loss from business: +$24,048 (reported on 16.6% of returns)
Here:
+$24,048
State:
+$16,274
(% of AGI for various income ranges: 117.6% for AGIs below $25k, 126.3% for AGIs $25k-50k, 242.3% for AGIs $50k-75k, 466.8% for AGIs $75k-100k, 835.3% for AGIs $100k-200k, 5720.8% for AGIs over 200k)
Taxable individual retirement arrangement distribution: $25,342 (reported on 12.5% of returns)
15215:
$25,342
Pennsylvania:
$18,583
(% of AGI for various income ranges: 89.4% for AGIs below $25k, 137.4% for AGIs $25k-50k, 316.8% for AGIs $50k-75k, 447.4% for AGIs $75k-100k, 790.7% for AGIs $100k-200k, 3729.2% for AGIs over 200k)
Self-employed (Keogh) retirement plans: $24,390 (reported on 1.6% of returns)
15215:
$24,390
Pennsylvania:
$25,407
(% of AGI for various income ranges: 110.0% for AGIs $75k-100k, 794.2% for AGIs over 200k)
Total itemized deductions: $37,915 (reported on 10.6% of returns)
Here:
$37,915
State:
$34,850
(% of AGI for various income ranges: 41.1% for AGIs below $25k, 76.7% for AGIs $25k-50k, 210.7% for AGIs $50k-75k, 430.0% for AGIs $75k-100k, 769.5% for AGIs $100k-200k, 6556.2% for AGIs over 200k)
Charity contributions: $15,991 (reported on 9.0% of returns)
Here:
$15,991
State:
$12,392
(% of AGI for various income ranges: 9.6% for AGIs $25k-50k, 23.7% for AGIs $50k-75k, 63.5% for AGIs $75k-100k, 169.3% for AGIs $100k-200k, 2957.7% for AGIs over 200k)
Taxes paid: $8,907 (reported on 10.6% of returns)
15215:
$8,907
State:
$8,200
(% of AGI for various income ranges: 7.8% for AGIs below $25k, 15.6% for AGIs $25k-50k, 67.8% for AGIs $50k-75k, 152.9% for AGIs $75k-100k, 227.5% for AGIs $100k-200k, 1345.0% for AGIs over 200k)
Earned income credit: $1,741 (reported on 8.8% of returns)
Here:
$1,741
State:
$2,100
(% of AGI for various income ranges: 53.4% for AGIs below $25k, 39.1% for AGIs $25k-50k)
Percentage of individuals using paid preparers for their 2020 taxes: 91.0%
Here:
91%
State:
92%
(% for various income ranges: 88.4% for AGIs below $25k, 91.9% for AGIs $25k-50k, 91.7% for AGIs $50k-75k, 90.2% for AGIs $75k-100k, 91.2% for AGIs $100k-200k, 94.3% for AGIs over 200k)
Averages for the 2012 tax year for zip code 15215, filed in 2013:
Average Adjusted Gross Income (AGI) in 2012: $110,785 (Individual Income Tax Returns)
Here:
$110,785
State:
$61,346
Salary/wage: $74,860 (reported on 81.8% of returns)
Here:
$74,860
State:
$51,902
(% of AGI for various income ranges: 70.9% for AGIs below $25k, 79.5% for AGIs $25k-50k, 75.0% for AGIs $50k-75k, 73.7% for AGIs $75k-100k, 72.2% for AGIs $100k-200k, 43.2% for AGIs over 200k)
Taxable interest for individuals: $3,648 (reported on 41.6% of returns)
This zip code:
$3,648
Pennsylvania:
$1,588
(% of AGI for various income ranges: 1.4% for AGIs below $25k, 0.6% for AGIs $25k-50k, 0.6% for AGIs $50k-75k, 0.9% for AGIs $75k-100k, 0.9% for AGIs $100k-200k, 1.7% for AGIs over 200k)
Ordinary dividends: $13,012 (reported on 34.9% of returns)
Here:
$13,012
State:
$5,827
(% of AGI for various income ranges: 2.8% for AGIs below $25k, 1.9% for AGIs $25k-50k, 1.9% for AGIs $50k-75k, 2.8% for AGIs $75k-100k, 3.6% for AGIs $100k-200k, 4.9% for AGIs over 200k)
Net capital gain/loss in AGI: +$38,506 (reported on 26.4% of returns)
Here:
+$38,506
State:
+$14,495
(% of AGI for various income ranges: 0.4% for AGIs below $25k, 0.3% for AGIs $25k-50k, 0.5% for AGIs $50k-75k, 0.6% for AGIs $75k-100k, 2.1% for AGIs $100k-200k, 14.3% for AGIs over 200k)
Profit/loss from business: +$25,085 (reported on 15.6% of returns)
Here:
+$25,085
State:
+$16,268
(% of AGI for various income ranges: 5.1% for AGIs below $25k, 3.5% for AGIs $25k-50k, 3.4% for AGIs $50k-75k, 4.4% for AGIs $75k-100k, 5.4% for AGIs $100k-200k, 2.9% for AGIs over 200k)
Taxable individual retirement arrangement distribution: $23,966 (reported on 13.9% of returns)
15215:
$23,966
Pennsylvania:
$14,550
(% of AGI for various income ranges: 4.6% for AGIs below $25k, 2.4% for AGIs $25k-50k, 3.9% for AGIs $50k-75k, 3.9% for AGIs $75k-100k, 4.7% for AGIs $100k-200k, 2.4% for AGIs over 200k)
Self-employment retirement plans: $20,038 (reported on 2.0% of returns)
15215:
$20,038
Pennsylvania:
$20,922
Total itemized deductions: $31,578 (12% of AGI, reported on 34.8% of returns)
Here:
$31,578
State:
$23,538
Here:
12.1% of AGI
State:
18.4% of AGI
(% of AGI for various income ranges: 6.7% for AGIs below $25k, 6.5% for AGIs $25k-50k, 10.1% for AGIs $50k-75k, 12.8% for AGIs $75k-100k, 14.1% for AGIs $100k-200k, 9.1% for AGIs over 200k)
Charity contributions: $5,770 (reported on 30.0% of returns)
Here:
$5,770
State:
$4,025
(% of AGI for various income ranges: 0.4% for AGIs below $25k, 0.5% for AGIs $25k-50k, 0.9% for AGIs $50k-75k, 1.2% for AGIs $75k-100k, 1.7% for AGIs $100k-200k, 1.8% for AGIs over 200k)
Taxes paid: $17,095 (reported on 34.8% of returns)
15215:
$17,095
State:
$9,982
(% of AGI for various income ranges: 2.3% for AGIs below $25k, 2.4% for AGIs $25k-50k, 4.9% for AGIs $50k-75k, 6.0% for AGIs $75k-100k, 7.1% for AGIs $100k-200k, 5.4% for AGIs over 200k)
Earned income credit: $1,896 (reported on 11.0% of returns)
Here:
$1,896
State:
$2,106
(% of AGI for various income ranges: 3.9% for AGIs below $25k, 0.6% for AGIs $25k-50k)
Percentage of individuals using paid preparers for their 2012 taxes: 50.4%
Here:
50%
State:
53%
(% for various income ranges: 44.5% for AGIs below $25k, 43.2% for AGIs $25k-50k, 50.0% for AGIs $50k-75k, 53.8% for AGIs $75k-100k, 58.0% for AGIs $100k-200k, 77.0% for AGIs over 200k)
Averages for the 2004 tax year for zip code 15215, filed in 2005:
Average Adjusted Gross Income (AGI) in 2004: $81,705 (Individual Income Tax Returns)
Here:
$81,705
State:
$48,049
Salary/wage: $62,959 (reported on 78.3% of returns)
Here:
$62,959
State:
$42,646
(% of AGI for various income ranges: 99.0% for AGIs below $10k, 66.5% for AGIs $10k-25k, 78.4% for AGIs $25k-50k, 76.7% for AGIs $50k-75k, 76.6% for AGIs $75k-100k, 53.3% for AGIs over 100k)
Taxable interest for individuals: $3,377 (reported on 56.6% of returns)
This zip code:
$3,377
Pennsylvania:
$1,657
(% of AGI for various income ranges: 10.1% for AGIs below $10k, 3.8% for AGIs $10k-25k, 1.7% for AGIs $25k-50k, 1.9% for AGIs $50k-75k, 2.0% for AGIs $75k-100k, 2.3% for AGIs over 100k)
Taxable dividends: $7,556 (reported on 42.1% of returns)
Here:
$7,556
State:
$3,566
(% of AGI for various income ranges: 13.9% for AGIs below $10k, 3.5% for AGIs $10k-25k, 1.9% for AGIs $25k-50k, 2.9% for AGIs $50k-75k, 2.4% for AGIs $75k-100k, 4.4% for AGIs over 100k)
Net capital gain/loss: +$16,733 (reported on 33.6% of returns)
Here:
+$16,733
State:
+$9,716
(% of AGI for various income ranges: -4.9% for AGIs below $10k, 1.7% for AGIs $10k-25k, 0.9% for AGIs $25k-50k, 0.7% for AGIs $50k-75k, 1.8% for AGIs $75k-100k, 9.4% for AGIs over 100k)
Profit/loss from business: +$21,727 (reported on 16.0% of returns)
Here:
+$21,727
State:
+$14,267
(% of AGI for various income ranges: 12.5% for AGIs below $10k, 5.1% for AGIs $10k-25k, 3.5% for AGIs $25k-50k, 3.7% for AGIs $50k-75k, 3.8% for AGIs $75k-100k, 4.3% for AGIs over 100k)
IRA payment deduction: $3,009 (reported on 3.4% of returns)
15215:
$3,009
Pennsylvania:
$2,903
(% of AGI for various income ranges: 0.4% for AGIs $10k-25k, 0.5% for AGIs $25k-50k, 0.2% for AGIs $50k-75k, 0.2% for AGIs $75k-100k, 0.0% for AGIs over 100k)
Self-employed pension: $17,606 (reported on 2.3% of returns)
Here:
$17,606
Pennsylvania:
$14,674
Total itemized deductions: $26,323 (14% of AGI, reported on 35.9% of returns)
Here:
$26,323
State:
$18,804
Here:
14.2% of AGI
State:
19.5% of AGI
(% of AGI for various income ranges: 14.1% for AGIs below $10k, 9.0% for AGIs $10k-25k, 9.5% for AGIs $25k-50k, 13.4% for AGIs $50k-75k, 15.7% for AGIs $75k-100k, 11.3% for AGIs over 100k)
Charity contributions deductions: $5,643 (3% of AGI, reported on 32.6% of returns)
Here:
$5,643
State:
$3,337
Here:
2.9% of AGI
State:
3.3% of AGI
(% of AGI for various income ranges: 0.6% for AGIs below $10k, 0.8% for AGIs $10k-25k, 1.0% for AGIs $25k-50k, 1.6% for AGIs $50k-75k, 1.7% for AGIs $75k-100k, 2.7% for AGIs over 100k)
Total tax: $20,295 (reported on 76.4% of returns)
15215:
$20,295
State:
$8,008
(% of AGI for various income ranges: 4.1% for AGIs below $10k, 4.8% for AGIs $10k-25k, 8.0% for AGIs $25k-50k, 9.5% for AGIs $50k-75k, 11.2% for AGIs $75k-100k, 23.5% for AGIs over 100k)
Earned income credit: $1,415 (reported on 9.5% of returns)
Here:
$1,415
State:
$1,643
Percentage of individuals using paid preparers for their 2004 taxes: 53.1%
Here:
53%
State:
56%
(% for various income ranges: 51.5% for AGIs below $10k, 48.1% for AGIs $10k-25k, 45.4% for AGIs $25k-50k, 52.5% for AGIs $50k-75k, 55.5% for AGIs $75k-100k, 70.5% for AGIs over 100k)
Household received Food Stamps/SNAP in the past 12 months: 573 Household did not receive Food Stamps/SNAP in the past 12 months: 4,944
Women who had a birth in the past 12 months: 264 (245 now married, 29 unmarried) Women who did not have a birth in the past 12 months: 2,347 (993 now married, 1,352 unmarried)
Housing units in zip code 15215 with a mortgage: 2,483 (400 second mortgage, 8 home equity loan, 365 both second mortgage and home equity loan) Houses without a mortgage: 113
Median monthly owner costs for units with a mortgage: $1,958 Median monthly owner costs for units without a mortgage: $719
Residents with income below the poverty level in 2022:
This zip code:
7.5%
Whole state:
11.8%
Residents with income below 50% of the poverty level in 2022:
This zip code:
3.4%
Whole state:
6.1%
Median number of rooms in houses and condos:
Here:
7.1
State:
6.8
Median number of rooms in apartments:
Here:
4.1
State:
4.3
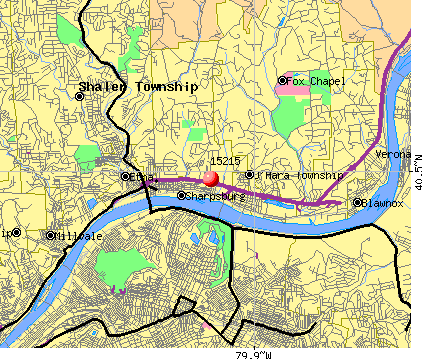
Notable locations in this zip code not listed on our city pages
Notable locations in zip code 15215: Aspinwall Borough Hall (A), Aspinwall Police Department (B), Little Peoples Child Care Center (C), Sharpsburg Borough Hall (D), Sharpsburg Branch Library (E), Sharpsburg Police Department (F), Sisters of Divine Providence Convent (G), Parkview Volunteer Fire Department Station 218 Parkview Emergency Medical Services Station 218 (H), Sharpsburg Volunteer Fire Department Station 265 (I), Aspinwall Volunteer Fire Department (J), Sharps Hill Volunteer Fire Department Station 263 (K), Pleasant Valley Volunteer Fire Company 1 Station 217 (L). Display/hide their locations on the map
Churches in zip code 15215 include: Sharpsburg Family Worship Center (A), Saint John Mark Evangelical Lutheran Church (B), Saint John Cantius Church (C), Grace United Methodist Church of Sharpsburg (D), First Evangelical Lutheran Church (E). Display/hide their locations on the map
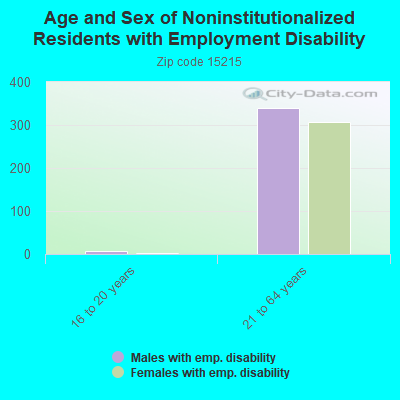
In group quarters: 163 (-1 institutionalized population)
Size of family households: 1,569 2-persons, 685 3-persons, 586 4-persons, 267 5-persons, 43 6-persons, 51 7-or-more-persons
Size of nonfamily households: 1,967 1-person, 334 2-persons, 33 3-persons
2,097 married couples with children.
598 single-parent households (220 men, 378 women).
89.7% of residents of 15215 zip code speak English at home.
1.3% of residents speak Spanish at home (73% very well, 27% well).
3.0% of residents speak other Indo-European language at home (85% very well, 15% well).
5.2% of residents speak Asian or Pacific Island language at home (40% very well, 47% well, 12% not well, 1% not at all).
0.5% of residents speak other language at home (60% very well, 40% not at all).
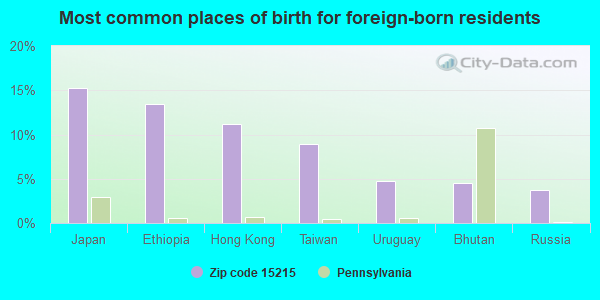
Foreign born population: 1,168 (9.3%) (49.9% of them are naturalized citizens)
Facilities with environmental interests located in this zip code:
AZCON SHARPSBURG FAC (19TH ST & ALLEGHENY RIVER in SHARPSBURG, PA)
AIR MINOR (AIRS/AFS) STATE MASTER (Pennsylvania database) - PCS-PA0205231, National Pollutant Discharge Elimination System Permit National Pollutant Discharge Elimination System NON-MAJOR (Tracking pollutant discharge elimination systems) - permit Business SIC classification: SCRAP AND WASTE MATERIALS; SERVICES Alternative names: AZCON CORPORATION, AZCON CORP SHARPSBURG FAC, AZCON SCRAP CORPORATION
ARTISTIC CLEANERS (1012 N CANAL ST in SHARPSBURG, PA)
AIR MINOR (AIRS/AFS) CRITERIA AND HAZARDOUS AIR POLLUTANT INVENTORY (Inventory of air pollution sources) Small Quantity Generators, between 100 kg and 1000 kg of hazardous waste/month (Resource Conservation and Recovery Act (tracking hazardous waste)) - notification Business SIC classification: DRYCLEANING PLANTS, EXCEPT RUG CLEANING Organizations: OPERNAME (CONTACT/OPERATOR)
, IANNUZZI, SAM (CONTACT/OWNER)
ARMSTRONG STORE FIXTURE CORP (16TH AND MARY'S AVENUE in PITTSBURGH, PA)
(Resource Conservation and Recovery Act (tracking hazardous waste)) TRI REPORTER (Tracking of toxic chemicals releasing facilities) Business SIC classification: OFFICE AND STORE FIXTURES, PARTITIONS, SHELVING, AND LOCKERS, EXCEPT WOOD Organizations: OPERNAME (CONTACT/OPERATOR)
, ARMSTRONG STORE FIXTURE CORPORATION (CONTACT/OWNER)
ASPINWALL BORO (217 COMMERCIAL AVE in ASPINWALL, PA)
National Pollutant Discharge Elimination System NON-MAJOR (Tracking pollutant discharge elimination systems) - permit Business SIC classification: SEWERAGE SYSTEMS
Housing units lacking complete plumbing facilities: 1.0% Housing units lacking complete kitchen facilities: 1.2%
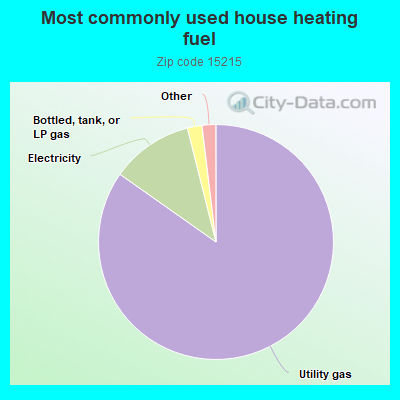
84.7%Utility gas
11.3%Electricity
2.0%Bottled, tank, or LP gas
0.8%Fuel oil, kerosene, etc.
0.6%Coal or coke
Population in 1990: 12,801. Population change in the 1990s: +411 (+3.2%).
Place of birth for U.S.-born residents:
This state: 8,698
Northeast: 768
Midwest: 872
South: 790
West: 312
67% of the 15215 zip code residents lived in the same house 5 years ago. Out of people who lived in different houses, 80% lived in this county. Out of people who lived in different counties, 50% lived in Pennsylvania.
91% of the 15215 zip code residents lived in the same house 1 year ago. Out of people who lived in different houses, 67% moved from this county. Out of people who lived in different houses, 12% moved from different county within same state. Out of people who lived in different houses, 19% moved from different state. Out of people who lived in different houses, 2% moved from abroad.
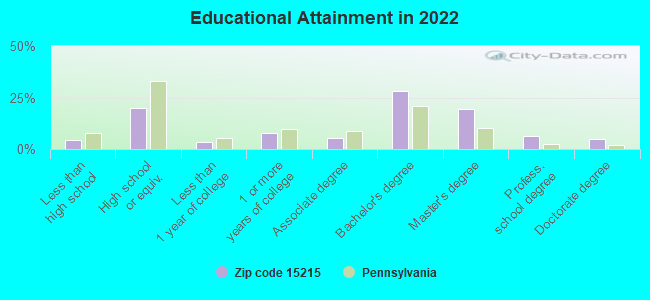
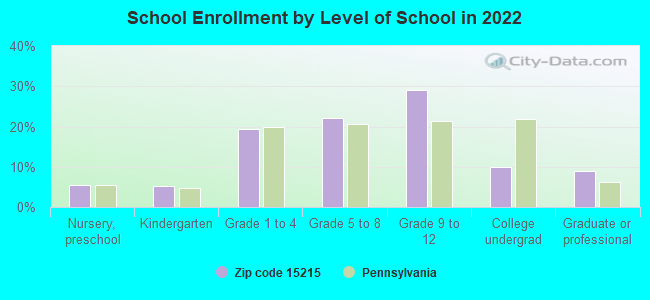
Private vs. public school enrollment:
Students in private schools in grades 1 to 8 (elementary and middle school): 64
Here:
5.2%
Pennsylvania:
15.7%
Students in private schools in grades 9 to 12 (high school): 86
Here:
10.0%
Pennsylvania:
13.4%
Students in private undergraduate colleges: 87
Here:
29.3%
Pennsylvania:
39.8%
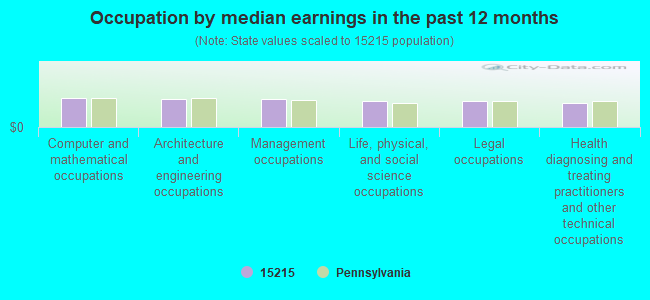
Occupation by median earnings in the past 12 months ($)
109,155Computer and mathematical occupations
105,855Architecture and engineering occupations
102,661Management occupations
96,288Life, physical, and social science occupations
95,229Legal occupations
89,899Health diagnosing and treating practitioners and other technical occupations
Companies with federal contracts located in this zip code (PITTSBURGH, PA):
TJR ENTERPRISES INC (1601 MARYS AVENUE; small business) : $61,707,841 in 422 contractsfrom 1999 to 2006
Contracts for Maintenance, Repair or Alteration of Real Property -- Miscellaneous Buildings, Maintenance, Repair or Alteration of Real Property -- Government-Owned Government-Operated (GOGO) R&D Facilities, Construction of Structures and Facilities -- Other Hospital Buildings, Maintenance, Repair or Alteration of Real Property -- Other Administrative Facilities and Service Buildings, and moreby ENERGY, Department of, Department of Veterans Affairs, Centers for Disease Control and Prevention, U.S. Army Corps of Engineers - civil program financing only, and others Signed by year:2000: $6,394,785; 2001: $11,552,985; 2002: $17,587,396; 2003: $8,424,527; 2004: $6,217,131; 2005: $7,028,906; 2006: $3,715,111.
Biggest contracts:
$2,100,000 with ENERGY, Department of for Maintenance, Repair or Alteration of Real Property -- Miscellaneous Buildings. Signed on 2002-09-15. Completion date: 2004-01-15.
$1,650,000 with ENERGY, Department of for Maintenance, Repair or Alteration of Real Property -- Government-Owned Government-Operated (GOGO) R&D Facilities. Signed on 2001-05-15. Completion date: 2003-02-15.
$1,584,000, same as above.Signed on 2000-08-15. Completion date: 2002-08-15.
$1,425,000 with Department of Veterans Affairs for Construction of Structures and Facilities -- Other Hospital Buildings. Signed on 2002-09-15. Completion date: 2003-04-15.
F C G SOLUTIONS, INC (214 FARMINGTON ROAD; small business) : $743,572 in 14 contractsfrom 2005 to 2006
Contracts for Program Management/Support Services by Army Signed by year:2000: $0; 2001: $0; 2002: $0; 2003: $0; 2004: $0; 2005: $204,506; 2006: $539,066.
Biggest contracts:
$420,705 with Army for Program Management/Support Services. Signed on 2006-01-31. Completion date: 2006-08-31.
$134,976, same as above.Signed on 2005-09-02. Completion date: 2006-08-31.
$64,468, same as above.Signed on 2005-11-21. Completion date: 2006-08-31.
$52,971, same as above.Signed on 2006-01-31. Completion date: 2006-08-31.
REDPATH GENETICS (311 BARBERRY DR; small business)
$69,320 with Army for Other Medical -- Basic Research (R&D). Signed on 2002-12-13. Completion date: 2003-07-15.
DONNELLY, FRANK T COMPANY (15TH & S CANAL STS; small business)
$9,590 with Army for Oils and Greases: Cutting, Lubricating, and Hydraulic. Taking place in VA. Signed on 2005-12-23. Completion date: 2006-01-23.
Top industries in this zip code by the number of employees in 2005:
Health Care and Social Assistance: General Medical and Surgical Hospitals (over 1000 employees: 1 establishment)
Administrative and Support and Waste Management and Remediation Services: Security Guards and Patrol Services (500-999: 1, 100-249: 1)
Health Care and Social Assistance: Offices of Physicians (except Mental Health Specialists) (20-49: 6, 10-19: 14, 5-9: 5, 1-4: 14)
Health Care and Social Assistance: Home Health Care Services (100-249: 1, 20-49: 1)
2004 - 2018 National Fire Incident Reporting System (NFIRS) incidents
Based on the data from the years 2004 - 2018 the average number of fires per year is 23. The highest number of fire incidents - 67 took place in 2016, and the least - 2 in 2007. The data has a growing trend.
When looking into fire subcategories, the most reports belonged to: Structure Fires (68.7%), and Outside Fires (12.5%).
Fire incident types reported to NFIRS in Zip Code 15215


 Nearest zip codes: 15116, 15206, 15223, 15238, 15201, 15224.


 Based on the data from the years 2004 - 2018 the average number of fires per year is 23. The highest number of fire incidents - 67 took place in 2016, and the least - 2 in 2007. The data has a growing trend.
 When looking into fire subcategories, the most reports belonged to: Structure Fires (68.7%), and Outside Fires (12.5%).