Estimated zip code population in 2022: 10,858 Zip code population in 2010: 10,141 Zip code population in 2000: 12,095
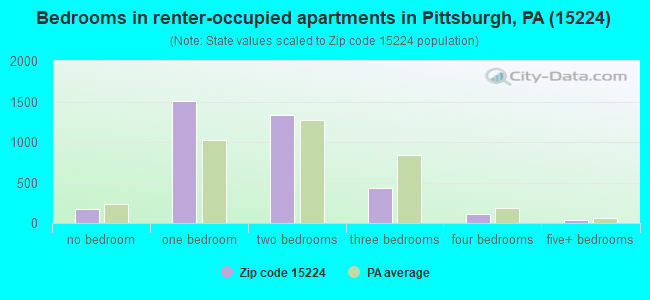
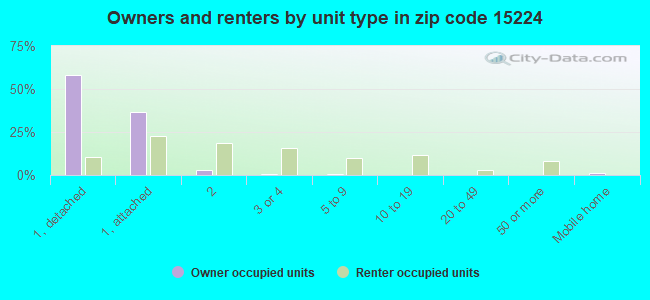
Houses and condos: 6,460 Renter-occupied apartments: 3,571
% of renters here:
62%
State:
31%
March 2022 cost of living index in zip code 15224: 95.4 (near average, U.S. average is 100)
Land area: 1.0 sq. mi. Water area: 0.0 sq. mi.
Population density: 10,787 people per square mile
(high).
OSM Map
General Map
Google Map
MSN Map
OSM Map
General Map
Google Map
MSN Map
OSM Map
General Map
Google Map
MSN Map
OSM Map
General Map
Google Map
MSN Map
Please wait while loading the map...
Real estate property taxes paid for housing units in 2022:
This zip code:
0.7% ($1,661)
Pennsylvania:
1.3% ($3,094)
Median real estate property taxes paid for housing units with mortgages in 2022: $2,002 (0.8%) Median real estate property taxes paid for housing units with no mortgage in 2022: $1,217 (0.6%)
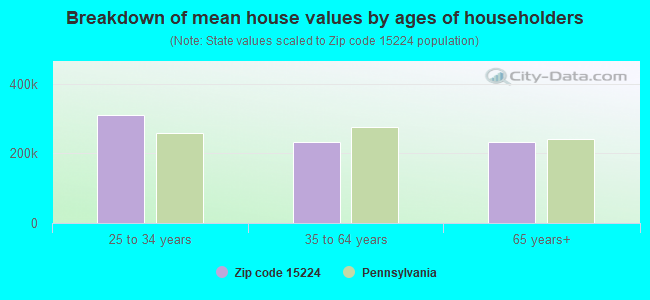
Estimated median house/condo value in 2022: $245,609
15224:
$245,609
Pennsylvania:
$245,500
According to our research of Pennsylvania and other state lists, there were 10 registered sex offenders living in 15224 zip code as of April 19, 2024. The ratio of all residents to sex offenders in zip code 15224 is 1,095 to 1. The ratio of registered sex offenders to all residents in this zip code is lower than the state average.
Median resident age:
This zip code:
34.0 years
Pennsylvania median age:
40.9 years
Average household size:
This zip code:
1.8 people
Pennsylvania:
2.4 people
Averages for the 2020 tax year for zip code 15224, filed in 2021:
Average Adjusted Gross Income (AGI) in 2020: $54,036 (Individual Income Tax Returns)
Here:
$54,036
State:
$75,707
Salary/wage: $50,209 (reported on 87.4% of returns)
Here:
$50,209
State:
$62,806
(% of AGI for various income ranges: 1079.6% for AGIs below $25k, 3679.4% for AGIs $25k-50k, 6988.6% for AGIs $50k-75k, 10836.6% for AGIs $75k-100k, 18295.2% for AGIs $100k-200k, 69195.0% for AGIs over 200k)
Taxable interest for individuals: $585 (reported on 24.8% of returns)
This zip code:
$585
Pennsylvania:
$1,633
(% of AGI for various income ranges: 8.2% for AGIs below $25k, 9.1% for AGIs $25k-50k, 14.7% for AGIs $50k-75k, 36.6% for AGIs $75k-100k, 84.5% for AGIs $100k-200k, 175.0% for AGIs over 200k)
Ordinary dividends: $2,907 (reported on 18.8% of returns)
Here:
$2,907
State:
$7,382
(% of AGI for various income ranges: 15.6% for AGIs below $25k, 16.9% for AGIs $25k-50k, 50.9% for AGIs $50k-75k, 121.0% for AGIs $75k-100k, 379.7% for AGIs $100k-200k, 1296.7% for AGIs over 200k)
Net capital gain/loss in AGI: +$7,457 (reported on 16.8% of returns)
Here:
+$7,457
State:
+$23,522
(% of AGI for various income ranges: 14.3% for AGIs below $25k, 20.7% for AGIs $25k-50k, 52.1% for AGIs $50k-75k, 159.7% for AGIs $75k-100k, 397.1% for AGIs $100k-200k, 7633.3% for AGIs over 200k)
Profit/loss from business: +$11,160 (reported on 12.6% of returns)
Here:
+$11,160
State:
+$16,274
(% of AGI for various income ranges: 84.3% for AGIs below $25k, 85.6% for AGIs $25k-50k, 139.0% for AGIs $50k-75k, 227.2% for AGIs $75k-100k, 724.5% for AGIs $100k-200k, 2776.7% for AGIs over 200k)
Taxable individual retirement arrangement distribution: $11,011 (reported on 4.9% of returns)
15224:
$11,011
Pennsylvania:
$18,583
(% of AGI for various income ranges: 28.6% for AGIs below $25k, 33.8% for AGIs $25k-50k, 109.4% for AGIs $50k-75k, 162.8% for AGIs $75k-100k, 298.1% for AGIs $100k-200k)
Total itemized deductions: $24,791 (reported on 4.0% of returns)
Here:
$24,791
State:
$34,850
(% of AGI for various income ranges: 141.0% for AGIs $50k-75k, 229.0% for AGIs $75k-100k, 693.2% for AGIs $100k-200k, 3170.0% for AGIs over 200k)
Charity contributions: $7,606 (reported on 3.0% of returns)
Here:
$7,606
State:
$12,392
(% of AGI for various income ranges: 8.1% for AGIs $50k-75k, 21.0% for AGIs $75k-100k, 147.4% for AGIs $100k-200k, 1196.7% for AGIs over 200k)
Taxes paid: $8,500 (reported on 4.0% of returns)
15224:
$8,500
State:
$8,200
(% of AGI for various income ranges: 42.9% for AGIs $50k-75k, 82.8% for AGIs $75k-100k, 295.8% for AGIs $100k-200k, 830.0% for AGIs over 200k)
Earned income credit: $1,713 (reported on 13.3% of returns)
Here:
$1,713
State:
$2,100
(% of AGI for various income ranges: 60.5% for AGIs below $25k, 30.9% for AGIs $25k-50k)
Percentage of individuals using paid preparers for their 2020 taxes: 93.2%
Here:
93%
State:
92%
(% for various income ranges: 91.4% for AGIs below $25k, 94.4% for AGIs $25k-50k, 93.5% for AGIs $50k-75k, 93.0% for AGIs $75k-100k, 94.0% for AGIs $100k-200k, 93.8% for AGIs over 200k)
Averages for the 2012 tax year for zip code 15224, filed in 2013:
Average Adjusted Gross Income (AGI) in 2012: $35,375 (Individual Income Tax Returns)
Here:
$35,375
State:
$61,346
Salary/wage: $33,156 (reported on 87.1% of returns)
Here:
$33,156
State:
$51,902
(% of AGI for various income ranges: 80.6% for AGIs below $25k, 88.2% for AGIs $25k-50k, 85.3% for AGIs $50k-75k, 80.1% for AGIs $75k-100k, 79.6% for AGIs $100k-200k, 50.3% for AGIs over 200k)
Taxable interest for individuals: $679 (reported on 23.0% of returns)
This zip code:
$679
Pennsylvania:
$1,588
(% of AGI for various income ranges: 0.6% for AGIs below $25k, 0.3% for AGIs $25k-50k, 0.5% for AGIs $50k-75k, 0.5% for AGIs $75k-100k, 0.4% for AGIs $100k-200k, 0.5% for AGIs over 200k)
Ordinary dividends: $2,723 (reported on 13.3% of returns)
Here:
$2,723
State:
$5,827
(% of AGI for various income ranges: 0.6% for AGIs below $25k, 0.5% for AGIs $25k-50k, 0.9% for AGIs $50k-75k, 0.9% for AGIs $75k-100k, 2.4% for AGIs $100k-200k, 2.5% for AGIs over 200k)
Net capital gain/loss in AGI: +$4,489 (reported on 8.1% of returns)
Here:
+$4,489
State:
+$14,495
(% of AGI for various income ranges: 0.3% for AGIs $25k-50k, 1.0% for AGIs $75k-100k, 5.8% for AGIs $100k-200k)
Profit/loss from business: +$8,615 (reported on 11.0% of returns)
Here:
+$8,615
State:
+$16,268
(% of AGI for various income ranges: 4.9% for AGIs below $25k, 2.1% for AGIs $25k-50k, 1.9% for AGIs $50k-75k, 3.3% for AGIs $75k-100k, 2.8% for AGIs $100k-200k)
Taxable individual retirement arrangement distribution: $10,397 (reported on 5.9% of returns)
15224:
$10,397
Pennsylvania:
$14,550
(% of AGI for various income ranges: 1.8% for AGIs below $25k, 1.3% for AGIs $25k-50k, 1.7% for AGIs $50k-75k, 2.3% for AGIs $75k-100k, 3.2% for AGIs $100k-200k)
Total itemized deductions: $15,274 (18% of AGI, reported on 12.4% of returns)
Here:
$15,274
State:
$23,538
Here:
17.6% of AGI
State:
18.4% of AGI
(% of AGI for various income ranges: 2.4% for AGIs below $25k, 3.2% for AGIs $25k-50k, 5.5% for AGIs $50k-75k, 7.7% for AGIs $75k-100k, 10.3% for AGIs $100k-200k, 8.4% for AGIs over 200k)
Charity contributions: $2,679 (reported on 9.5% of returns)
Here:
$2,679
State:
$4,025
(% of AGI for various income ranges: 0.2% for AGIs below $25k, 0.4% for AGIs $25k-50k, 0.5% for AGIs $50k-75k, 1.3% for AGIs $75k-100k, 1.6% for AGIs $100k-200k, 1.2% for AGIs over 200k)
Taxes paid: $6,407 (reported on 12.4% of returns)
15224:
$6,407
State:
$9,982
(% of AGI for various income ranges: 0.4% for AGIs below $25k, 1.0% for AGIs $25k-50k, 2.2% for AGIs $50k-75k, 3.6% for AGIs $75k-100k, 5.2% for AGIs $100k-200k, 4.6% for AGIs over 200k)
Earned income credit: $1,791 (reported on 19.6% of returns)
Here:
$1,791
State:
$2,106
(% of AGI for various income ranges: 4.5% for AGIs below $25k, 0.6% for AGIs $25k-50k)
Percentage of individuals using paid preparers for their 2012 taxes: 36.1%
Here:
36%
State:
53%
(% for various income ranges: 33.9% for AGIs below $25k, 32.8% for AGIs $25k-50k, 40.0% for AGIs $50k-75k, 48.1% for AGIs $75k-100k, 57.1% for AGIs $100k-200k, 75.0% for AGIs over 200k)
Averages for the 2004 tax year for zip code 15224, filed in 2005:
Average Adjusted Gross Income (AGI) in 2004: $26,520 (Individual Income Tax Returns)
Here:
$26,520
State:
$48,049
Salary/wage: $25,900 (reported on 85.5% of returns)
Here:
$25,900
State:
$42,646
(% of AGI for various income ranges: 87.2% for AGIs below $10k, 81.3% for AGIs $10k-25k, 87.8% for AGIs $25k-50k, 84.7% for AGIs $50k-75k, 81.6% for AGIs $75k-100k, 70.5% for AGIs over 100k)
Taxable interest for individuals: $1,269 (reported on 32.4% of returns)
This zip code:
$1,269
Pennsylvania:
$1,657
(% of AGI for various income ranges: 2.7% for AGIs below $10k, 1.7% for AGIs $10k-25k, 1.1% for AGIs $25k-50k, 1.5% for AGIs $50k-75k, 1.6% for AGIs $75k-100k, 2.4% for AGIs over 100k)
Taxable dividends: $1,257 (reported on 15.0% of returns)
Here:
$1,257
State:
$3,566
(% of AGI for various income ranges: 1.3% for AGIs below $10k, 0.7% for AGIs $10k-25k, 0.5% for AGIs $25k-50k, 0.6% for AGIs $50k-75k, 1.1% for AGIs $75k-100k, 0.9% for AGIs over 100k)
Net capital gain/loss: +$2,549 (reported on 10.1% of returns)
Here:
+$2,549
State:
+$9,716
(% of AGI for various income ranges: -0.7% for AGIs below $10k, 0.2% for AGIs $10k-25k, 0.3% for AGIs $25k-50k, 0.4% for AGIs $50k-75k, 0.7% for AGIs $75k-100k, 7.7% for AGIs over 100k)
Profit/loss from business: +$6,311 (reported on 8.8% of returns)
Here:
+$6,311
State:
+$14,267
(% of AGI for various income ranges: 6.8% for AGIs below $10k, 2.7% for AGIs $10k-25k, 1.2% for AGIs $25k-50k, 2.3% for AGIs $50k-75k, 3.0% for AGIs $75k-100k, 0.7% for AGIs over 100k)
IRA payment deduction: $1,903 (reported on 2.1% of returns)
15224:
$1,903
Pennsylvania:
$2,903
Total itemized deductions: $12,196 (22% of AGI, reported on 13.0% of returns)
Here:
$12,196
State:
$18,804
Here:
22.0% of AGI
State:
19.5% of AGI
(% of AGI for various income ranges: 3.0% for AGIs below $10k, 2.5% for AGIs $10k-25k, 5.3% for AGIs $25k-50k, 8.7% for AGIs $50k-75k, 9.8% for AGIs $75k-100k, 9.9% for AGIs over 100k)
Charity contributions deductions: $2,079 (4% of AGI, reported on 10.2% of returns)
Here:
$2,079
State:
$3,337
Here:
3.5% of AGI
State:
3.3% of AGI
(% of AGI for various income ranges: 0.2% for AGIs below $10k, 0.3% for AGIs $10k-25k, 0.6% for AGIs $25k-50k, 1.4% for AGIs $50k-75k, 1.5% for AGIs $75k-100k, 1.3% for AGIs over 100k)
Total tax: $3,271 (reported on 70.1% of returns)
15224:
$3,271
State:
$8,008
(% of AGI for various income ranges: 2.0% for AGIs below $10k, 4.4% for AGIs $10k-25k, 8.0% for AGIs $25k-50k, 10.8% for AGIs $50k-75k, 12.8% for AGIs $75k-100k, 16.7% for AGIs over 100k)
Earned income credit: $1,638 (reported on 21.3% of returns)
Here:
$1,638
State:
$1,643
Percentage of individuals using paid preparers for their 2004 taxes: 47.9%
Here:
48%
State:
56%
(% for various income ranges: 45.3% for AGIs below $10k, 49.2% for AGIs $10k-25k, 45.9% for AGIs $25k-50k, 51.2% for AGIs $50k-75k, 51.4% for AGIs $75k-100k, 64.8% for AGIs over 100k)
Likely homosexual households (counted as self-reported same-sex unmarried-partner households)
Lesbian couples: 0.3% of all households
Gay men: 0.6% of all households
Household received Food Stamps/SNAP in the past 12 months: 831 Household did not receive Food Stamps/SNAP in the past 12 months: 4,911
Women who had a birth in the past 12 months: 142 (93 now married, 47 unmarried) Women who did not have a birth in the past 12 months: 3,120 (751 now married, 2,386 unmarried)
Housing units in zip code 15224 with a mortgage: 1,354 (157 second mortgage, 125 both second mortgage and home equity loan) Houses without a mortgage: 81
Median monthly owner costs for units with a mortgage: $1,384 Median monthly owner costs for units without a mortgage: $529
Residents with income below the poverty level in 2022:
This zip code:
14.1%
Whole state:
11.8%
Residents with income below 50% of the poverty level in 2022:
This zip code:
6.8%
Whole state:
6.1%
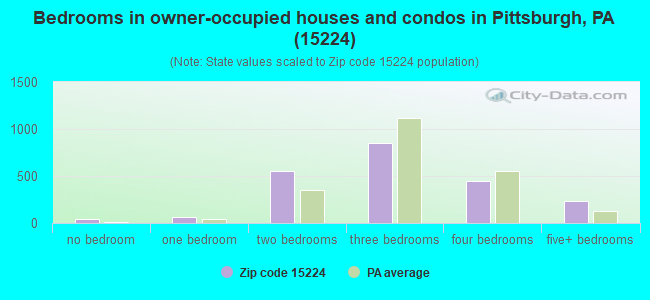
Median number of rooms in houses and condos:
Here:
6.4
State:
6.8
Median number of rooms in apartments:
Here:
4.0
State:
4.3
Notable locations in this zip code not listed on our city pages
Notable locations in zip code 15224: Allegheny County Health Department (A), Pittsburgh Bureau of Fire Station 6 (B), Fort Pitt Elementary School Library (C), Its A Small World Day Care Center (D), Little Angels Child Care and Learning Center (E), Woolslair Elementary School Library (F). Display/hide their locations on the map
Churches in zip code 15224 include: Immaculate Conception Church (A), Unity Center of Pittsburgh (B), Redeemer Church (C), Morningside Church of God In Christ (D), Morningside Baptist Church (E), Evaline Lutheran Church (F), East End Assembly of God Church (G), King of Kings Baptist Ministries (H). Display/hide their locations on the map
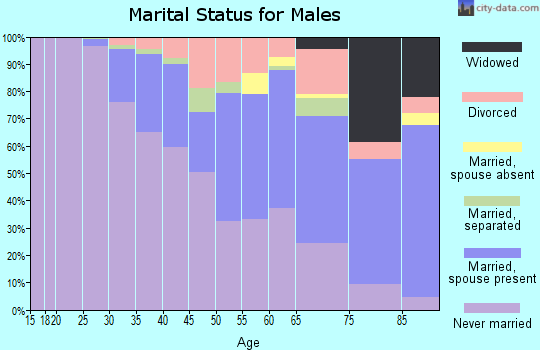
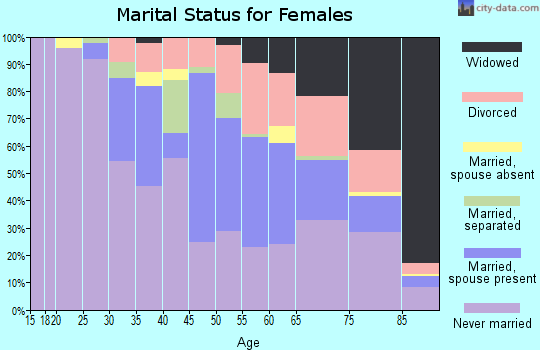
666 married couples with children.
385 single-parent households (40 men, 345 women).
89.0% of residents of 15224 zip code speak English at home.
4.1% of residents speak Spanish at home (67% very well, 8% well, 17% not well, 9% not at all).
3.6% of residents speak other Indo-European language at home (69% very well, 19% well, 12% not well).
2.7% of residents speak Asian or Pacific Island language at home (78% very well, 13% well, 10% not well).
0.2% of residents speak other language at home (100% very well).
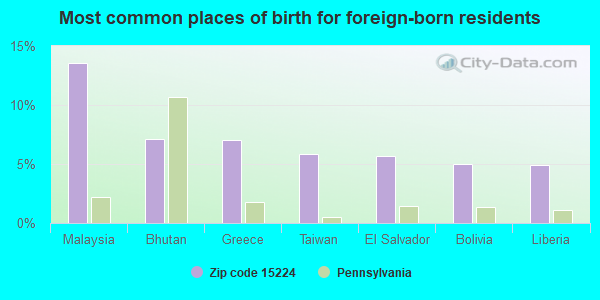
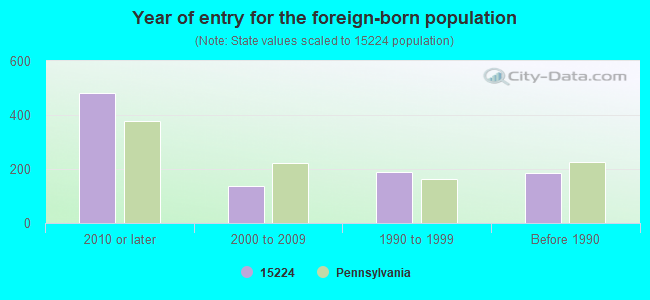
Foreign born population: 855 (7.9%) (47.4% of them are naturalized citizens)
Facilities with environmental interests located in this zip code:
ALLEN DON CHEVROLET (5315 BAUM BLVD in PITTSBURGH, PA)
STATE MASTER (Pennsylvania database) - RCRIS-PAD004503579, HAZARDOUS WASTE PROGRAM Small Quantity Generators, between 100 kg and 1000 kg of hazardous waste/month (Resource Conservation and Recovery Act (tracking hazardous waste)) - notification Organizations: OPERNAME (CONTACT/OPERATOR)
, ALLEN, DON CHEVROLET CO (CONTACT/OWNER)
ALLEGHENY SOLVENTS & CHEMICALS (PARKWAY WEST in PITTSBURGH, PA)
(Integrated Compliance Information System) - ICIS-03-1986-0523, FORMAL ENFORCEMENT ACTION
BEARING SERVICE CO (500 DARGAN ST in PITTSBURGH, PA)
AIR MINOR (AIRS/AFS) Conditionally Exempt Small Quantity Generators, less than 100 kg/month of hazardous waste (Resource Conservation and Recovery Act (tracking hazardous waste)) - notification TRI REPORTER (Tracking of toxic chemicals releasing facilities) Business SIC classification: BALL AND ROLLER BEARINGS Business NAICS classification: BALL AND ROLLER BEARING MANUFACTURING. Organizations: OPERNAME (CONTACT/OPERATOR)
, JACOB W BANKS (CONTACT/OWNER)
Alternative names: BEARING SVC MANUFACTURING
ACCESS SERVICES UNLIMITED (4801 PENN AVE in PITTSBURGH, PA)
AIR MINOR (AIRS/AFS) Business SIC classification: GASOLINE SERVICE STATIONS
ALLEY WAY SERVICE & REPAIR INC (5174 WOODWORTH ST in PITTSBURGH, PA)
Conditionally Exempt Small Quantity Generators, less than 100 kg/month of hazardous waste (Resource Conservation and Recovery Act (tracking hazardous waste)) - notification Organizations: OPERNAME (CONTACT/OPERATOR)
, BARRY KENNETH SR (CONTACT/OWNER)
Alternative names: ALLEY WAY SVC REPAIR
ALLEN DON MAZDA (5223 LIBERTY AVE in PITTSBURGH, PA)
Small Quantity Generators, between 100 kg and 1000 kg of hazardous waste/month (Resource Conservation and Recovery Act (tracking hazardous waste)) - notification Organizations: VOELKER RICHARD (CONTACT/OWNER)
B&M AUTOMOTIVE SVCS (4225 MAIN ST in PITTSBURGH, PA)
Small Quantity Generators, between 100 kg and 1000 kg of hazardous waste/month (Resource Conservation and Recovery Act (tracking hazardous waste)) - notification Organizations: MCQUAIDE MARK (CONTACT/OWNER)
Housing units lacking complete plumbing facilities: 1.7% Housing units lacking complete kitchen facilities: 2.2%
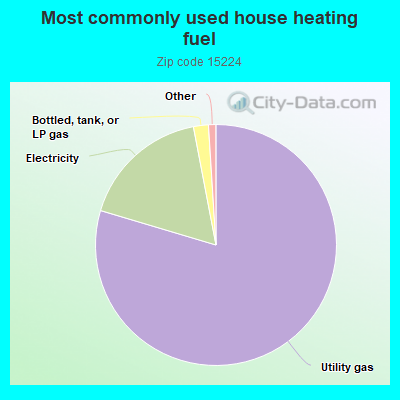
79.7%Utility gas
17.4%Electricity
2.0%Bottled, tank, or LP gas
Population in 1990: 14,742.
Place of birth for U.S.-born residents:
This state: 7,331
Northeast: 849
Midwest: 582
South: 714
West: 436
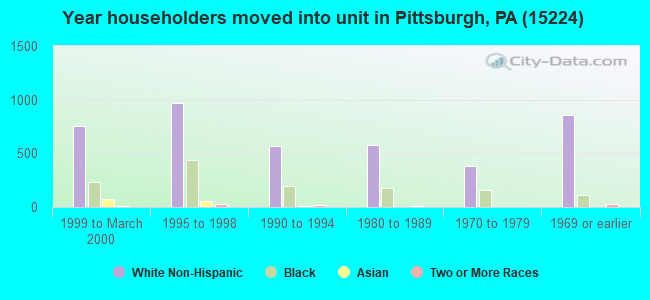
59% of the 15224 zip code residents lived in the same house 5 years ago. Out of people who lived in different houses, 75% lived in this county. Out of people who lived in different counties, 50% lived in Pennsylvania.
86% of the 15224 zip code residents lived in the same house 1 year ago. Out of people who lived in different houses, 65% moved from this county. Out of people who lived in different houses, 5% moved from different county within same state. Out of people who lived in different houses, 24% moved from different state. Out of people who lived in different houses, 4% moved from abroad.
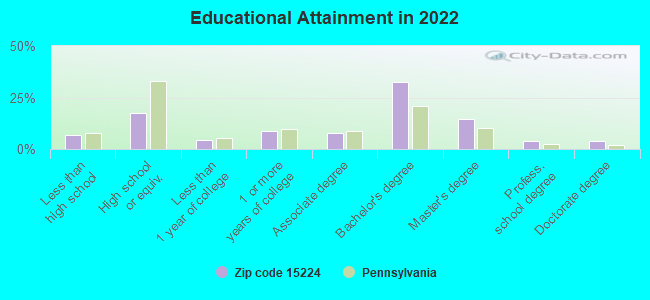
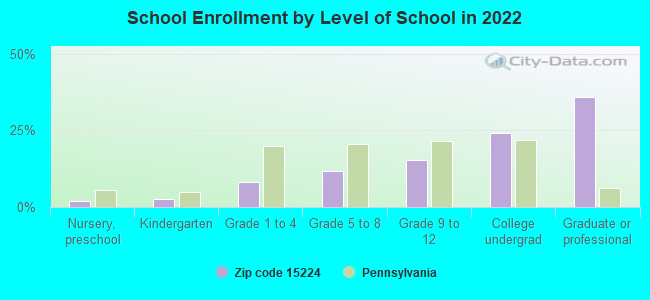
Private vs. public school enrollment:
Students in private schools in grades 1 to 8 (elementary and middle school): 136
Here:
34.0%
Pennsylvania:
15.7%
Students in private schools in grades 9 to 12 (high school): 163
Here:
54.1%
Pennsylvania:
13.4%
Students in private undergraduate colleges: 162
Here:
34.3%
Pennsylvania:
39.8%
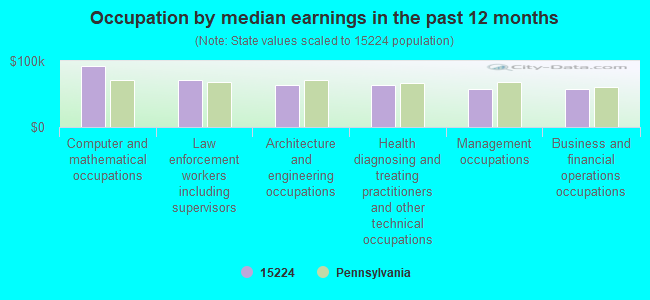
Occupation by median earnings in the past 12 months ($)
91,996Computer and mathematical occupations
71,860Law enforcement workers including supervisors
63,500Architecture and engineering occupations
63,028Health diagnosing and treating practitioners and other technical occupations
57,852Management occupations
57,156Business and financial operations occupations
Companies with federal contracts located in this zip code (PITTSBURGH, PA):
AIRPORT INDUSTRIAL PARK, INC. (4420 LORIGAN ST; small business) : $1,249,888 in 4 contractsfrom 2000 to 2006
$1,800,000 with U.S. Army Corps of Engineers - civil program financing only for Maintenance, Repair or Alteration of Real Property -- Other Conservation and Development Facilities. Signed on 2000-04-14. Completion date: 2001-05-16.
$192,774, same as above.Signed on 2001-09-28. Completion date: 2000-02-15.
$0 with Army for Maintenance, Repair or Alteration of Real Property -- Other Conservation and Development Facilities. Signed on 2006-05-10. Completion date: 2006-05-10.
-$742,886 with U.S. Army Corps of Engineers - civil program financing only for Maintenance, Repair or Alteration of Real Property -- Other Conservation and Development Facilities. Signed on 2001-06-27. Completion date: 2000-02-15.
PARK PLACE STUDIO, INC (4801 PENN AVENUE REAR; small business) : $161,233 in 2 contractsfrom 2000 to 2001
$97,633 with Air Force for Sound Recording and Reproducing Equipment. Signed on 2000-09-29. Completion date: 2001-01-15.
$63,600 with Army for Miscellaneous Prefabricated Structures. Signed on 2001-09-22. Completion date: 2002-01-11.
INGMAR MEDICAL LTD (4719 LIBERTY AVE STE 2; small business) : $45,097 in 3 contractsfrom 2003 to 2006
$32,850 with National Institute of Standards and Technology for Laboratory Equipment and Supplies. Signed on 2006-08-18. Completion date: 2006-10-16.
$7,978 with Air Force for Medical and Surgical Instruments, Equipment, and Supplies. Signed on 2005-10-26. Completion date: 2005-12-23.
$4,269 with Navy for X-Ray Equipment and Supplies: Medical, Dental, Veterinary. Taking place in CA. Signed on 2003-08-27. Completion date: 2003-10-10.
METRO FINISHING INC (4312 MAIN ST; small business)
$4,364 with Navy for Miscellaneous Materials Handling Equipment. Signed on 2004-09-10. Completion date: 2004-09-24.
Top industries in this zip code by the number of employees in 2005:
Health Care and Social Assistance: General Medical and Surgical Hospitals (over 1000 employees: 1 establishment)
Health Care and Social Assistance: Offices of Physicians (except Mental Health Specialists) (20-49: 6, 10-19: 9, 5-9: 23, 1-4: 29)
2004 - 2018 National Fire Incident Reporting System (NFIRS) incidents
Based on the data from the years 2004 - 2018 the average number of fires per year is 20. The highest number of fire incidents - 47 took place in 2006, and the least - 0 in 2012. The data has a rising trend.
When looking into fire subcategories, the most reports belonged to: Outside Fires (46.0%), and Structure Fires (35.9%).
Fire incident types reported to NFIRS in Zip Code 15224

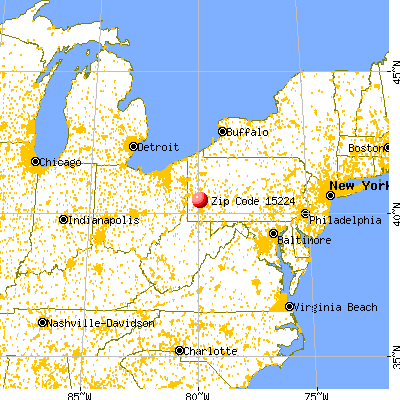


 Nearest zip codes: 15201, 15232, 15260, 15213, 15206, 15217.


 Based on the data from the years 2004 - 2018 the average number of fires per year is 20. The highest number of fire incidents - 47 took place in 2006, and the least - 0 in 2012. The data has a rising trend.
 When looking into fire subcategories, the most reports belonged to: Outside Fires (46.0%), and Structure Fires (35.9%).