Estimated zip code population in 2022: 3,966 Zip code population in 2010: 3,579 Zip code population in 2000: 3,706
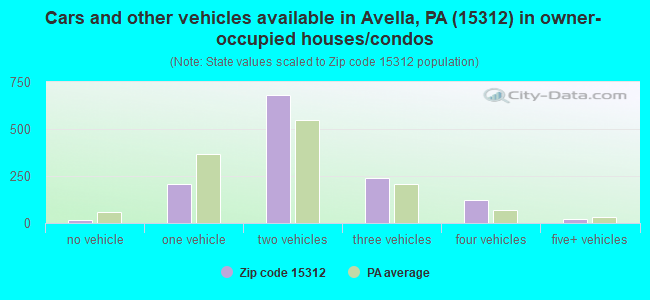
Houses and condos: 1,831 Renter-occupied apartments: 298
% of renters here:
19%
State:
31%
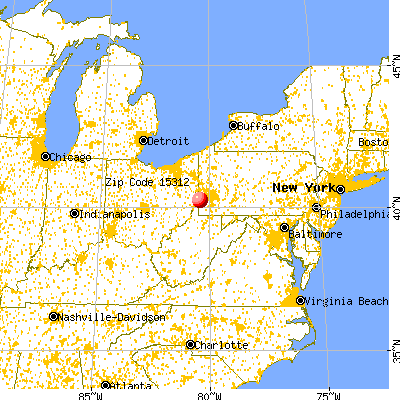
March 2022 cost of living index in zip code 15312: 88.6 (less than average, U.S. average is 100)
Land area: 75.0 sq. mi. Water area: 0.0 sq. mi.
Population density: 53 people per square mile
(very low).
OSM Map
General Map
Google Map
MSN Map
OSM Map
General Map
Google Map
MSN Map
OSM Map
General Map
Google Map
MSN Map
OSM Map
General Map
Google Map
MSN Map
Please wait while loading the map...
Real estate property taxes paid for housing units in 2022:
This zip code:
0.8% ($1,638)
Pennsylvania:
1.3% ($3,094)
Median real estate property taxes paid for housing units with mortgages in 2022: $1,769 (0.7%) Median real estate property taxes paid for housing units with no mortgage in 2022: $1,549 (0.9%)
Business Search- 14 Million verified businesses
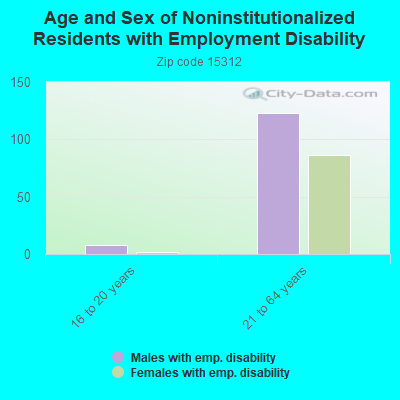
Males: 2,005
(50.6%)
Females: 1,961
(49.4%)
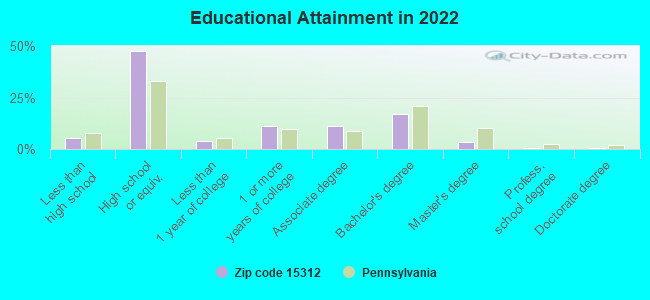
For population 25 years and over in 15312:
High school or higher: 94.1%
Bachelor's degree or higher: 20.8%
Graduate or professional degree: 4.1%
Unemployed: 9.5%
Mean travel time to work (commute): 34.8 minutes
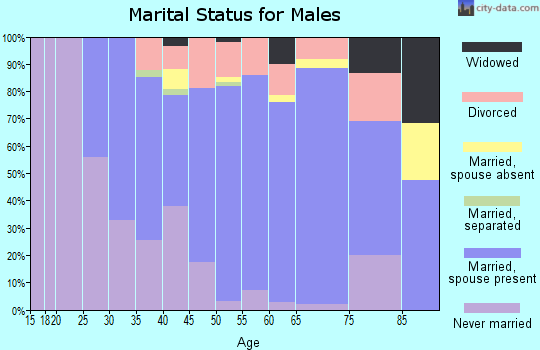
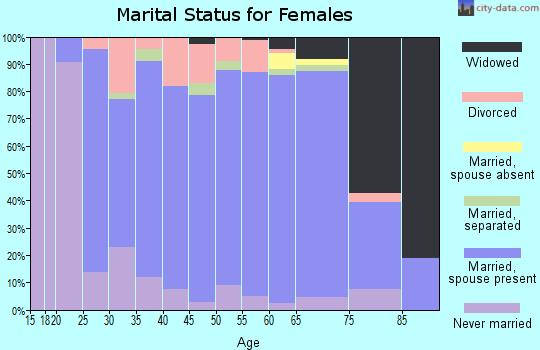
For population 15 years and over in 15312:
Never married: 29.5%
Now married: 54.2%
Separated: 1.5%
Widowed: 4.3%
Divorced: 10.5%
Zip code 15312 compared to state average:
Unemployed percentage above state average.
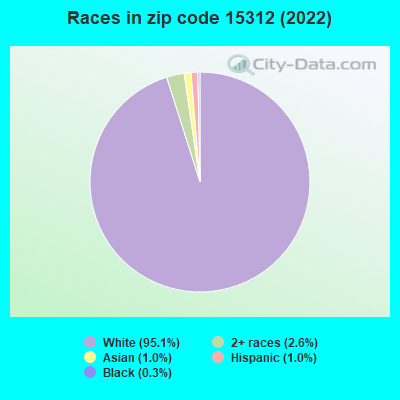
Black race population percentage significantly below state average.
Hispanic race population percentage significantly below state average.
Foreign-born population percentage significantly below state average.
Renting percentage below state average.
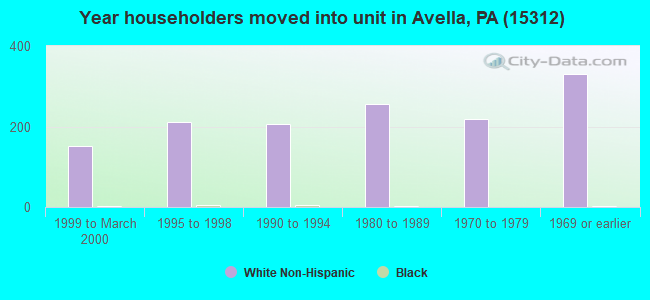
Length of stay since moving in significantly above state average.
Number of college students below state average.
Percentage of population with a bachelor's degree or higher below state average.
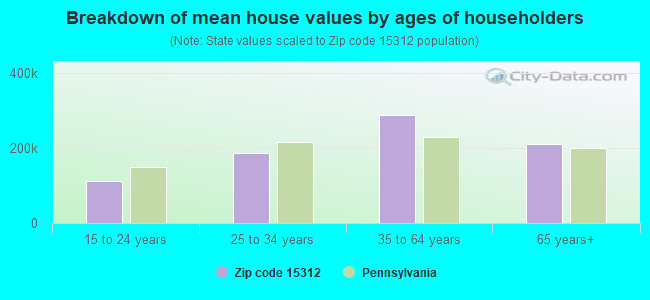
Estimated median house/condo value in 2022: $208,708
15312:
$208,708
Pennsylvania:
$245,500
According to our research of Pennsylvania and other state lists, there were 2 registered sex offenders living in 15312 zip code as of April 25, 2024. The ratio of all residents to sex offenders in zip code 15312 is 1,871 to 1. The ratio of registered sex offenders to all residents in this zip code is much lower than the state average.
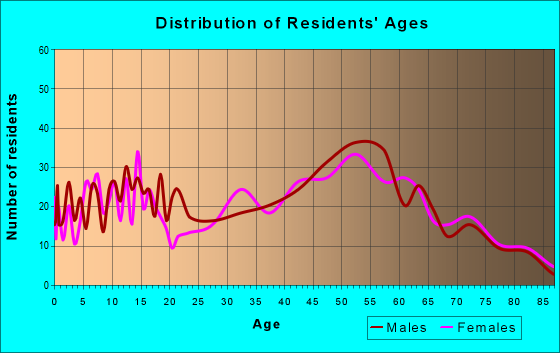
Median resident age:
This zip code:
40.8 years
Pennsylvania median age:
40.9 years
Average household size:
This zip code:
2.5 people
Pennsylvania:
2.4 people
Averages for the 2020 tax year for zip code 15312, filed in 2021:
Average Adjusted Gross Income (AGI) in 2020: $63,360 (Individual Income Tax Returns)
Here:
$63,360
State:
$75,707
Salary/wage: $53,518 (reported on 76.7% of returns)
Here:
$53,518
State:
$62,806
(% of AGI for various income ranges: 968.4% for AGIs below $25k, 3356.5% for AGIs $25k-50k, 6060.5% for AGIs $50k-75k, 9190.0% for AGIs $75k-100k, 14070.0% for AGIs $100k-200k)
Taxable interest for individuals: $1,135 (reported on 36.6% of returns)
This zip code:
$1,135
Pennsylvania:
$1,633
(% of AGI for various income ranges: 29.0% for AGIs below $25k, 36.5% for AGIs $25k-50k, 35.0% for AGIs $50k-75k, 67.7% for AGIs $75k-100k, 45.0% for AGIs $100k-200k)
Ordinary dividends: $2,609 (reported on 20.3% of returns)
Here:
$2,609
State:
$7,382
(% of AGI for various income ranges: 32.6% for AGIs below $25k, 35.8% for AGIs $25k-50k, 40.5% for AGIs $50k-75k, 100.0% for AGIs $75k-100k, 155.6% for AGIs $100k-200k)
Net capital gain/loss in AGI: +$6,963 (reported on 17.4% of returns)
Here:
+$6,963
State:
+$23,522
(% of AGI for various income ranges: 21.0% for AGIs below $25k, 22.9% for AGIs $25k-50k, 61.0% for AGIs $50k-75k, 199.2% for AGIs $75k-100k, 410.0% for AGIs $100k-200k)
Profit/loss from business: +$8,621 (reported on 11.0% of returns)
Here:
+$8,621
State:
+$16,274
(% of AGI for various income ranges: 49.0% for AGIs below $25k, 81.0% for AGIs $25k-50k, 200.5% for AGIs $50k-75k, 214.6% for AGIs $75k-100k, 308.3% for AGIs $100k-200k)
Taxable individual retirement arrangement distribution: $15,406 (reported on 10.5% of returns)
15312:
$15,406
Pennsylvania:
$18,583
(% of AGI for various income ranges: 95.8% for AGIs below $25k, 149.7% for AGIs $25k-50k, 147.5% for AGIs $50k-75k, 286.9% for AGIs $75k-100k, 746.7% for AGIs $100k-200k)
Total itemized deductions: $32,925 (reported on 2.3% of returns)
Here:
$32,925
State:
$34,850
(% of AGI for various income ranges: 731.7% for AGIs $100k-200k)
Charity contributions: $3,533 (reported on 1.7% of returns)
Here:
$3,533
State:
$12,392
(% of AGI for various income ranges: 81.5% for AGIs $75k-100k)
Taxes paid: $6,260 (reported on 2.9% of returns)
15312:
$6,260
State:
$8,200
(% of AGI for various income ranges: 38.1% for AGIs $25k-50k, 108.3% for AGIs $100k-200k)
Earned income credit: $1,800 (reported on 10.5% of returns)
Here:
$1,800
State:
$2,100
(% of AGI for various income ranges: 57.7% for AGIs below $25k, 46.8% for AGIs $25k-50k)
Percentage of individuals using paid preparers for their 2020 taxes: 92.4%
Here:
92%
State:
92%
(% for various income ranges: 90.0% for AGIs below $25k, 92.9% for AGIs $25k-50k, 93.1% for AGIs $50k-75k, 94.7% for AGIs $75k-100k, 92.6% for AGIs $100k-200k, 100.0% for AGIs over 200k)
Averages for the 2012 tax year for zip code 15312, filed in 2013:
Average Adjusted Gross Income (AGI) in 2012: $65,797 (Individual Income Tax Returns)
Here:
$65,797
State:
$61,346
Salary/wage: $48,199 (reported on 82.0% of returns)
Here:
$48,199
State:
$51,902
(% of AGI for various income ranges: 66.2% for AGIs below $25k, 72.6% for AGIs $25k-50k, 77.0% for AGIs $50k-75k, 74.2% for AGIs $75k-100k, 67.6% for AGIs $100k-200k, 23.5% for AGIs over 200k)
Taxable interest for individuals: $975 (reported on 41.3% of returns)
This zip code:
$975
Pennsylvania:
$1,588
(% of AGI for various income ranges: 1.7% for AGIs below $25k, 0.9% for AGIs $25k-50k, 0.4% for AGIs $50k-75k, 0.3% for AGIs $75k-100k, 0.8% for AGIs $100k-200k, 0.3% for AGIs over 200k)
Ordinary dividends: $2,169 (reported on 20.9% of returns)
Here:
$2,169
State:
$5,827
(% of AGI for various income ranges: 1.1% for AGIs below $25k, 0.9% for AGIs $25k-50k, 0.3% for AGIs $50k-75k, 0.5% for AGIs $75k-100k, 0.6% for AGIs $100k-200k, 1.1% for AGIs over 200k)
Net capital gain/loss in AGI: +$14,192 (reported on 14.0% of returns)
Here:
+$14,192
State:
+$14,495
(% of AGI for various income ranges: 1.4% for AGIs below $25k, 2.8% for AGIs $50k-75k, 0.4% for AGIs $75k-100k, 5.2% for AGIs $100k-200k, 6.0% for AGIs over 200k)
Profit/loss from business: +$10,690 (reported on 12.2% of returns)
Here:
+$10,690
State:
+$16,268
(% of AGI for various income ranges: 4.0% for AGIs below $25k, 2.5% for AGIs $25k-50k, 3.6% for AGIs $50k-75k, 1.5% for AGIs $75k-100k, 2.5% for AGIs $100k-200k)
Taxable individual retirement arrangement distribution: $12,835 (reported on 9.9% of returns)
15312:
$12,835
Pennsylvania:
$14,550
(% of AGI for various income ranges: 2.3% for AGIs below $25k, 2.4% for AGIs $25k-50k, 2.0% for AGIs $50k-75k, 1.3% for AGIs $75k-100k, 3.6% for AGIs $100k-200k)
Total itemized deductions: $19,895 (15% of AGI, reported on 25.0% of returns)
Here:
$19,895
State:
$23,538
Here:
14.7% of AGI
State:
18.4% of AGI
(% of AGI for various income ranges: 7.9% for AGIs $25k-50k, 6.7% for AGIs $50k-75k, 9.0% for AGIs $75k-100k, 9.6% for AGIs $100k-200k, 6.3% for AGIs over 200k)
Charity contributions: $3,100 (reported on 17.4% of returns)
Here:
$3,100
State:
$4,025
(% of AGI for various income ranges: 0.7% for AGIs $25k-50k, 0.8% for AGIs $50k-75k, 0.7% for AGIs $75k-100k, 1.1% for AGIs $100k-200k, 0.8% for AGIs over 200k)
Taxes paid: $7,651 (reported on 25.0% of returns)
15312:
$7,651
State:
$9,982
(% of AGI for various income ranges: 1.7% for AGIs $25k-50k, 1.9% for AGIs $50k-75k, 2.5% for AGIs $75k-100k, 3.9% for AGIs $100k-200k, 4.0% for AGIs over 200k)
Earned income credit: $2,105 (reported on 11.0% of returns)
Here:
$2,105
State:
$2,106
(% of AGI for various income ranges: 4.4% for AGIs below $25k, 0.8% for AGIs $25k-50k)
Percentage of individuals using paid preparers for their 2012 taxes: 59.9%
Here:
60%
State:
53%
(% for various income ranges: 55.4% for AGIs below $25k, 55.0% for AGIs $25k-50k, 61.5% for AGIs $50k-75k, 61.9% for AGIs $75k-100k, 69.6% for AGIs $100k-200k, 83.3% for AGIs over 200k)
Averages for the 2004 tax year for zip code 15312, filed in 2005:
Average Adjusted Gross Income (AGI) in 2004: $37,694 (Individual Income Tax Returns)
Here:
$37,694
State:
$48,049
Salary/wage: $36,423 (reported on 82.8% of returns)
Here:
$36,423
State:
$42,646
(% of AGI for various income ranges: 128.1% for AGIs below $10k, 67.6% for AGIs $10k-25k, 82.8% for AGIs $25k-50k, 84.1% for AGIs $50k-75k, 84.4% for AGIs $75k-100k, 69.7% for AGIs over 100k)
Taxable interest for individuals: $1,048 (reported on 49.9% of returns)
This zip code:
$1,048
Pennsylvania:
$1,657
(% of AGI for various income ranges: 7.3% for AGIs below $10k, 2.8% for AGIs $10k-25k, 1.4% for AGIs $25k-50k, 0.7% for AGIs $50k-75k, 1.9% for AGIs $75k-100k, 0.5% for AGIs over 100k)
Taxable dividends: $1,520 (reported on 23.3% of returns)
Here:
$1,520
State:
$3,566
(% of AGI for various income ranges: 4.2% for AGIs below $10k, 0.9% for AGIs $10k-25k, 0.8% for AGIs $25k-50k, 0.3% for AGIs $50k-75k, 0.5% for AGIs $75k-100k, 2.2% for AGIs over 100k)
Net capital gain/loss: +$4,736 (reported on 15.2% of returns)
Here:
+$4,736
State:
+$9,716
(% of AGI for various income ranges: 1.8% for AGIs below $10k, -0.2% for AGIs $10k-25k, 0.7% for AGIs $25k-50k, 0.4% for AGIs $50k-75k, 1.6% for AGIs $75k-100k, 7.5% for AGIs over 100k)
Profit/loss from business: +$9,243 (reported on 12.5% of returns)
Here:
+$9,243
State:
+$14,267
(% of AGI for various income ranges: 13.1% for AGIs below $10k, 4.8% for AGIs $10k-25k, 3.3% for AGIs $25k-50k, 2.9% for AGIs $50k-75k, 4.4% for AGIs $75k-100k, -0.3% for AGIs over 100k)
IRA payment deduction: $2,419 (reported on 2.5% of returns)
15312:
$2,419
Pennsylvania:
$2,903
Total itemized deductions: $15,053 (21% of AGI, reported on 23.3% of returns)
Here:
$15,053
State:
$18,804
Here:
21.2% of AGI
State:
19.5% of AGI
(% of AGI for various income ranges: 6.0% for AGIs $10k-25k, 6.8% for AGIs $25k-50k, 11.7% for AGIs $50k-75k, 11.5% for AGIs $75k-100k, 10.3% for AGIs over 100k)
Charity contributions deductions: $2,037 (3% of AGI, reported on 19.0% of returns)
Here:
$2,037
State:
$3,337
Here:
2.7% of AGI
State:
3.3% of AGI
(% of AGI for various income ranges: 0.6% for AGIs $10k-25k, 0.7% for AGIs $25k-50k, 1.1% for AGIs $50k-75k, 0.8% for AGIs $75k-100k, 1.9% for AGIs over 100k)
Total tax: $4,791 (reported on 74.3% of returns)
15312:
$4,791
State:
$8,008
(% of AGI for various income ranges: 3.5% for AGIs below $10k, 4.0% for AGIs $10k-25k, 7.0% for AGIs $25k-50k, 8.4% for AGIs $50k-75k, 10.5% for AGIs $75k-100k, 17.5% for AGIs over 100k)
Earned income credit: $1,784 (reported on 13.0% of returns)
Here:
$1,784
State:
$1,643
Percentage of individuals using paid preparers for their 2004 taxes: 61.4%
Here:
61%
State:
56%
(% for various income ranges: 56.1% for AGIs below $10k, 61.2% for AGIs $10k-25k, 61.2% for AGIs $25k-50k, 63.8% for AGIs $50k-75k, 66.4% for AGIs $75k-100k, 70.3% for AGIs over 100k)
Likely homosexual households (counted as self-reported same-sex unmarried-partner households)
Lesbian couples: 0.0% of all households
Gay men: 0.2% of all households
Household received Food Stamps/SNAP in the past 12 months: 226 Household did not receive Food Stamps/SNAP in the past 12 months: 1,362
Women who had a birth in the past 12 months: 73 (19 now married, 47 unmarried) Women who did not have a birth in the past 12 months: 784 (370 now married, 412 unmarried)
Housing units in zip code 15312 with a mortgage: 639 (55 second mortgage, 45 both second mortgage and home equity loan) Houses without a mortgage: 42
Median monthly owner costs for units with a mortgage: $1,365 Median monthly owner costs for units without a mortgage: $478
Residents with income below the poverty level in 2022:
This zip code:
10.8%
Whole state:
11.8%
Residents with income below 50% of the poverty level in 2022:
This zip code:
7.6%
Whole state:
6.1%
Median number of rooms in houses and condos:
Here:
6.4
State:
6.8
Median number of rooms in apartments:
Here:
5.4
State:
4.3
Notable locations in this zip code not listed on our city pages
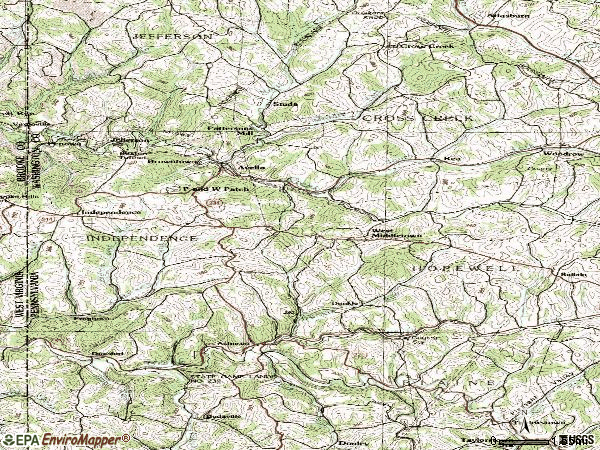
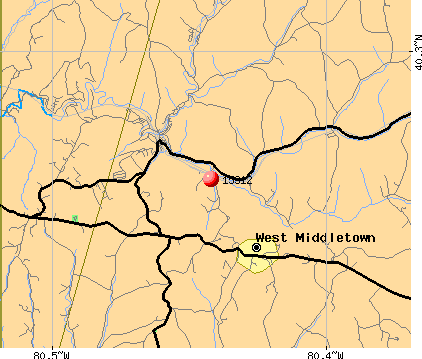
Notable locations in zip code 15312: Rea Block Field (A), Meadowcroft Rock Shelter (B), Boyd (C), Bellview Campground (D), Grand View Dairy Farm (E), Kearns Farms (F), Krajacic Farms (G), Monticello Farm (H), Rush Run Farm (I), Avella Volunteer Fire Department Station 35 (J), West Middletown Volunteer Fire Department Station 30 (K). Display/hide their locations on the map
Churches in zip code 15312 include: Lower Buffalo Church (A), Grove Church (B), Mount Calvary Church (C), Saint Johns Church (D), Bethel Church (E). Display/hide their locations on the map
Streams, rivers, and creeks: Brashears Run (A), North Fork Cross Creek (B), Dunkle Run (C), Indian Camp Run (D), Haynan Creek (E), Middle Fork Cross Creek (F), South Fork Cross Creek (G), Hanen Run (H). Display/hide their locations on the map
Parks in zip code 15312 include: Cross Creek County Park (1), State Game Lands Number 303 (2), Cross Creek County Park (3). Display/hide their locations on the map
In group quarters: 18 (-1 institutionalized population)
Size of family households: 572 2-persons, 231 3-persons, 191 4-persons, 58 5-persons, 52 6-persons, 11 7-or-more-persons
Size of nonfamily households: 364 1-person, 95 2-persons, 10 5-persons
506 married couples with children.
311 single-parent households (133 men, 178 women).
97.1% of residents of 15312 zip code speak English at home.
0.5% of residents speak Spanish at home (50% very well, 25% well, 25% not well).
1.6% of residents speak other Indo-European language at home (86% very well, 5% well, 8% not well).
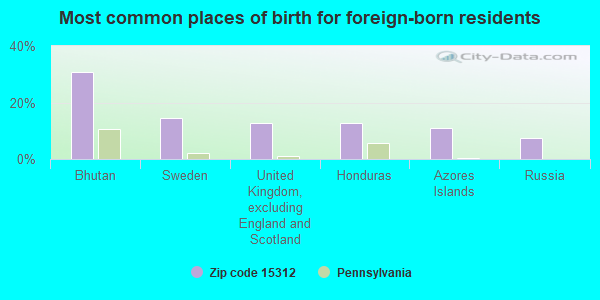
Foreign born population: 55 (1.4%) (70.7% of them are naturalized citizens)
This zip code:
1.4%
Whole state:
7.5%
31%Bhutan
15%Sweden
13%United Kingdom, excluding England and Scotland
13%Honduras
11%Azores Islands
7%Russia
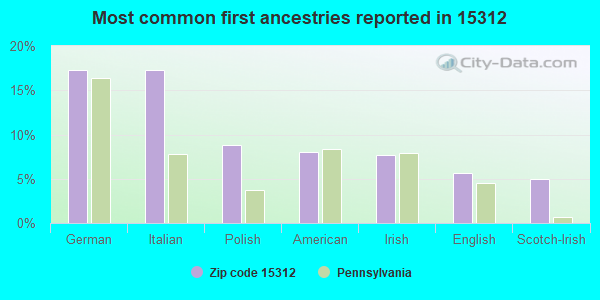
17%German
17%Italian
9%Polish
8%American
8%Irish
6%English
5%Scotch-Irish
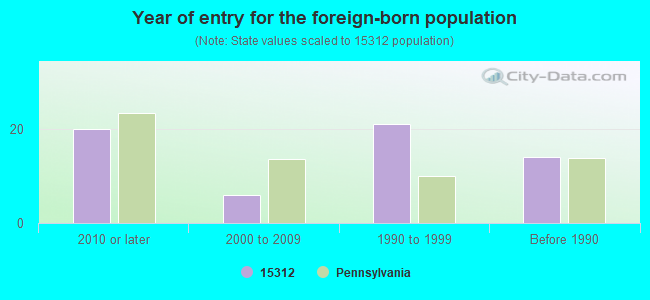
Year of entry for the foreign-born population
202010 or later
62000 to 2009
211990 to 1999
14Before 1990
Facilities with environmental interests located in this zip code:
AVELLA ELEM & HIGH SCH (1000 AVELLA RD in AVELLA, PA)
AIR MINOR (AIRS/AFS) STATE MASTER (Pennsylvania database) - PCS-PA0029971, National Pollutant Discharge Elimination System Permit, PWSID-5630313, DRINKING WATER PROGRAM National Pollutant Discharge Elimination System NON-MAJOR (Tracking pollutant discharge elimination systems) - permit Business SIC classification: ELEMENTARY AND SECONDARY SCHOOLS Organizations: AVELLA AREA SCHOOL DISTRICT (CONTACT/OWNER)
Alternative names: AVELLA AREA SCHOOL DIST, AVELLA AREA SCH DIST/AVELLA ELEM SCH, AVELLA AREA SCHOOL DISTRICT, AVELLA ELEMEMTARY SCHOOL
AVELLA AREA JSHS ( in AVELLA, PA)
(National Center for Education Statistics) - STATE ID-4165 Organizations: AVELLA AREA SD (SCHOOL DISTRICT)
AVELLA EL CENTER ( in AVELLA, PA)
(National Center for Education Statistics) - STATE ID-7098 Organizations: AVELLA AREA SD (SCHOOL DISTRICT)
A C DELLOVADE INC WAREHOUSE (27 CLARK AVE in AVELLA, PA)
Conditionally Exempt Small Quantity Generators, less than 100 kg/month of hazardous waste (Resource Conservation and Recovery Act (tracking hazardous waste)) - notification Alternative names: AC DELLOVADE WHSE
Housing units lacking complete plumbing facilities: 1.6% Housing units lacking complete kitchen facilities: 4.2%
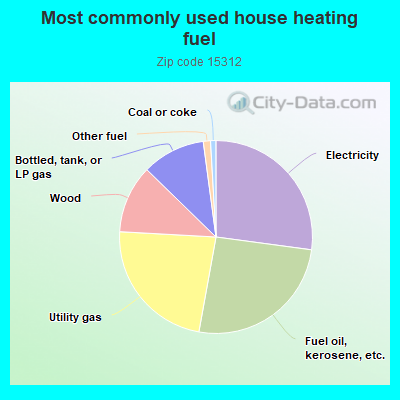
27.1%Electricity
25.7%Fuel oil, kerosene, etc.
23.0%Utility gas
11.4%Wood
10.6%Bottled, tank, or LP gas
1.2%Other fuel
0.9%Coal or coke
Population in 1990: 3,681. Population change in the 1990s: +25 (+0.7%).
Place of birth for U.S.-born residents:
This state: 3,227
Northeast: 78
Midwest: 112
South: 395
West: 71
75% of the 15312 zip code residents lived in the same house 5 years ago. Out of people who lived in different houses, 70% lived in this county. Out of people who lived in different counties, 50% lived in Pennsylvania.
96% of the 15312 zip code residents lived in the same house 1 year ago. Out of people who lived in different houses, 57% moved from this county. Out of people who lived in different houses, 32% moved from different county within same state. Out of people who lived in different houses, 16% moved from different state.
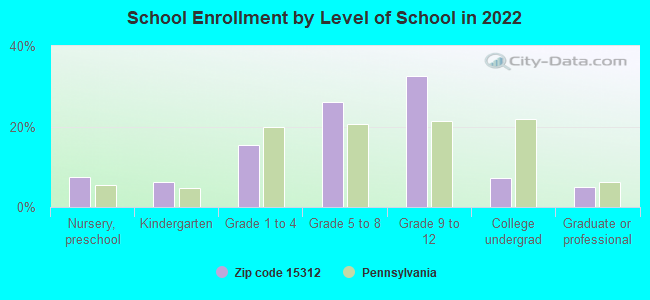
Private vs. public school enrollment:
Students in private schools in grades 1 to 8 (elementary and middle school): 43
Here:
13.0%
Pennsylvania:
15.7%
Students in private schools in grades 9 to 12 (high school):
Here:
0.0%
Pennsylvania:
13.4%
Students in private undergraduate colleges: 44
Here:
75.1%
Pennsylvania:
39.8%
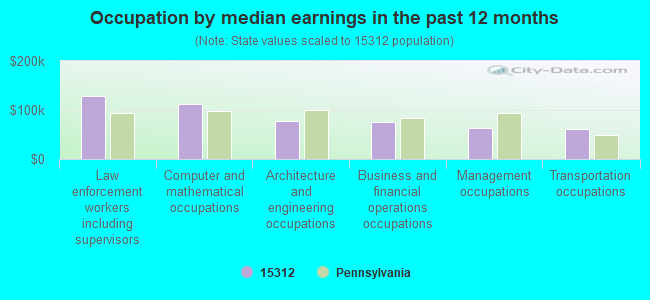
Occupation by median earnings in the past 12 months ($)
129,330Law enforcement workers including supervisors
111,827Computer and mathematical occupations
78,150Architecture and engineering occupations
74,972Business and financial operations occupations
63,433Management occupations
61,536Transportation occupations
Top industries in this zip code by the number of employees in 2005:
Other Services (except Public Administration): Coin-Operated Laundries and Drycleaners (20-49 employees: 1 establishment)
Construction: Commercial and Institutional Building Construction (20-49: 1)
Finance and Insurance: Insurance Agencies and Brokerages (20-49: 1)
Accommodation and Food Services: Full-Service Restaurants (10-19: 1, 1-4: 2)
Arts, Entertainment, and Recreation: Golf Courses and Country Clubs (10-19: 1)
Administrative and Support and Waste Management and Remediation Services: Remediation Services (10-19: 1)
Health Care and Social Assistance: Child Day Care Services (5-9: 2)
Construction: New Single-Family Housing Construction (except Operative Builders) (5-9: 1, 1-4: 1)
People in group quarters in 2010:
5 people in group homes intended for adults
Fatal accident statistics in 2014:
Fatal accident count: 2
Vehicles involved in fatal accidents: 3
Fatal accidents caused by drunken drivers: 1
Fatalities: 2
Persons involved in fatal accidents: 3
Pedestrians involved in fatal accidents: 0
Fatal accident statistics in 2013:
Fatal accident count: 1
Vehicles involved in fatal accidents: 1
Fatal accidents caused by drunken drivers: 1
Fatalities: 1
Persons involved in fatal accidents: 5
Pedestrians involved in fatal accidents: 0
Home Mortgage Disclosure Act Aggregated Statistics For Year 2009 (Based on 4 partial tracts)
A) FHA, FSA/RHS & VA Home Purchase Loans
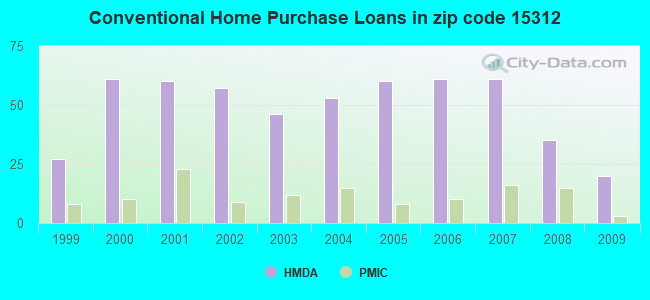
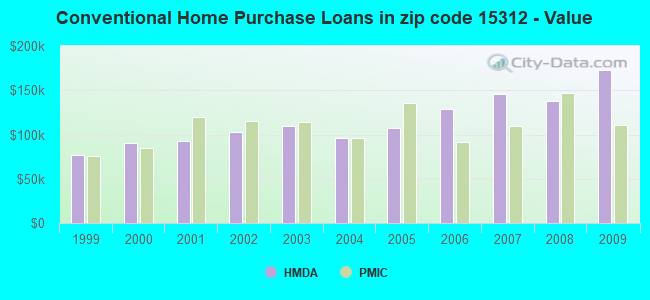
B) Conventional Home Purchase Loans
C) Refinancings
D) Home Improvement Loans
F) Non-occupant Loans on < 5 Family Dwellings (A B C & D)
G) Loans On Manufactured Home Dwelling (A B C & D)
Number
Average Value
Number
Average Value
Number
Average Value
Number
Average Value
Number
Average Value
Number
Average Value
LOANS ORIGINATED
19
$110,887
20
$172,873
120
$136,868
32
$44,638
4
$114,490
0
$0
APPLICATIONS APPROVED, NOT ACCEPTED
1
$167,470
2
$164,780
10
$191,240
1
$132,210
0
$0
0
$0
APPLICATIONS DENIED
2
$71,560
1
$160,120
66
$134,181
11
$28,236
0
$0
0
$0
APPLICATIONS WITHDRAWN
2
$66,590
3
$106,747
26
$128,962
4
$71,290
0
$0
1
$40,580
FILES CLOSED FOR INCOMPLETENESS
0
$0
0
$0
6
$213,128
0
$0
0
$0
0
$0
Aggregated Statistics For Year 2008 (Based on 4 partial tracts)
A) FHA, FSA/RHS & VA Home Purchase Loans
B) Conventional Home Purchase Loans
C) Refinancings
D) Home Improvement Loans
E) Loans on Dwellings For 5+ Families
F) Non-occupant Loans on < 5 Family Dwellings (A B C & D)
G) Loans On Manufactured Home Dwelling (A B C & D)
Number
Average Value
Number
Average Value
Number
Average Value
Number
Average Value
Number
Average Value
Number
Average Value
Number
Average Value
LOANS ORIGINATED
16
$128,131
35
$137,772
75
$109,890
31
$29,244
1
$44,070
6
$87,003
7
$76,664
APPLICATIONS APPROVED, NOT ACCEPTED
1
$170,400
2
$79,390
19
$105,478
2
$9,425
0
$0
3
$95,113
2
$55,305
APPLICATIONS DENIED
0
$0
13
$104,334
71
$127,251
41
$71,917
0
$0
5
$42,284
4
$47,200
APPLICATIONS WITHDRAWN
1
$53,150
6
$139,850
17
$130,857
2
$109,770
0
$0
2
$106,350
0
$0
FILES CLOSED FOR INCOMPLETENESS
0
$0
2
$103,130
8
$200,040
3
$30,360
0
$0
0
$0
0
$0
Aggregated Statistics For Year 2007 (Based on 4 partial tracts)
A) FHA, FSA/RHS & VA Home Purchase Loans
B) Conventional Home Purchase Loans
C) Refinancings
D) Home Improvement Loans
E) Loans on Dwellings For 5+ Families
F) Non-occupant Loans on < 5 Family Dwellings (A B C & D)
G) Loans On Manufactured Home Dwelling (A B C & D)
Number
Average Value
Number
Average Value
Number
Average Value
Number
Average Value
Number
Average Value
Number
Average Value
Number
Average Value
LOANS ORIGINATED
4
$101,430
61
$145,230
88
$104,704
40
$29,731
0
$0
6
$154,318
3
$77,317
APPLICATIONS APPROVED, NOT ACCEPTED
0
$0
10
$99,028
23
$86,538
10
$59,148
0
$0
0
$0
3
$55,293
APPLICATIONS DENIED
2
$80,950
24
$101,763
116
$126,037
48
$53,782
1
$88,140
3
$67,377
12
$65,329
APPLICATIONS WITHDRAWN
0
$0
9
$114,404
35
$114,964
3
$64,147
0
$0
0
$0
4
$110,175
FILES CLOSED FOR INCOMPLETENESS
0
$0
0
$0
12
$147,975
3
$51,903
0
$0
1
$82,260
0
$0
Aggregated Statistics For Year 2006 (Based on 4 partial tracts)
A) FHA, FSA/RHS & VA Home Purchase Loans
B) Conventional Home Purchase Loans
C) Refinancings
D) Home Improvement Loans
F) Non-occupant Loans on < 5 Family Dwellings (A B C & D)
G) Loans On Manufactured Home Dwelling (A B C & D)
Number
Average Value
Number
Average Value
Number
Average Value
Number
Average Value
Number
Average Value
Number
Average Value
LOANS ORIGINATED
8
$99,814
61
$129,236
105
$98,985
33
$29,547
3
$58,003
4
$103,470
APPLICATIONS APPROVED, NOT ACCEPTED
0
$0
6
$89,288
42
$90,675
5
$33,732
1
$33,770
2
$58,675
APPLICATIONS DENIED
0
$0
14
$109,371
136
$134,446
48
$53,424
6
$384,070
13
$51,276
APPLICATIONS WITHDRAWN
0
$0
5
$77,738
75
$116,014
3
$99,223
1
$54,450
1
$132,210
FILES CLOSED FOR INCOMPLETENESS
1
$36,730
0
$0
17
$122,649
2
$53,575
0
$0
1
$36,730
Aggregated Statistics For Year 2005 (Based on 4 partial tracts)
A) FHA, FSA/RHS & VA Home Purchase Loans
B) Conventional Home Purchase Loans
C) Refinancings
D) Home Improvement Loans
F) Non-occupant Loans on < 5 Family Dwellings (A B C & D)
G) Loans On Manufactured Home Dwelling (A B C & D)
Number
Average Value
Number
Average Value
Number
Average Value
Number
Average Value
Number
Average Value
Number
Average Value
LOANS ORIGINATED
8
$112,219
60
$107,473
141
$97,982
39
$33,011
5
$77,024
14
$94,720
APPLICATIONS APPROVED, NOT ACCEPTED
1
$102,830
11
$117,707
39
$121,646
17
$21,201
1
$1,101,750
3
$73,897
APPLICATIONS DENIED
0
$0
27
$74,153
134
$109,318
37
$25,576
11
$70,916
21
$67,937
APPLICATIONS WITHDRAWN
3
$118,990
13
$96,536
63
$130,349
15
$59,047
5
$266,764
0
$0
FILES CLOSED FOR INCOMPLETENESS
0
$0
0
$0
7
$127,373
0
$0
0
$0
0
$0
Aggregated Statistics For Year 2004 (Based on 4 partial tracts)
A) FHA, FSA/RHS & VA Home Purchase Loans
B) Conventional Home Purchase Loans
C) Refinancings
D) Home Improvement Loans
E) Loans on Dwellings For 5+ Families
F) Non-occupant Loans on < 5 Family Dwellings (A B C & D)
G) Loans On Manufactured Home Dwelling (A B C & D)
Number
Average Value
Number
Average Value
Number
Average Value
Number
Average Value
Number
Average Value
Number
Average Value
Number
Average Value
LOANS ORIGINATED
0
$0
53
$95,675
186
$93,860
52
$65,245
1
$73,450
4
$118,418
8
$256,967
APPLICATIONS APPROVED, NOT ACCEPTED
1
$139,560
7
$140,051
38
$78,817
11
$23,684
0
$0
1
$20,160
0
$0
APPLICATIONS DENIED
0
$0
7
$123,839
157
$109,963
40
$21,336
0
$0
9
$33,968
6
$85,990
APPLICATIONS WITHDRAWN
0
$0
7
$120,094
64
$103,795
4
$38,950
0
$0
1
$36,130
1
$105,770
FILES CLOSED FOR INCOMPLETENESS
0
$0
1
$54,190
29
$112,118
3
$61,920
0
$0
0
$0
1
$96,950
Aggregated Statistics For Year 2003 (Based on 4 partial tracts)
A) FHA, FSA/RHS & VA Home Purchase Loans
B) Conventional Home Purchase Loans
C) Refinancings
D) Home Improvement Loans
E) Loans on Dwellings For 5+ Families
F) Non-occupant Loans on < 5 Family Dwellings (A B C & D)
Number
Average Value
Number
Average Value
Number
Average Value
Number
Average Value
Number
Average Value
Number
Average Value
LOANS ORIGINATED
2
$94,360
46
$109,372
329
$97,505
43
$53,089
1
$205,660
7
$49,771
APPLICATIONS APPROVED, NOT ACCEPTED
0
$0
10
$134,824
54
$98,474
7
$15,330
0
$0
2
$55,690
APPLICATIONS DENIED
0
$0
18
$62,381
184
$100,418
23
$17,335
0
$0
3
$59,923
APPLICATIONS WITHDRAWN
0
$0
7
$135,959
74
$110,932
9
$8,287
0
$0
2
$56,755
FILES CLOSED FOR INCOMPLETENESS
0
$0
1
$218,860
13
$103,879
0
$0
0
$0
0
$0
Aggregated Statistics For Year 2002 (Based on 4 partial tracts)
A) FHA, FSA/RHS & VA Home Purchase Loans
B) Conventional Home Purchase Loans
C) Refinancings
D) Home Improvement Loans
F) Non-occupant Loans on < 5 Family Dwellings (A B C & D)
Number
Average Value
Number
Average Value
Number
Average Value
Number
Average Value
Number
Average Value
LOANS ORIGINATED
8
$71,278
57
$103,048
208
$93,264
21
$26,231
6
$75,460
APPLICATIONS APPROVED, NOT ACCEPTED
3
$48,970
19
$62,447
64
$81,117
5
$15,234
1
$52,880
APPLICATIONS DENIED
0
$0
22
$56,340
174
$86,138
22
$34,286
2
$36,055
APPLICATIONS WITHDRAWN
1
$110,180
10
$124,844
49
$101,909
4
$5,242
0
$0
FILES CLOSED FOR INCOMPLETENESS
0
$0
1
$116,050
25
$88,981
0
$0
0
$0
Aggregated Statistics For Year 2001 (Based on 4 partial tracts)
A) FHA, FSA/RHS & VA Home Purchase Loans
B) Conventional Home Purchase Loans
C) Refinancings
D) Home Improvement Loans
F) Non-occupant Loans on < 5 Family Dwellings (A B C & D)
Number
Average Value
Number
Average Value
Number
Average Value
Number
Average Value
Number
Average Value
LOANS ORIGINATED
5
$84,416
60
$92,212
174
$85,824
45
$22,599
5
$73,078
APPLICATIONS APPROVED, NOT ACCEPTED
1
$70,510
17
$47,704
55
$92,598
16
$37,961
0
$0
APPLICATIONS DENIED
0
$0
34
$40,079
133
$74,091
33
$20,170
4
$81,898
APPLICATIONS WITHDRAWN
0
$0
8
$109,231
58
$76,854
14
$24,886
3
$52,980
FILES CLOSED FOR INCOMPLETENESS
0
$0
1
$35,260
11
$65,906
3
$38,683
0
$0
Aggregated Statistics For Year 2000 (Based on 4 partial tracts)
A) FHA, FSA/RHS & VA Home Purchase Loans
B) Conventional Home Purchase Loans
C) Refinancings
D) Home Improvement Loans
F) Non-occupant Loans on < 5 Family Dwellings (A B C & D)
Number
Average Value
Number
Average Value
Number
Average Value
Number
Average Value
Number
Average Value
LOANS ORIGINATED
8
$66,166
61
$90,793
95
$61,032
39
$19,966
8
$39,799
APPLICATIONS APPROVED, NOT ACCEPTED
2
$74,295
22
$67,826
41
$60,229
13
$24,345
0
$0
APPLICATIONS DENIED
1
$90,840
46
$55,042
91
$57,395
22
$30,384
2
$27,345
APPLICATIONS WITHDRAWN
0
$0
5
$126,810
39
$50,991
3
$29,520
0
$0
FILES CLOSED FOR INCOMPLETENESS
0
$0
1
$143,960
9
$69,258
0
$0
0
$0
Aggregated Statistics For Year 1999 (Based on 2 partial tracts)
A) FHA, FSA/RHS & VA Home Purchase Loans
B) Conventional Home Purchase Loans
C) Refinancings
D) Home Improvement Loans
F) Non-occupant Loans on < 5 Family Dwellings (A B C & D)


 Nearest zip codes: 15379, 15004, 15054, 26032, 15078, 15340.