Estimated zip code population in 2022: 365 Zip code population in 2010: 427 Zip code population in 2000: 397
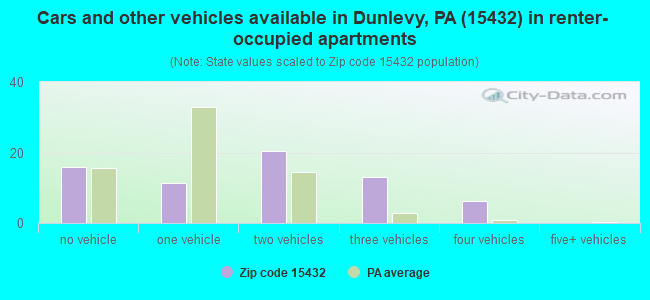
Houses and condos: 216 Renter-occupied apartments: 67
% of renters here:
37%
State:
31%
March 2022 cost of living index in zip code 15432: 88.8 (less than average, U.S. average is 100)
Land area: 0.6 sq. mi. Water area: 0.1 sq. mi.
Population density: 570 people per square mile
(low).
OSM Map
General Map
Google Map
MSN Map
OSM Map
General Map
Google Map
MSN Map
OSM Map
General Map
Google Map
MSN Map
OSM Map
General Map
Google Map
MSN Map
Please wait while loading the map...
Real estate property taxes paid for housing units in 2022:
This zip code:
1.6% ($1,615)
Pennsylvania:
1.3% ($3,094)
Median real estate property taxes paid for housing units with mortgages in 2022: $1,621 (1.7%) Median real estate property taxes paid for housing units with no mortgage in 2022: $1,604 (1.5%)
Business Search- 14 Million verified businesses
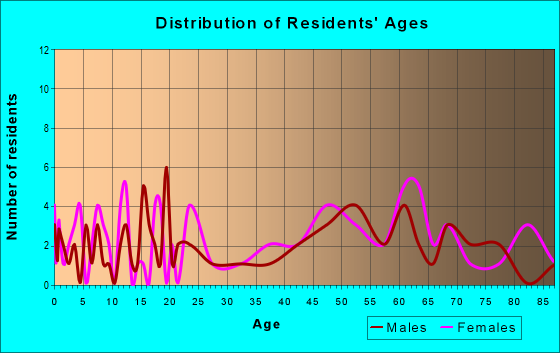
Males: 207
(56.8%)
Females: 157
(43.2%)
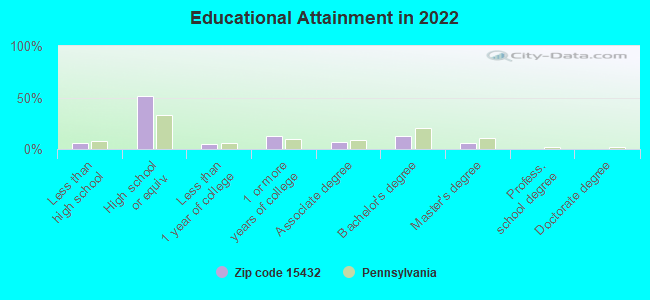
For population 25 years and over in 15432:
High school or higher: 92.7%
Bachelor's degree or higher: 18.6%
Graduate or professional degree: 6.4%
Unemployed: 3.9%
Mean travel time to work (commute): 22.0 minutes
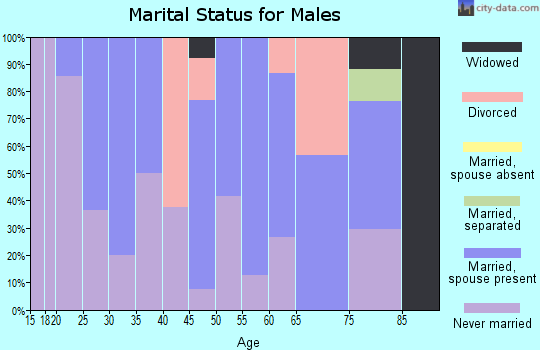
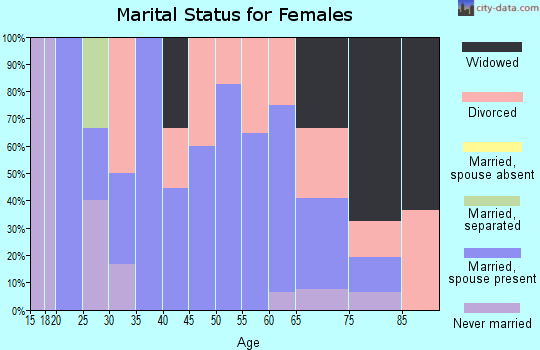
For population 15 years and over in 15432:
Never married: 27.6%
Now married: 43.8%
Separated: 1.4%
Widowed: 10.7%
Divorced: 16.5%
Zip code 15432 compared to state average:
Median house value significantly below state average.
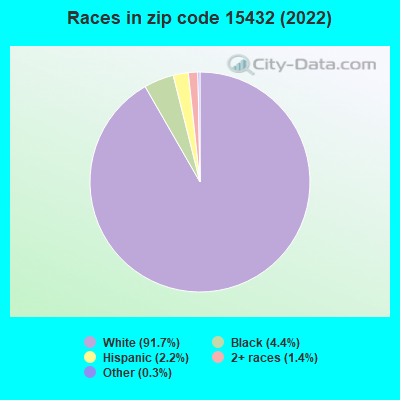
Black race population percentage below state average.
Hispanic race population percentage significantly below state average.
Median age above state average.
Foreign-born population percentage significantly below state average.
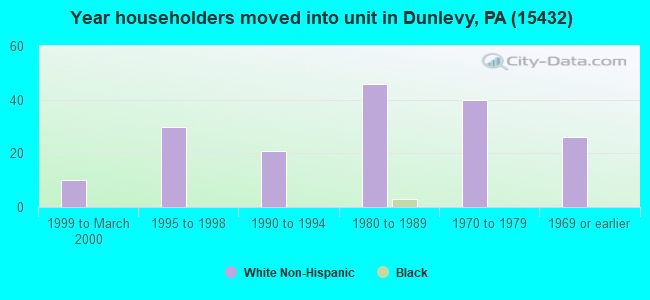
Length of stay since moving in significantly above state average.
Number of college students below state average.
Percentage of population with a bachelor's degree or higher below state average.
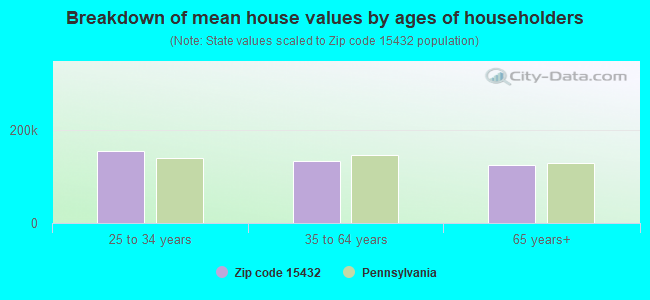
Estimated median house/condo value in 2022: $102,672
15432:
$102,672
Pennsylvania:
$245,500
Median resident age:
This zip code:
47.3 years
Pennsylvania median age:
40.9 years
Average household size:
This zip code:
2.0 people
Pennsylvania:
2.4 people
Averages for the 2004 tax year for zip code 15432, filed in 2005:
Average Adjusted Gross Income (AGI) in 2004: $29,172 (Individual Income Tax Returns)
Here:
$29,172
State:
$48,049
Salary/wage: $28,071 (reported on 81.2% of returns)
Here:
$28,071
State:
$42,646
(% of AGI for various income ranges: 75.2% for AGIs below $10k, 66.0% for AGIs $10k-25k, 78.3% for AGIs $25k-50k, 81.3% for AGIs $50k-75k, 84.4% for AGIs $75k-100k)
Taxable interest for individuals: $1,010 (reported on 52.1% of returns)
This zip code:
$1,010
Pennsylvania:
$1,657
(% of AGI for various income ranges: 4.3% for AGIs below $10k, 6.5% for AGIs $10k-25k, 1.6% for AGIs $25k-50k, 0.2% for AGIs $50k-75k)
Taxable dividends: $74 (reported on 14.1% of returns)
Here:
$74
State:
$3,566
Net capital gain/loss: +$200 (reported on 7.8% of returns)
Here:
+$200
State:
+$9,716
Profit/loss from business: +$1,412 (reported on 8.9% of returns)
Here:
+$1,412
State:
+$14,267
Total itemized deductions: $11,778 (15% of AGI, reported on 9.4% of returns)
Here:
$11,778
State:
$18,804
Here:
15.4% of AGI
State:
19.5% of AGI
Charity contributions deductions: $1,067 (2% of AGI, reported on 7.8% of returns)
Here:
$1,067
State:
$3,337
Here:
1.5% of AGI
State:
3.3% of AGI
Total tax: $3,403 (reported on 69.8% of returns)
15432:
$3,403
State:
$8,008
(% of AGI for various income ranges: 2.5% for AGIs below $10k, 3.7% for AGIs $10k-25k, 6.7% for AGIs $25k-50k, 9.9% for AGIs $50k-75k, 12.5% for AGIs $75k-100k)
Earned income credit: $1,742 (reported on 16.1% of returns)
Here:
$1,742
State:
$1,643
Percentage of individuals using paid preparers for their 2004 taxes: 64.1%
Here:
64%
State:
56%
(% for various income ranges: 52.3% for AGIs below $10k, 67.2% for AGIs $10k-25k, 68.8% for AGIs $25k-50k, 92.9% for AGIs $50k-75k)
Household received Food Stamps/SNAP in the past 12 months: 17 Household did not receive Food Stamps/SNAP in the past 12 months: 166
Women who had a birth in the past 12 months: 5 (5 now married, 0 unmarried) Women who did not have a birth in the past 12 months: 65 (21 now married, 44 unmarried)
Housing units in zip code 15432 with a mortgage: 51 (2 second mortgage, 2 both second mortgage and home equity loan) Houses without a mortgage: 8
Median monthly owner costs for units with a mortgage: $1,048 Median monthly owner costs for units without a mortgage: $543
Residents with income below the poverty level in 2022:
This zip code:
7.1%
Whole state:
11.8%
Residents with income below 50% of the poverty level in 2022:
This zip code:
3.0%
Whole state:
6.1%
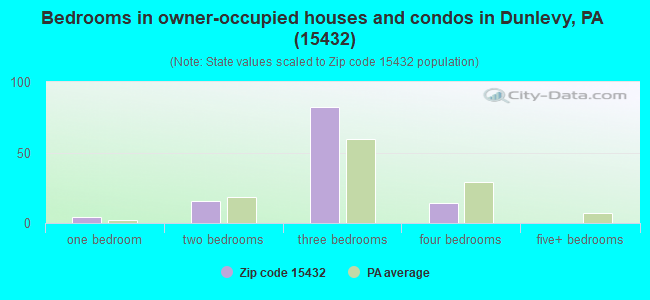
Median number of rooms in houses and condos:
Here:
6.0
State:
6.8
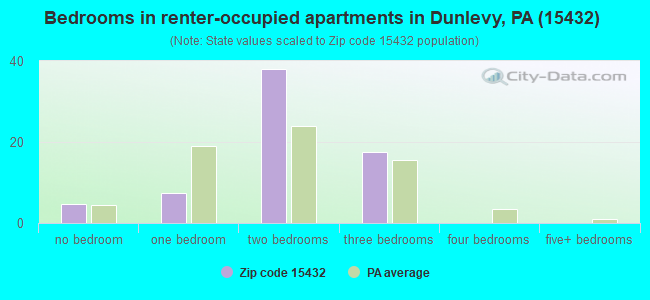
Median number of rooms in apartments:
Here:
5.3
State:
4.3
Notable locations in this zip code not listed on our city pages
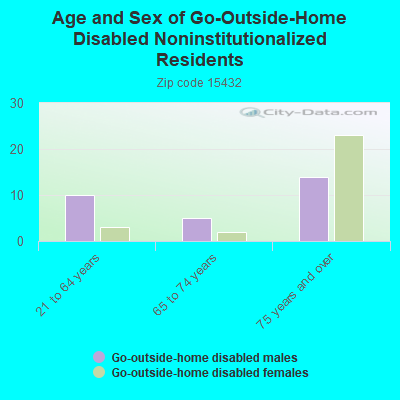
In group quarters: 4 (-1 institutionalized population)
Size of family households: 52 2-persons, 28 3-persons, 22 4-persons
Size of nonfamily households: 58 1-person, 13 2-persons, 8 3-persons
32 married couples with children.
10 single-parent households (9 men, 1 women).
99.7% of residents of 15432 zip code speak English at home.
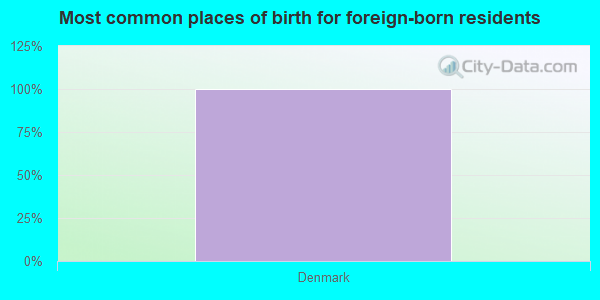
Foreign born population: 3 (0.9%) (100.0% of them are naturalized citizens)
This zip code:
0.9%
Whole state:
7.5%
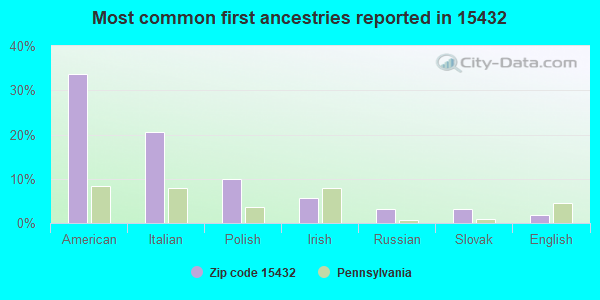
100%Denmark
34%American
21%Italian
10%Polish
6%Irish
3%Russian
3%Slovak
2%English
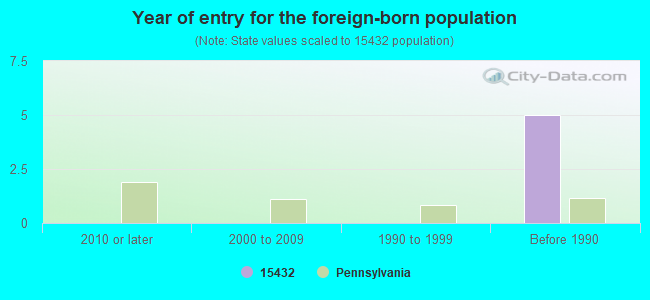
Year of entry for the foreign-born population
02010 or later
02000 to 2009
01990 to 1999
5Before 1990
Housing units lacking complete plumbing facilities: 3.6% Housing units lacking complete kitchen facilities: 10.6%
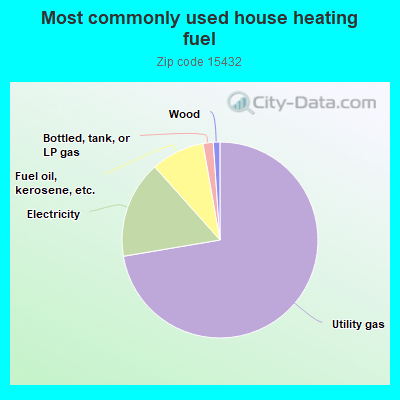
73.0%Utility gas
16.2%Electricity
8.9%Fuel oil, kerosene, etc.
1.7%Bottled, tank, or LP gas
1.1%Wood
Population in 1990: 417.
Place of birth for U.S.-born residents:
This state: 288
Northeast: 7
Midwest: 6
South: 29
West: 27
75% of the 15432 zip code residents lived in the same house 5 years ago. Out of people who lived in different houses, 60% lived in this county. Out of people who lived in different counties, 50% lived in Pennsylvania.
82% of the 15432 zip code residents lived in the same house 1 year ago. Out of people who lived in different houses, 50% moved from this county. Out of people who lived in different houses, 44% moved from different county within same state.
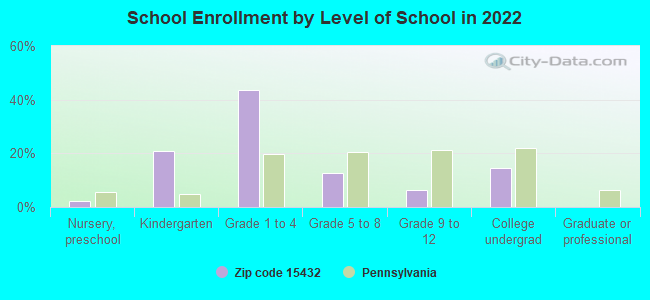
Private vs. public school enrollment:
Students in private schools in grades 1 to 8 (elementary and middle school): 1
Here:
3.9%
Pennsylvania:
15.7%
Students in private schools in grades 9 to 12 (high school):
Here:
0.0%
Pennsylvania:
13.4%
Students in private undergraduate colleges: 1
Here:
25.1%
Pennsylvania:
39.8%
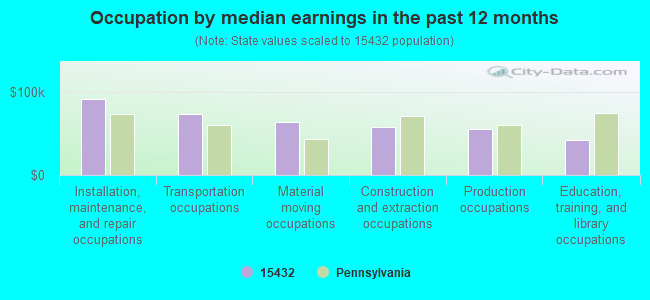
Occupation by median earnings in the past 12 months ($)
91,949Installation, maintenance, and repair occupations
73,375Transportation occupations
64,007Material moving occupations
58,159Construction and extraction occupations
55,613Production occupations
42,145Education, training, and library occupations
Companies with federal contracts located in this zip code:
BLUE DANUBE INCORPORATED (WHARF ST in DUNLEVY, PA; small business) : $10,000 in 2 contractsin 2004
$5,000 with U.S. Army Corps of Engineers - civil program financing only for Vessel Towing Service. Signed on 2004-05-21. Completion date: 2004-05-23.
$5,000 with Army for Vessel Towing Service. Signed on 2004-05-21. Completion date: 2004-05-23.
Top industries in this zip code by the number of employees in 2005:
Health Care and Social Assistance: Continuing Care Retirement Communities (20-49 employees: 1 establishment)
Administrative and Support and Waste Management and Remediation Services: Office Administrative Services (10-19: 1, 1-4: 1)
Arts, Entertainment, and Recreation: Fitness and Recreational Sports Centers (10-19: 1)
Professional, Scientific, and Technical Services: Tax Preparation Services (5-9: 1)
Construction: Masonry Contractors (1-4: 2)
Wholesale Trade: Other Miscellaneous Durable Goods Merchant Wholesalers (1-4: 1)
Other Services (except Public Administration): Automotive Transmission Repair (1-4: 1)
People in group quarters in 2000:
20 people in other noninstitutional group quarters
Home Mortgage Disclosure Act Aggregated Statistics For Year 2009 (Based on 2 partial tracts)
A) FHA, FSA/RHS & VA Home Purchase Loans
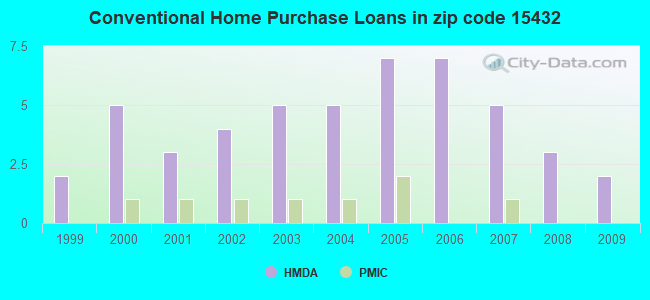
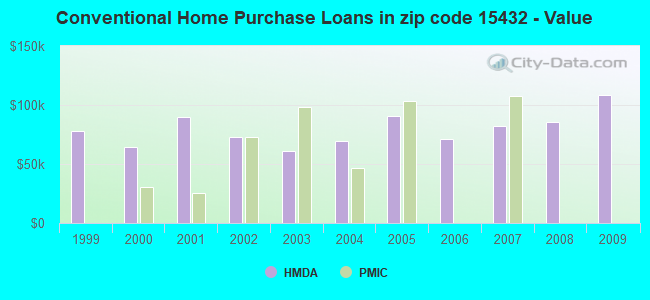
B) Conventional Home Purchase Loans
C) Refinancings
D) Home Improvement Loans
F) Non-occupant Loans on < 5 Family Dwellings (A B C & D)
Number
Average Value
Number
Average Value
Number
Average Value
Number
Average Value
Number
Average Value
LOANS ORIGINATED
2
$70,280
2
$108,555
6
$76,613
1
$90,700
1
$22,100
APPLICATIONS APPROVED, NOT ACCEPTED
0
$0
0
$0
0
$0
0
$0
0
$0
APPLICATIONS DENIED
0
$0
0
$0
2
$146,390
1
$35,710
0
$0
APPLICATIONS WITHDRAWN
0
$0
0
$0
1
$139,670
0
$0
0
$0
FILES CLOSED FOR INCOMPLETENESS
0
$0
0
$0
1
$51,450
0
$0
0
$0
Aggregated Statistics For Year 2008 (Based on 2 partial tracts)
A) FHA, FSA/RHS & VA Home Purchase Loans
B) Conventional Home Purchase Loans
C) Refinancings
D) Home Improvement Loans
F) Non-occupant Loans on < 5 Family Dwellings (A B C & D)
Number
Average Value
Number
Average Value
Number
Average Value
Number
Average Value
Number
Average Value
LOANS ORIGINATED
2
$83,185
3
$85,513
6
$68,775
2
$15,825
1
$21,920
APPLICATIONS APPROVED, NOT ACCEPTED
0
$0
0
$0
1
$69,480
0
$0
0
$0
APPLICATIONS DENIED
0
$0
0
$0
4
$86,632
1
$36,420
0
$0
APPLICATIONS WITHDRAWN
0
$0
0
$0
1
$130,660
0
$0
0
$0
FILES CLOSED FOR INCOMPLETENESS
0
$0
0
$0
0
$0
0
$0
0
$0
Aggregated Statistics For Year 2007 (Based on 2 partial tracts)
B) Conventional Home Purchase Loans
C) Refinancings
D) Home Improvement Loans
F) Non-occupant Loans on < 5 Family Dwellings (A B C & D)
Number
Average Value
Number
Average Value
Number
Average Value
Number
Average Value
LOANS ORIGINATED
5
$82,106
7
$82,111
3
$29,937
1
$18,390
APPLICATIONS APPROVED, NOT ACCEPTED
1
$71,780
2
$55,955
1
$6,010
0
$0
APPLICATIONS DENIED
0
$0
5
$92,218
2
$28,290
0
$0
APPLICATIONS WITHDRAWN
1
$58,870
2
$73,990
0
$0
0
$0
FILES CLOSED FOR INCOMPLETENESS
0
$0
0
$0
0
$0
0
$0
Aggregated Statistics For Year 2006 (Based on 2 partial tracts)
A) FHA, FSA/RHS & VA Home Purchase Loans
B) Conventional Home Purchase Loans
C) Refinancings
D) Home Improvement Loans
F) Non-occupant Loans on < 5 Family Dwellings (A B C & D)
Number
Average Value
Number
Average Value
Number
Average Value
Number
Average Value
Number
Average Value
LOANS ORIGINATED
1
$72,490
7
$71,049
10
$86,331
3
$33,473
1
$61,880
APPLICATIONS APPROVED, NOT ACCEPTED
0
$0
1
$65,950
2
$67,890
0
$0
0
$0
APPLICATIONS DENIED
0
$0
1
$97,770
4
$80,665
1
$57,990
1
$50,030
APPLICATIONS WITHDRAWN
0
$0
1
$64,000
2
$120,580
0
$0
0
$0
FILES CLOSED FOR INCOMPLETENESS
0
$0
0
$0
0
$0
0
$0
0
$0
Aggregated Statistics For Year 2005 (Based on 2 partial tracts)
A) FHA, FSA/RHS & VA Home Purchase Loans
B) Conventional Home Purchase Loans
C) Refinancings
D) Home Improvement Loans
F) Non-occupant Loans on < 5 Family Dwellings (A B C & D)
G) Loans On Manufactured Home Dwelling (A B C & D)
Number
Average Value
Number
Average Value
Number
Average Value
Number
Average Value
Number
Average Value
Number
Average Value
LOANS ORIGINATED
1
$36,240
7
$90,774
8
$68,996
5
$48,550
1
$47,380
0
$0
APPLICATIONS APPROVED, NOT ACCEPTED
0
$0
2
$51,715
2
$87,780
1
$11,320
1
$26,170
0
$0
APPLICATIONS DENIED
0
$0
2
$72,045
6
$82,830
3
$28,170
1
$8,310
1
$67,710
APPLICATIONS WITHDRAWN
0
$0
0
$0
2
$97,945
1
$66,830
0
$0
0
$0
FILES CLOSED FOR INCOMPLETENESS
0
$0
0
$0
0
$0
0
$0
0
$0
0
$0
Aggregated Statistics For Year 2004 (Based on 2 partial tracts)
A) FHA, FSA/RHS & VA Home Purchase Loans
B) Conventional Home Purchase Loans
C) Refinancings
D) Home Improvement Loans
F) Non-occupant Loans on < 5 Family Dwellings (A B C & D)
Number
Average Value
Number
Average Value
Number
Average Value
Number
Average Value
Number
Average Value
LOANS ORIGINATED
2
$80,000
5
$69,906
14
$68,169
3
$39,190
1
$43,320
APPLICATIONS APPROVED, NOT ACCEPTED
0
$0
1
$48,970
3
$59,463
0
$0
0
$0
APPLICATIONS DENIED
0
$0
1
$90,880
10
$83,679
1
$59,400
1
$31,820
APPLICATIONS WITHDRAWN
0
$0
1
$56,750
5
$89,460
0
$0
0
$0
FILES CLOSED FOR INCOMPLETENESS
0
$0
0
$0
2
$106,255
1
$29,350
0
$0
Aggregated Statistics For Year 2003 (Based on 2 partial tracts)
A) FHA, FSA/RHS & VA Home Purchase Loans
B) Conventional Home Purchase Loans
C) Refinancings
D) Home Improvement Loans
F) Non-occupant Loans on < 5 Family Dwellings (A B C & D)
Number
Average Value
Number
Average Value
Number
Average Value
Number
Average Value
Number
Average Value
LOANS ORIGINATED
1
$50,390
5
$61,420
16
$82,842
2
$22,100
1
$76,200
APPLICATIONS APPROVED, NOT ACCEPTED
0
$0
1
$52,510
4
$67,140
1
$13,790
0
$0
APPLICATIONS DENIED
0
$0
1
$77,260
9
$70,622
3
$26,167
1
$18,920
APPLICATIONS WITHDRAWN
0
$0
1
$64,000
2
$83,450
1
$18,210
0
$0
FILES CLOSED FOR INCOMPLETENESS
0
$0
0
$0
0
$0
0
$0
0
$0
Aggregated Statistics For Year 2002 (Based on 2 partial tracts)
A) FHA, FSA/RHS & VA Home Purchase Loans
B) Conventional Home Purchase Loans
C) Refinancings
D) Home Improvement Loans
F) Non-occupant Loans on < 5 Family Dwellings (A B C & D)
Number
Average Value
Number
Average Value
Number
Average Value
Number
Average Value
Number
Average Value
LOANS ORIGINATED
1
$99,890
4
$73,282
15
$64,933
3
$28,053
1
$36,420
APPLICATIONS APPROVED, NOT ACCEPTED
0
$0
0
$0
3
$65,240
1
$12,550
0
$0
APPLICATIONS DENIED
0
$0
1
$28,640
8
$71,848
2
$9,810
1
$3,710
APPLICATIONS WITHDRAWN
0
$0
0
$0
3
$78,677
0
$0
0
$0
FILES CLOSED FOR INCOMPLETENESS
0
$0
0
$0
1
$57,810
0
$0
0
$0
Aggregated Statistics For Year 2001 (Based on 2 partial tracts)
A) FHA, FSA/RHS & VA Home Purchase Loans
B) Conventional Home Purchase Loans
C) Refinancings
D) Home Improvement Loans
Number
Average Value
Number
Average Value
Number
Average Value
Number
Average Value
LOANS ORIGINATED
2
$53,745
3
$89,757
13
$54,903
3
$26,050
APPLICATIONS APPROVED, NOT ACCEPTED
0
$0
0
$0
4
$61,835
1
$14,670
APPLICATIONS DENIED
0
$0
0
$0
5
$64,178
2
$13,965
APPLICATIONS WITHDRAWN
0
$0
1
$52,330
3
$68,420
0
$0
FILES CLOSED FOR INCOMPLETENESS
0
$0
0
$0
0
$0
0
$0
Aggregated Statistics For Year 2000 (Based on 2 partial tracts)
A) FHA, FSA/RHS & VA Home Purchase Loans
B) Conventional Home Purchase Loans
C) Refinancings
D) Home Improvement Loans
F) Non-occupant Loans on < 5 Family Dwellings (A B C & D)
Number
Average Value
Number
Average Value
Number
Average Value
Number
Average Value
Number
Average Value
LOANS ORIGINATED
1
$85,750
5
$64,390
7
$48,746
1
$54,980
1
$83,980
APPLICATIONS APPROVED, NOT ACCEPTED
0
$0
0
$0
1
$87,160
1
$12,380
0
$0
APPLICATIONS DENIED
0
$0
2
$37,925
4
$56,575
2
$19,625
1
$29,170
APPLICATIONS WITHDRAWN
0
$0
1
$19,620
1
$63,650
0
$0
0
$0
FILES CLOSED FOR INCOMPLETENESS
0
$0
0
$0
1
$56,580
0
$0
0
$0
Aggregated Statistics For Year 1999 (Based on 1 partial tract)
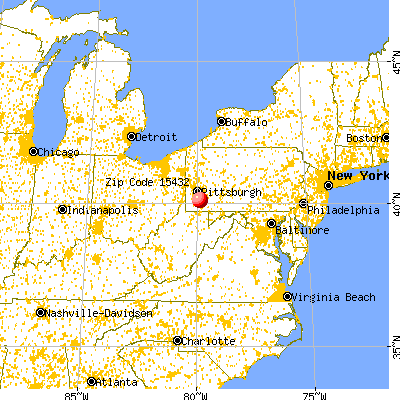


 Nearest zip codes: 15412, 15072, 15483, 15477, 15062, 15438.


 : $10,000 in 2 contracts in 2004