Estimated zip code population in 2022: 2,732 Zip code population in 2010: 3,345 Zip code population in 2000: 3,422
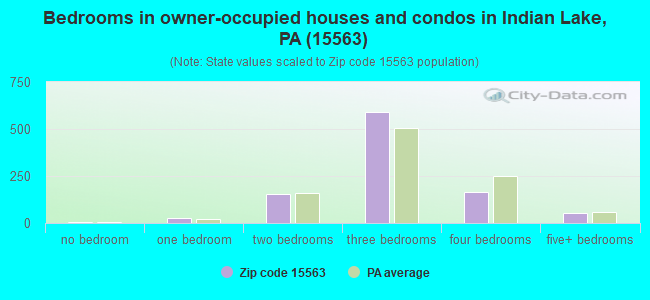
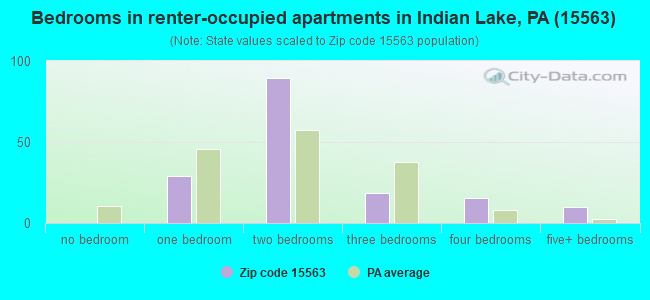
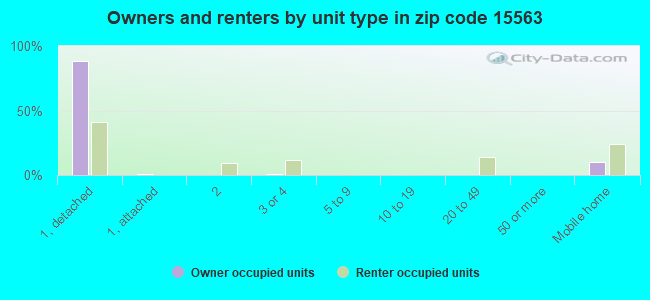
Houses and condos: 1,580 Renter-occupied apartments: 163
% of renters here:
14%
State:
31%
March 2022 cost of living index in zip code 15563: 90.4 (less than average, U.S. average is 100)
Land area: 56.8 sq. mi. Water area: 0.0 sq. mi.
Population density: 48 people per square mile
(very low).
OSM Map
General Map
Google Map
MSN Map
OSM Map
General Map
Google Map
MSN Map
OSM Map
General Map
Google Map
MSN Map
OSM Map
General Map
Google Map
MSN Map
Please wait while loading the map...
Real estate property taxes paid for housing units in 2022:
This zip code:
1.1% ($1,387)
Pennsylvania:
1.3% ($3,094)
Median real estate property taxes paid for housing units with mortgages in 2022: $1,637 (1.2%) Median real estate property taxes paid for housing units with no mortgage in 2022: $1,169 (1.1%)
Business Search- 14 Million verified businesses
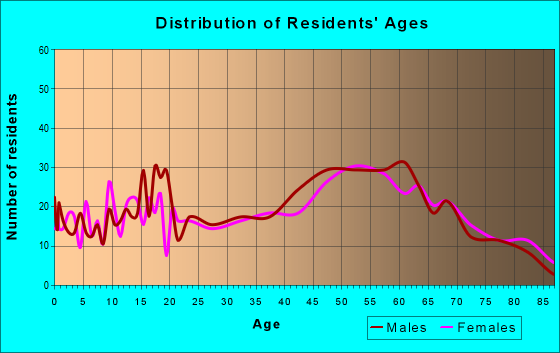
Males: 1,476
(54.0%)
Females: 1,255
(46.0%)
For population 25 years and over in 15563:
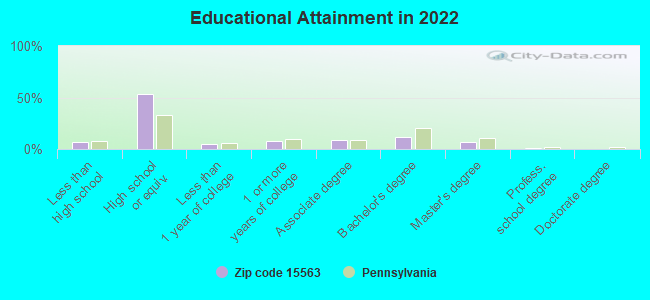
High school or higher: 92.3%
Bachelor's degree or higher: 19.2%
Graduate or professional degree: 7.8%
Unemployed: 3.2%
Mean travel time to work (commute): 22.3 minutes
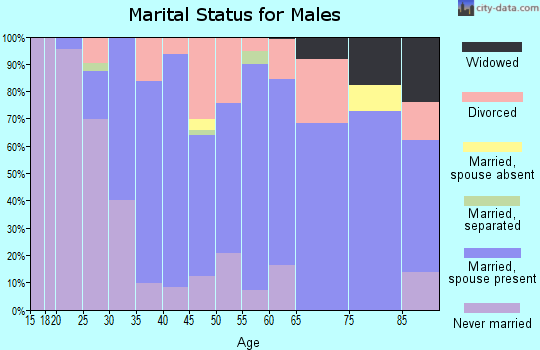
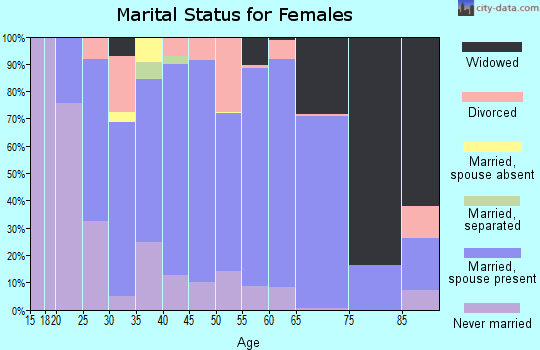
For population 15 years and over in 15563:
Never married: 20.2%
Now married: 64.4%
Separated: 0.4%
Widowed: 5.7%
Divorced: 9.4%
Zip code 15563 compared to state average:
Median house value below state average.
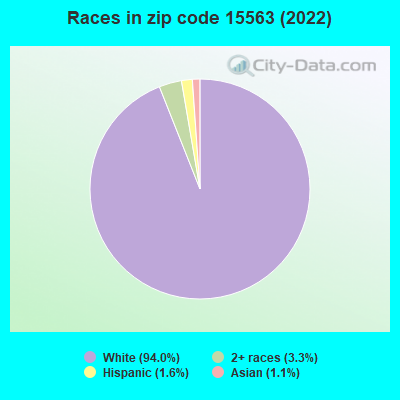
Black race population percentage significantly below state average.
Hispanic race population percentage significantly below state average.
Median age above state average.
Foreign-born population percentage significantly below state average.
Renting percentage below state average.
Length of stay since moving in significantly above state average.
Number of college students below state average.
Percentage of population with a bachelor's degree or higher below state average.
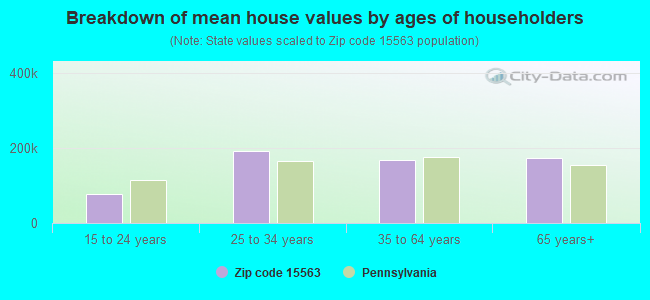
Estimated median house/condo value in 2022: $127,634
15563:
$127,634
Pennsylvania:
$245,500
According to our research of Pennsylvania and other state lists, there were 2 registered sex offenders living in 15563 zip code as of April 19, 2024. The ratio of all residents to sex offenders in zip code 15563 is 1,634 to 1. The ratio of registered sex offenders to all residents in this zip code is much lower than the state average.
Median resident age:
This zip code:
48.6 years
Pennsylvania median age:
40.9 years
Average household size:
This zip code:
2.4 people
Pennsylvania:
2.4 people
Averages for the 2020 tax year for zip code 15563, filed in 2021:
Average Adjusted Gross Income (AGI) in 2020: $55,188 (Individual Income Tax Returns)
Here:
$55,188
State:
$75,707
Salary/wage: $45,944 (reported on 75.5% of returns)
Here:
$45,944
State:
$62,806
(% of AGI for various income ranges: 1088.9% for AGIs below $25k, 3479.6% for AGIs $25k-50k, 6148.8% for AGIs $50k-75k, 8744.5% for AGIs $75k-100k, 16073.0% for AGIs $100k-200k)
Taxable interest for individuals: $1,041 (reported on 38.8% of returns)
This zip code:
$1,041
Pennsylvania:
$1,633
(% of AGI for various income ranges: 28.6% for AGIs below $25k, 43.1% for AGIs $25k-50k, 37.1% for AGIs $50k-75k, 102.7% for AGIs $75k-100k, 194.0% for AGIs $100k-200k)
Ordinary dividends: $4,307 (reported on 20.9% of returns)
Here:
$4,307
State:
$7,382
(% of AGI for various income ranges: 33.6% for AGIs below $25k, 48.8% for AGIs $25k-50k, 31.8% for AGIs $50k-75k, 145.5% for AGIs $75k-100k, 814.0% for AGIs $100k-200k)
Net capital gain/loss in AGI: +$12,143 (reported on 16.5% of returns)
Here:
+$12,143
State:
+$23,522
(% of AGI for various income ranges: 32.9% for AGIs below $25k, 63.5% for AGIs $25k-50k, 49.4% for AGIs $50k-75k, 307.3% for AGIs $75k-100k, 2114.0% for AGIs $100k-200k)
Profit/loss from business: +$18,079 (reported on 13.7% of returns)
Here:
+$18,079
State:
+$16,274
(% of AGI for various income ranges: 99.6% for AGIs below $25k, 125.4% for AGIs $25k-50k, 315.9% for AGIs $50k-75k, 280.9% for AGIs $75k-100k, 1984.0% for AGIs $100k-200k)
Taxable individual retirement arrangement distribution: $10,910 (reported on 15.1% of returns)
15563:
$10,910
Pennsylvania:
$18,583
(% of AGI for various income ranges: 140.4% for AGIs below $25k, 138.8% for AGIs $25k-50k, 194.1% for AGIs $50k-75k, 393.6% for AGIs $75k-100k, 774.0% for AGIs $100k-200k)
Total itemized deductions: $20,733 (reported on 2.2% of returns)
Here:
$20,733
State:
$34,850
(% of AGI for various income ranges: 365.9% for AGIs $50k-75k)
Taxes paid: $6,067 (reported on 2.2% of returns)
15563:
$6,067
State:
$8,200
(% of AGI for various income ranges: 107.1% for AGIs $50k-75k)
Earned income credit: $1,782 (reported on 12.2% of returns)
Here:
$1,782
State:
$2,100
(% of AGI for various income ranges: 55.7% for AGIs below $25k, 56.5% for AGIs $25k-50k)
Percentage of individuals using paid preparers for their 2020 taxes: 90.6%
Here:
91%
State:
92%
(% for various income ranges: 87.5% for AGIs below $25k, 93.9% for AGIs $25k-50k, 87.5% for AGIs $50k-75k, 93.8% for AGIs $75k-100k, 93.8% for AGIs $100k-200k, 100.0% for AGIs over 200k)
Averages for the 2012 tax year for zip code 15563, filed in 2013:
Average Adjusted Gross Income (AGI) in 2012: $48,775 (Individual Income Tax Returns)
Here:
$48,775
State:
$61,346
Salary/wage: $40,499 (reported on 78.8% of returns)
Here:
$40,499
State:
$51,902
(% of AGI for various income ranges: 65.6% for AGIs below $25k, 77.6% for AGIs $25k-50k, 76.5% for AGIs $50k-75k, 76.3% for AGIs $75k-100k, 81.2% for AGIs $100k-200k)
Taxable interest for individuals: $998 (reported on 39.7% of returns)
This zip code:
$998
Pennsylvania:
$1,588
(% of AGI for various income ranges: 1.4% for AGIs below $25k, 0.6% for AGIs $25k-50k, 0.7% for AGIs $50k-75k, 0.6% for AGIs $75k-100k, 1.6% for AGIs $100k-200k)
Ordinary dividends: $2,648 (reported on 19.9% of returns)
Here:
$2,648
State:
$5,827
(% of AGI for various income ranges: 1.5% for AGIs below $25k, 0.6% for AGIs $25k-50k, 0.5% for AGIs $50k-75k, 0.5% for AGIs $75k-100k, 3.4% for AGIs $100k-200k)
Net capital gain/loss in AGI: +$10,433 (reported on 12.3% of returns)
Here:
+$10,433
State:
+$14,495
(% of AGI for various income ranges: 0.6% for AGIs $25k-50k, 1.3% for AGIs $75k-100k, 12.6% for AGIs $100k-200k)
Profit/loss from business: +$15,765 (reported on 15.8% of returns)
Here:
+$15,765
State:
+$16,268
(% of AGI for various income ranges: 7.1% for AGIs below $25k, 3.8% for AGIs $25k-50k, 3.0% for AGIs $50k-75k, 2.4% for AGIs $75k-100k, 14.0% for AGIs $100k-200k)
Taxable individual retirement arrangement distribution: $10,480 (reported on 13.7% of returns)
15563:
$10,480
Pennsylvania:
$14,550
(% of AGI for various income ranges: 4.5% for AGIs below $25k, 2.2% for AGIs $25k-50k, 2.8% for AGIs $50k-75k, 4.8% for AGIs $75k-100k, 3.6% for AGIs $100k-200k)
Total itemized deductions: $20,696 (20% of AGI, reported on 17.1% of returns)
Here:
$20,696
State:
$23,538
Here:
20.2% of AGI
State:
18.4% of AGI
(% of AGI for various income ranges: 4.6% for AGIs below $25k, 4.9% for AGIs $25k-50k, 4.2% for AGIs $50k-75k, 8.1% for AGIs $75k-100k, 19.3% for AGIs $100k-200k)
Charity contributions: $4,300 (reported on 12.3% of returns)
Here:
$4,300
State:
$4,025
(% of AGI for various income ranges: 0.7% for AGIs $25k-50k, 0.5% for AGIs $50k-75k, 1.5% for AGIs $75k-100k, 3.1% for AGIs $100k-200k)
Taxes paid: $7,765 (reported on 15.8% of returns)
15563:
$7,765
State:
$9,982
(% of AGI for various income ranges: 0.9% for AGIs below $25k, 0.9% for AGIs $25k-50k, 1.1% for AGIs $50k-75k, 2.2% for AGIs $75k-100k, 8.7% for AGIs $100k-200k)
Earned income credit: $1,795 (reported on 13.7% of returns)
Here:
$1,795
State:
$2,106
(% of AGI for various income ranges: 3.8% for AGIs below $25k, 0.7% for AGIs $25k-50k)
Percentage of individuals using paid preparers for their 2012 taxes: 56.8%
Here:
57%
State:
53%
(% for various income ranges: 50.8% for AGIs below $25k, 54.3% for AGIs $25k-50k, 56.0% for AGIs $50k-75k, 66.7% for AGIs $75k-100k, 80.0% for AGIs $100k-200k, 100.0% for AGIs over 200k)
Averages for the 2004 tax year for zip code 15563, filed in 2005:
Average Adjusted Gross Income (AGI) in 2004: $35,615 (Individual Income Tax Returns)
Here:
$35,615
State:
$48,049
Salary/wage: $31,805 (reported on 81.3% of returns)
Here:
$31,805
State:
$42,646
(% of AGI for various income ranges: 92.4% for AGIs below $10k, 71.7% for AGIs $10k-25k, 81.5% for AGIs $25k-50k, 82.7% for AGIs $50k-75k, 75.4% for AGIs $75k-100k, 44.4% for AGIs over 100k)
Taxable interest for individuals: $1,173 (reported on 46.0% of returns)
This zip code:
$1,173
Pennsylvania:
$1,657
(% of AGI for various income ranges: 4.4% for AGIs below $10k, 2.4% for AGIs $10k-25k, 1.1% for AGIs $25k-50k, 0.7% for AGIs $50k-75k, 1.8% for AGIs $75k-100k, 2.1% for AGIs over 100k)
Taxable dividends: $1,672 (reported on 22.2% of returns)
Here:
$1,672
State:
$3,566
(% of AGI for various income ranges: 3.9% for AGIs below $10k, 1.2% for AGIs $10k-25k, 0.7% for AGIs $25k-50k, 0.9% for AGIs $50k-75k, 1.5% for AGIs $75k-100k, 1.1% for AGIs over 100k)
Net capital gain/loss: +$3,956 (reported on 13.9% of returns)
Here:
+$3,956
State:
+$9,716
(% of AGI for various income ranges: -1.7% for AGIs below $10k, -0.3% for AGIs $10k-25k, 0.6% for AGIs $25k-50k, 0.2% for AGIs $50k-75k, 3.7% for AGIs $75k-100k, 4.7% for AGIs over 100k)
Profit/loss from business: +$9,008 (reported on 17.5% of returns)
Here:
+$9,008
State:
+$14,267
(% of AGI for various income ranges: 10.3% for AGIs below $10k, 6.0% for AGIs $10k-25k, 3.3% for AGIs $25k-50k, 3.0% for AGIs $50k-75k, 5.2% for AGIs $75k-100k, 5.7% for AGIs over 100k)
Profit/loss from farming: +$1,615 (reported on 0.9% of returns)
Here:
+$1,615
State:
+$274
IRA payment deduction: $2,746 (reported on 4.5% of returns)
15563:
$2,746
Pennsylvania:
$2,903
(% of AGI for various income ranges: 0.3% for AGIs $10k-25k, 0.5% for AGIs $25k-50k, 0.2% for AGIs $50k-75k, 0.9% for AGIs $75k-100k)
Total itemized deductions: $15,175 (22% of AGI, reported on 15.4% of returns)
Here:
$15,175
State:
$18,804
Here:
21.6% of AGI
State:
19.5% of AGI
(% of AGI for various income ranges: 6.0% for AGIs $10k-25k, 3.4% for AGIs $25k-50k, 7.8% for AGIs $50k-75k, 7.7% for AGIs $75k-100k, 10.0% for AGIs over 100k)
Charity contributions deductions: $3,302 (4% of AGI, reported on 12.8% of returns)
Here:
$3,302
State:
$3,337
Here:
4.5% of AGI
State:
3.3% of AGI
(% of AGI for various income ranges: 0.6% for AGIs $10k-25k, 0.5% for AGIs $25k-50k, 1.5% for AGIs $50k-75k, 1.5% for AGIs $75k-100k, 2.1% for AGIs over 100k)
Total tax: $4,724 (reported on 75.3% of returns)
15563:
$4,724
State:
$8,008
(% of AGI for various income ranges: 4.6% for AGIs below $10k, 4.6% for AGIs $10k-25k, 6.6% for AGIs $25k-50k, 8.5% for AGIs $50k-75k, 11.5% for AGIs $75k-100k, 19.9% for AGIs over 100k)
Earned income credit: $1,498 (reported on 13.9% of returns)
Here:
$1,498
State:
$1,643
Percentage of individuals using paid preparers for their 2004 taxes: 60.9%
Here:
61%
State:
56%
(% for various income ranges: 56.7% for AGIs below $10k, 58.7% for AGIs $10k-25k, 60.3% for AGIs $25k-50k, 66.0% for AGIs $50k-75k, 67.6% for AGIs $75k-100k, 75.0% for AGIs over 100k)
Likely homosexual households (counted as self-reported same-sex unmarried-partner households)
Lesbian couples: 0.0% of all households
Gay men: 0.5% of all households
Household received Food Stamps/SNAP in the past 12 months: 173 Household did not receive Food Stamps/SNAP in the past 12 months: 984
Women who had a birth in the past 12 months: 29 (31 now married, 0 unmarried) Women who did not have a birth in the past 12 months: 410 (261 now married, 146 unmarried)
Housing units in zip code 15563 with a mortgage: 467 (9 second mortgage, 9 both second mortgage and home equity loan) Houses without a mortgage: 24
Median monthly owner costs for units with a mortgage: $1,184 Median monthly owner costs for units without a mortgage: $479
Residents with income below the poverty level in 2022:
This zip code:
9.2%
Whole state:
11.8%
Residents with income below 50% of the poverty level in 2022:
This zip code:
6.1%
Whole state:
6.1%
Median number of rooms in houses and condos:
Here:
6.3
State:
6.8
Median number of rooms in apartments:
Here:
4.9
State:
4.3
Notable locations in this zip code not listed on our city pages
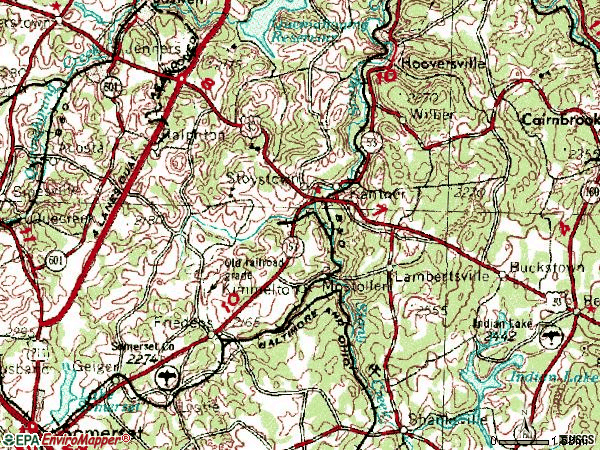
Notable locations in zip code 15563: Oakbrook Golf Course (A), Walnut Hill (B), Stoyestown Station (C), Reading Junction Station (D), Stone Bridge (E), Stoystown Volunteer Fire Company (F). Display/hide their locations on the map
Churches in zip code 15563 include: Horners Church (A), Hoffman Zion Church (B), Mount Tabor Church (C), Saint Josephs Church (D), Pokey Church (E), Saint Marys Church (F). Display/hide their locations on the map
Streams, rivers, and creeks: Wells Creek (A), Grove Run (B), Lamberts Run (C), Calendars Run (D), Buck Run (E), Beaverdam Creek (F), Oven Run (G). Display/hide their locations on the map
In group quarters: 14 (-1 institutionalized population)
Size of family households: 490 2-persons, 119 3-persons, 182 4-persons, 14 5-persons, 19 6-persons, 14 7-or-more-persons
Size of nonfamily households: 265 1-person, 49 2-persons
404 married couples with children.
45 single-parent households (18 men, 27 women).
97.3% of residents of 15563 zip code speak English at home.
1.4% of residents speak Spanish at home (34% very well, 17% well, 49% not well).
0.7% of residents speak other Indo-European language at home (100% very well).
0.4% of residents speak Asian or Pacific Island language at home (100% very well).
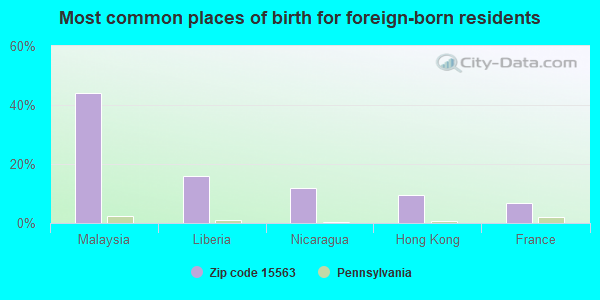
Foreign born population: 76 (2.8%) (74.7% of them are naturalized citizens)
This zip code:
2.8%
Whole state:
7.5%
44%Malaysia
16%Liberia
12%Nicaragua
9%Hong Kong
7%France
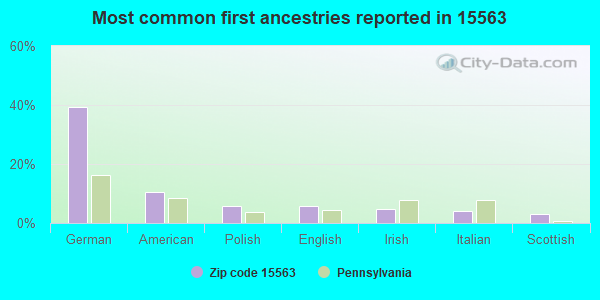
39%German
10%American
6%Polish
6%English
5%Irish
4%Italian
3%Scottish
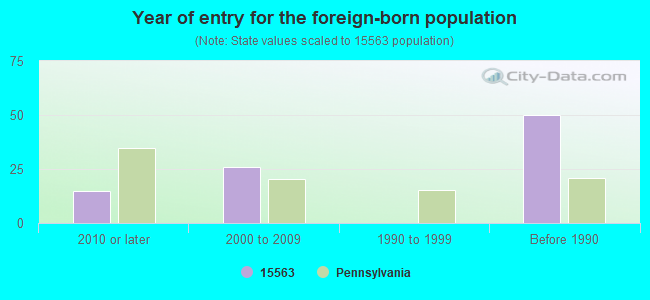
Year of entry for the foreign-born population
152010 or later
262000 to 2009
01990 to 1999
50Before 1990
Housing units lacking complete plumbing facilities: 1.7% Housing units lacking complete kitchen facilities: 5.3%
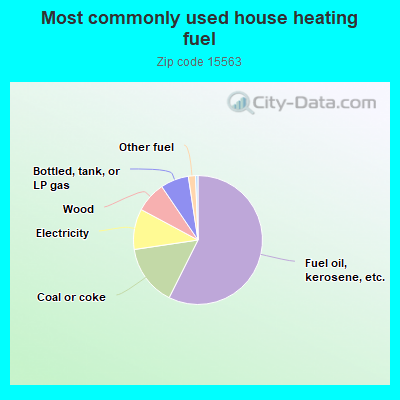
57.5%Fuel oil, kerosene, etc.
15.3%Coal or coke
10.2%Electricity
7.7%Wood
7.1%Bottled, tank, or LP gas
1.8%Other fuel
0.6%No fuel used
Population in 1990: 2,690. Population change in the 1990s: +732 (+27.2%).
Place of birth for U.S.-born residents:
This state: 2,332
Northeast: 76
Midwest: 98
South: 93
West: 14
79% of the 15563 zip code residents lived in the same house 5 years ago. Out of people who lived in different houses, 70% lived in this county. Out of people who lived in different counties, 50% lived in Pennsylvania.
97% of the 15563 zip code residents lived in the same house 1 year ago. Out of people who lived in different houses, 75% moved from this county. Out of people who lived in different houses, 30% moved from different county within same state. Out of people who lived in different houses, 4% moved from different state.
Private vs. public school enrollment:
Students in private schools in grades 1 to 8 (elementary and middle school): 4
Here:
2.5%
Pennsylvania:
15.7%
Students in private schools in grades 9 to 12 (high school): 5
Here:
7.0%
Pennsylvania:
13.4%
Students in private undergraduate colleges: 15
Here:
23.9%
Pennsylvania:
39.8%
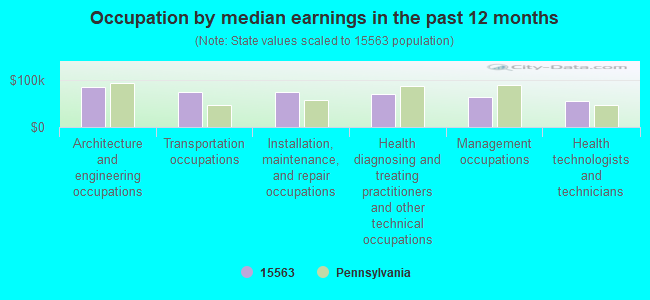
Occupation by median earnings in the past 12 months ($)
83,586Architecture and engineering occupations
73,510Transportation occupations
73,226Installation, maintenance, and repair occupations
69,812Health diagnosing and treating practitioners and other technical occupations
63,123Management occupations
55,635Health technologists and technicians
Companies with federal contracts located in this zip code:
SHEFFORD-MEADE INC (649 LAMBERTSVILLE RD in STOYSTOWN, PA; small business) : $494,245 in 33 contractsfrom 2001 to 2006
Contracts for Electrical Control Equipment, Lugs, Terminals, and Terminal Strips, Switches, Nuts and Washers, and moreby Defense Logistics Agency Signed by year:2000: $0; 2001: $97,912; 2002: $0; 2003: $0; 2004: $54,089; 2005: $237,262; 2006: $104,982.
Biggest contracts:
$81,305 with Defense Logistics Agency for Electrical Control Equipment. Signed on 2005-05-31. Completion date: 2005-07-30.
$48,956 with Defense Logistics Agency for Lugs, Terminals, and Terminal Strips. Signed on 2001-02-20. Completion date: 2001-05-06.
$48,956, same as above.Signed on 2001-04-11. Completion date: 2001-06-19.
$48,314 with Defense Logistics Agency for Electrical Control Equipment. Signed on 2004-12-17. Completion date: 2005-02-15.
HIGHLAND TANK & MANUFACTURING (1 HIGHLAND RD in STOYSTOWN, PA; small business) : $168,093 in 11 contractsfrom 2001 to 2006
Contracts for Miscellaneous Prefabricated Structures, Structural Shapes, Nonferrous Base Metal, Kitchen Equipment and Appliances, Millwork, and moreby Bureau of Prisoners/Federal Prison System, Army, U.S. Coast Guard Signed by year:2000: $0; 2001: $36,000; 2002: $0; 2003: $0; 2004: $29,861; 2005: $39,865; 2006: $62,367.
Biggest contracts:
$36,000 with Bureau of Prisoners/Federal Prison System for Miscellaneous Prefabricated Structures. Signed on 2001-07-15. Completion date: 2001-08-15.
$30,611 with Bureau of Prisoners/Federal Prison System for Structural Shapes, Nonferrous Base Metal. Signed on 2005-06-09. Completion date: 2005-08-17.
$30,611 with Bureau of Prisoners/Federal Prison System for Kitchen Equipment and Appliances. Taking place in WV. Signed on 2004-12-01. Completion date: 2005-02-28.
$25,949 with Bureau of Prisoners/Federal Prison System for Kitchen Equipment and Appliances. Signed on 2006-06-16. Completion date: 2006-07-31.
Top industries in this zip code by the number of employees in 2005:
Construction: Other Heavy and Civil Engineering Construction (100-249 employees: 1 establishment)
Construction: Industrial Building Construction (100-249: 1)
Wholesale Trade: Recyclable Material Merchant Wholesalers (20-49: 1, 1-4: 1)
Management of Companies and Enterprises: Corporate, Subsidiary, and Regional Managing Offices (20-49: 1)
Mining: Bituminous Coal and Lignite Surface Mining (10-19: 2)
Other Services (except Public Administration): Religious Organizations (5-9: 2, 1-4: 3)
People in group quarters in 2010:
3 people in other noninstitutional facilities
Fatal accident statistics in 2014:
Fatal accident count: 2
Vehicles involved in fatal accidents: 3
Fatal accidents caused by drunken drivers: 0
Fatalities: 2
Persons involved in fatal accidents: 7
Pedestrians involved in fatal accidents: 0
Fatal accident statistics in 2013:
Fatal accident count: 7
Vehicles involved in fatal accidents: 14
Fatal accidents caused by drunken drivers: 5
Fatalities: 7
Persons involved in fatal accidents: 16
Pedestrians involved in fatal accidents: 0
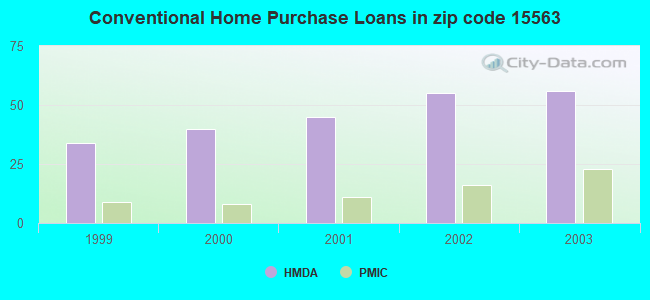
Home Mortgage Disclosure Act Aggregated Statistics For Year 2003 (Based on 6 partial tracts)
A) FHA, FSA/RHS & VA Home Purchase Loans
B) Conventional Home Purchase Loans
C) Refinancings
D) Home Improvement Loans
F) Non-occupant Loans on < 5 Family Dwellings (A B C & D)
Number
Average Value
Number
Average Value
Number
Average Value
Number
Average Value
Number
Average Value
LOANS ORIGINATED
4
$85,118
56
$98,139
220
$74,284
79
$25,563
30
$130,990
APPLICATIONS APPROVED, NOT ACCEPTED
0
$0
6
$64,475
38
$66,709
7
$23,410
1
$78,740
APPLICATIONS DENIED
1
$104,150
25
$46,675
124
$65,130
31
$19,790
7
$66,003
APPLICATIONS WITHDRAWN
0
$0
9
$68,172
52
$76,676
6
$30,638
4
$82,628
FILES CLOSED FOR INCOMPLETENESS
0
$0
2
$103,530
5
$108,212
1
$52,370
1
$130,600
Aggregated Statistics For Year 2002 (Based on 6 partial tracts)
A) FHA, FSA/RHS & VA Home Purchase Loans
B) Conventional Home Purchase Loans
C) Refinancings
D) Home Improvement Loans
F) Non-occupant Loans on < 5 Family Dwellings (A B C & D)
Number
Average Value
Number
Average Value
Number
Average Value
Number
Average Value
Number
Average Value
LOANS ORIGINATED
5
$68,936
55
$89,164
166
$69,290
60
$23,958
23
$144,846
APPLICATIONS APPROVED, NOT ACCEPTED
0
$0
6
$62,312
46
$59,997
3
$38,977
1
$90,740
APPLICATIONS DENIED
1
$124,370
16
$54,901
113
$64,596
25
$17,198
3
$109,490
APPLICATIONS WITHDRAWN
0
$0
3
$63,667
53
$76,010
3
$30,320
0
$0
FILES CLOSED FOR INCOMPLETENESS
0
$0
0
$0
12
$88,141
1
$38,370
0
$0
Aggregated Statistics For Year 2001 (Based on 6 partial tracts)
A) FHA, FSA/RHS & VA Home Purchase Loans
B) Conventional Home Purchase Loans
C) Refinancings
D) Home Improvement Loans
F) Non-occupant Loans on < 5 Family Dwellings (A B C & D)
Number
Average Value
Number
Average Value
Number
Average Value
Number
Average Value
Number
Average Value
LOANS ORIGINATED
13
$63,959
45
$75,349
162
$57,120
68
$20,486
14
$91,101
APPLICATIONS APPROVED, NOT ACCEPTED
0
$0
10
$37,000
44
$57,229
7
$33,959
0
$0
APPLICATIONS DENIED
2
$44,670
16
$40,937
113
$60,352
32
$15,588
7
$49,779
APPLICATIONS WITHDRAWN
1
$7,970
5
$41,638
59
$63,538
4
$14,700
3
$117,073
FILES CLOSED FOR INCOMPLETENESS
0
$0
0
$0
12
$67,397
0
$0
0
$0
Aggregated Statistics For Year 2000 (Based on 6 partial tracts)
A) FHA, FSA/RHS & VA Home Purchase Loans
B) Conventional Home Purchase Loans
C) Refinancings
D) Home Improvement Loans
F) Non-occupant Loans on < 5 Family Dwellings (A B C & D)
Number
Average Value
Number
Average Value
Number
Average Value
Number
Average Value
Number
Average Value
LOANS ORIGINATED
14
$56,116
40
$70,019
68
$47,865
63
$16,253
13
$82,974
APPLICATIONS APPROVED, NOT ACCEPTED
1
$16,470
8
$33,822
18
$65,214
12
$24,875
1
$54,190
APPLICATIONS DENIED
3
$24,800
46
$34,636
82
$50,398
35
$23,295
9
$16,316
APPLICATIONS WITHDRAWN
1
$35,610
6
$69,323
33
$42,445
6
$32,762
2
$109,640
FILES CLOSED FOR INCOMPLETENESS
1
$75,410
0
$0
7
$63,903
0
$0
0
$0
Aggregated Statistics For Year 1999 (Based on 3 partial tracts)
A) FHA, FSA/RHS & VA Home Purchase Loans
B) Conventional Home Purchase Loans
C) Refinancings
D) Home Improvement Loans
F) Non-occupant Loans on < 5 Family Dwellings (A B C & D)
2004 - 2018 National Fire Incident Reporting System (NFIRS) incidents
Based on the data from the years 2004 - 2018 the average number of fire incidents per year is 20. The highest number of reported fires - 40 took place in 2010, and the least - 0 in 2017. The data has a constant trend.
When looking into fire subcategories, the most reports belonged to: Structure Fires (57.1%), and Outside Fires (23.3%).
Fire incident types reported to NFIRS in Zip Code 15563


 Nearest zip codes: 15541, 15936, 15560, 15935, 15953, 15937.


 : $494,245 in 33 contracts from 2001 to 2006

 Based on the data from the years 2004 - 2018 the average number of fire incidents per year is 20. The highest number of reported fires - 40 took place in 2010, and the least - 0 in 2017. The data has a constant trend.
 When looking into fire subcategories, the most reports belonged to: Structure Fires (57.1%), and Outside Fires (23.3%).