Estimated zip code population in 2022: 4,160 Zip code population in 2010: 4,533 Zip code population in 2000: 5,323
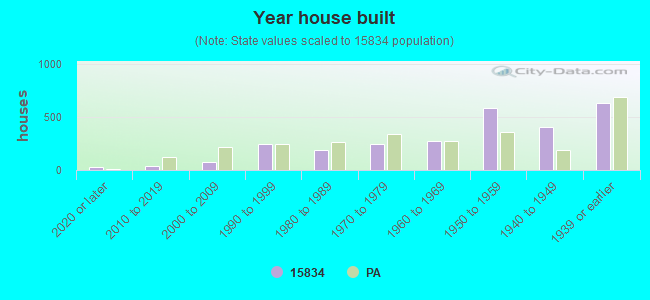
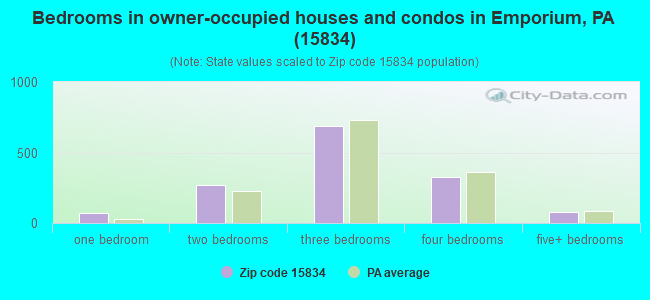
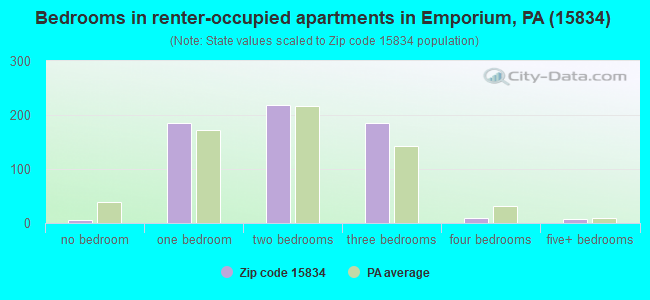
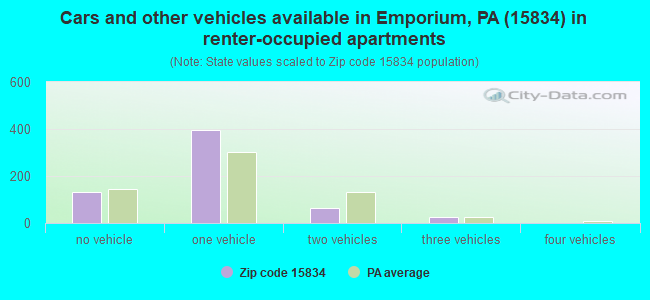
Houses and condos: 2,755 Renter-occupied apartments: 615
% of renters here:
30%
State:
31%
March 2022 cost of living index in zip code 15834: 82.1 (low, U.S. average is 100)
Land area: 204.1 sq. mi. Water area: 0.6 sq. mi.
Population density: 20 people per square mile
(very low).
OSM Map
General Map
Google Map
MSN Map
OSM Map
General Map
Google Map
MSN Map
OSM Map
General Map
Google Map
MSN Map
OSM Map
General Map
Google Map
MSN Map
Please wait while loading the map...
Real estate property taxes paid for housing units in 2022:
This zip code:
1.5% ($1,391)
Pennsylvania:
1.3% ($3,094)
Median real estate property taxes paid for housing units with mortgages in 2022: $1,470 (1.6%) Median real estate property taxes paid for housing units with no mortgage in 2022: $1,338 (1.5%)
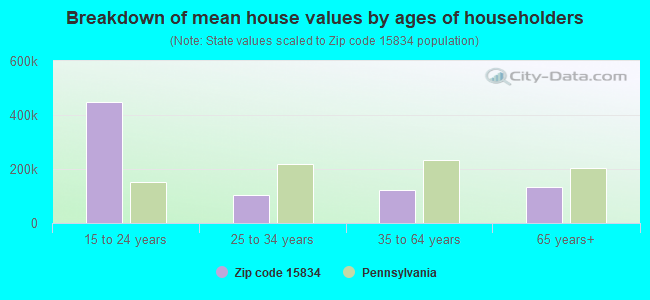
Estimated median house/condo value in 2022: $91,493
15834:
$91,493
Pennsylvania:
$245,500
According to our research of Pennsylvania and other state lists, there were 9 registered sex offenders living in 15834 zip code as of April 24, 2024. The ratio of all residents to sex offenders in zip code 15834 is 488 to 1. The ratio of registered sex offenders to all residents in this zip code is near the state average.
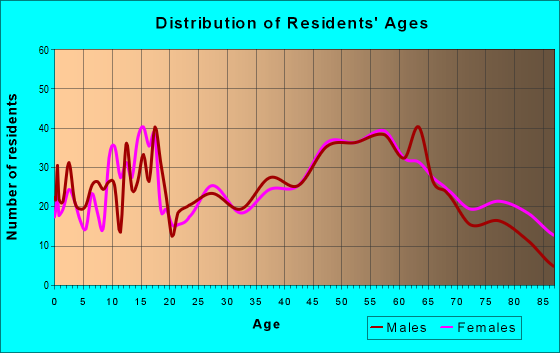
Median resident age:
This zip code:
50.8 years
Pennsylvania median age:
40.9 years
Average household size:
This zip code:
2.0 people
Pennsylvania:
2.4 people
Averages for the 2020 tax year for zip code 15834, filed in 2021:
Average Adjusted Gross Income (AGI) in 2020: $46,323 (Individual Income Tax Returns)
Here:
$46,323
State:
$75,707
Salary/wage: $37,708 (reported on 75.2% of returns)
Here:
$37,708
State:
$62,806
(% of AGI for various income ranges: 941.4% for AGIs below $25k, 2998.0% for AGIs $25k-50k, 5401.7% for AGIs $50k-75k, 7155.0% for AGIs $75k-100k, 18041.0% for AGIs $100k-200k)
Taxable interest for individuals: $1,052 (reported on 30.1% of returns)
This zip code:
$1,052
Pennsylvania:
$1,633
(% of AGI for various income ranges: 18.9% for AGIs below $25k, 15.3% for AGIs $25k-50k, 22.5% for AGIs $50k-75k, 60.8% for AGIs $75k-100k, 348.0% for AGIs $100k-200k)
Ordinary dividends: $4,339 (reported on 19.9% of returns)
Here:
$4,339
State:
$7,382
(% of AGI for various income ranges: 40.0% for AGIs below $25k, 54.7% for AGIs $25k-50k, 71.7% for AGIs $50k-75k, 235.0% for AGIs $75k-100k, 851.0% for AGIs $100k-200k)
Net capital gain/loss in AGI: +$8,968 (reported on 13.6% of returns)
Here:
+$8,968
State:
+$23,522
(% of AGI for various income ranges: 8.2% for AGIs below $25k, 24.0% for AGIs $25k-50k, 75.8% for AGIs $50k-75k, 250.0% for AGIs $75k-100k, 1874.0% for AGIs $100k-200k)
Profit/loss from business: +$9,200 (reported on 8.7% of returns)
Here:
+$9,200
State:
+$16,274
(% of AGI for various income ranges: 63.3% for AGIs below $25k, 67.6% for AGIs $25k-50k, 193.8% for AGIs $50k-75k, 526.0% for AGIs $100k-200k)
Taxable individual retirement arrangement distribution: $15,710 (reported on 14.1% of returns)
15834:
$15,710
Pennsylvania:
$18,583
(% of AGI for various income ranges: 125.3% for AGIs below $25k, 133.3% for AGIs $25k-50k, 347.5% for AGIs $50k-75k, 396.7% for AGIs $75k-100k, 1932.0% for AGIs $100k-200k)
Total itemized deductions: $29,550 (reported on 1.0% of returns)
Here:
$29,550
State:
$34,850
(% of AGI for various income ranges: 131.3% for AGIs $25k-50k)
Taxes paid: $5,550 (reported on 1.0% of returns)
15834:
$5,550
State:
$8,200
(% of AGI for various income ranges: 24.7% for AGIs $25k-50k)
Earned income credit: $2,203 (reported on 15.0% of returns)
Here:
$2,203
State:
$2,100
(% of AGI for various income ranges: 75.6% for AGIs below $25k, 56.0% for AGIs $25k-50k)
Percentage of individuals using paid preparers for their 2020 taxes: 94.2%
Here:
94%
State:
92%
(% for various income ranges: 91.7% for AGIs below $25k, 96.3% for AGIs $25k-50k, 90.6% for AGIs $50k-75k, 100.0% for AGIs $75k-100k, 100.0% for AGIs $100k-200k, 100.0% for AGIs over 200k)
Averages for the 2012 tax year for zip code 15834, filed in 2013:
Average Adjusted Gross Income (AGI) in 2012: $40,041 (Individual Income Tax Returns)
Here:
$40,041
State:
$61,346
Salary/wage: $34,322 (reported on 81.7% of returns)
Here:
$34,322
State:
$51,902
(% of AGI for various income ranges: 68.9% for AGIs below $25k, 73.8% for AGIs $25k-50k, 78.8% for AGIs $50k-75k, 74.6% for AGIs $75k-100k, 87.1% for AGIs $100k-200k)
Taxable interest for individuals: $1,351 (reported on 34.8% of returns)
This zip code:
$1,351
Pennsylvania:
$1,588
(% of AGI for various income ranges: 1.7% for AGIs below $25k, 0.9% for AGIs $25k-50k, 0.5% for AGIs $50k-75k, 1.4% for AGIs $75k-100k, 2.3% for AGIs $100k-200k)
Ordinary dividends: $4,063 (reported on 23.2% of returns)
Here:
$4,063
State:
$5,827
(% of AGI for various income ranges: 3.0% for AGIs below $25k, 1.5% for AGIs $25k-50k, 1.5% for AGIs $50k-75k, 0.8% for AGIs $75k-100k, 6.7% for AGIs $100k-200k)
Net capital gain/loss in AGI: +$3,362 (reported on 11.6% of returns)
Here:
+$3,362
State:
+$14,495
(% of AGI for various income ranges: 0.2% for AGIs $25k-50k, 0.8% for AGIs $50k-75k, 4.6% for AGIs $100k-200k)
Profit/loss from business: +$12,604 (reported on 10.3% of returns)
Here:
+$12,604
State:
+$16,268
(% of AGI for various income ranges: 4.2% for AGIs below $25k, 4.3% for AGIs $25k-50k, 2.5% for AGIs $50k-75k, 0.5% for AGIs $75k-100k, 5.8% for AGIs $100k-200k)
Taxable individual retirement arrangement distribution: $10,755 (reported on 14.7% of returns)
15834:
$10,755
Pennsylvania:
$14,550
(% of AGI for various income ranges: 6.0% for AGIs below $25k, 3.4% for AGIs $25k-50k, 2.3% for AGIs $50k-75k, 5.1% for AGIs $75k-100k, 6.0% for AGIs $100k-200k)
Total itemized deductions: $17,816 (19% of AGI, reported on 11.2% of returns)
Here:
$17,816
State:
$23,538
Here:
18.9% of AGI
State:
18.4% of AGI
(% of AGI for various income ranges: 4.8% for AGIs below $25k, 3.6% for AGIs $25k-50k, 3.5% for AGIs $50k-75k, 3.8% for AGIs $75k-100k, 7.1% for AGIs $100k-200k, 9.8% for AGIs over 200k)
Charity contributions: $3,739 (reported on 8.0% of returns)
Here:
$3,739
State:
$4,025
(% of AGI for various income ranges: 0.8% for AGIs $25k-50k, 0.6% for AGIs $50k-75k, 0.5% for AGIs $75k-100k, 1.9% for AGIs $100k-200k)
Taxes paid: $6,708 (reported on 11.2% of returns)
15834:
$6,708
State:
$9,982
(% of AGI for various income ranges: 0.5% for AGIs below $25k, 1.0% for AGIs $25k-50k, 1.2% for AGIs $50k-75k, 1.4% for AGIs $75k-100k, 3.2% for AGIs $100k-200k, 6.1% for AGIs over 200k)
Earned income credit: $2,007 (reported on 18.3% of returns)
Here:
$2,007
State:
$2,106
(% of AGI for various income ranges: 5.0% for AGIs below $25k, 0.9% for AGIs $25k-50k)
Percentage of individuals using paid preparers for their 2012 taxes: 50.4%
Here:
50%
State:
53%
(% for various income ranges: 44.2% for AGIs below $25k, 50.0% for AGIs $25k-50k, 57.1% for AGIs $50k-75k, 62.5% for AGIs $75k-100k, 83.3% for AGIs $100k-200k)
Averages for the 2004 tax year for zip code 15834, filed in 2005:
Average Adjusted Gross Income (AGI) in 2004: $33,320 (Individual Income Tax Returns)
Here:
$33,320
State:
$48,049
Salary/wage: $30,646 (reported on 81.2% of returns)
Here:
$30,646
State:
$42,646
(% of AGI for various income ranges: 84.9% for AGIs below $10k, 63.5% for AGIs $10k-25k, 81.0% for AGIs $25k-50k, 83.3% for AGIs $50k-75k, 81.4% for AGIs $75k-100k, 52.3% for AGIs over 100k)
Taxable interest for individuals: $1,764 (reported on 45.1% of returns)
This zip code:
$1,764
Pennsylvania:
$1,657
(% of AGI for various income ranges: 6.0% for AGIs below $10k, 4.6% for AGIs $10k-25k, 1.6% for AGIs $25k-50k, 1.0% for AGIs $50k-75k, 1.0% for AGIs $75k-100k, 4.6% for AGIs over 100k)
Taxable dividends: $3,418 (reported on 27.4% of returns)
Here:
$3,418
State:
$3,566
(% of AGI for various income ranges: 4.2% for AGIs below $10k, 3.7% for AGIs $10k-25k, 1.3% for AGIs $25k-50k, 1.3% for AGIs $50k-75k, 1.4% for AGIs $75k-100k, 7.9% for AGIs over 100k)
Net capital gain/loss: +$4,653 (reported on 17.2% of returns)
Here:
+$4,653
State:
+$9,716
(% of AGI for various income ranges: -1.3% for AGIs below $10k, 0.5% for AGIs $10k-25k, 0.6% for AGIs $25k-50k, 0.9% for AGIs $50k-75k, 2.3% for AGIs $75k-100k, 10.0% for AGIs over 100k)
Profit/loss from business: +$7,284 (reported on 11.5% of returns)
Here:
+$7,284
State:
+$14,267
(% of AGI for various income ranges: 6.0% for AGIs below $10k, 5.2% for AGIs $10k-25k, 2.4% for AGIs $25k-50k, 0.4% for AGIs $50k-75k, 3.6% for AGIs $75k-100k, 2.1% for AGIs over 100k)
IRA payment deduction: $2,098 (reported on 2.5% of returns)
15834:
$2,098
Pennsylvania:
$2,903
Total itemized deductions: $15,477 (21% of AGI, reported on 13.6% of returns)
Here:
$15,477
State:
$18,804
Here:
21.4% of AGI
State:
19.5% of AGI
(% of AGI for various income ranges: 6.1% for AGIs below $10k, 5.9% for AGIs $10k-25k, 4.6% for AGIs $25k-50k, 5.1% for AGIs $50k-75k, 8.2% for AGIs $75k-100k, 9.6% for AGIs over 100k)
Charity contributions deductions: $2,808 (4% of AGI, reported on 11.0% of returns)
Here:
$2,808
State:
$3,337
Here:
3.6% of AGI
State:
3.3% of AGI
(% of AGI for various income ranges: 0.8% for AGIs $10k-25k, 0.5% for AGIs $25k-50k, 0.8% for AGIs $50k-75k, 1.1% for AGIs $75k-100k, 2.0% for AGIs over 100k)
Total tax: $4,264 (reported on 70.9% of returns)
15834:
$4,264
State:
$8,008
(% of AGI for various income ranges: 2.0% for AGIs below $10k, 4.2% for AGIs $10k-25k, 7.0% for AGIs $25k-50k, 8.0% for AGIs $50k-75k, 10.6% for AGIs $75k-100k, 18.1% for AGIs over 100k)
Earned income credit: $1,607 (reported on 14.0% of returns)
Here:
$1,607
State:
$1,643
Percentage of individuals using paid preparers for their 2004 taxes: 60.5%
Here:
60%
State:
56%
(% for various income ranges: 54.9% for AGIs below $10k, 59.6% for AGIs $10k-25k, 61.3% for AGIs $25k-50k, 60.3% for AGIs $50k-75k, 77.9% for AGIs $75k-100k, 74.3% for AGIs over 100k)
Likely homosexual households (counted as self-reported same-sex unmarried-partner households)
Lesbian couples: 0.2% of all households
Gay men: 0.0% of all households
Household received Food Stamps/SNAP in the past 12 months: 547 Household did not receive Food Stamps/SNAP in the past 12 months: 1,518
Women who had a birth in the past 12 months: 21 (0 now married, 18 unmarried) Women who did not have a birth in the past 12 months: 707 (233 now married, 475 unmarried)
Housing units in zip code 15834 with a mortgage: 547 (53 second mortgage, 40 both second mortgage and home equity loan) Houses without a mortgage: 32
Median monthly owner costs for units with a mortgage: $1,006 Median monthly owner costs for units without a mortgage: $457
Residents with income below the poverty level in 2022:
This zip code:
15.2%
Whole state:
11.8%
Residents with income below 50% of the poverty level in 2022:
This zip code:
10.5%
Whole state:
6.1%
Median number of rooms in houses and condos:
Here:
6.8
State:
6.8
Median number of rooms in apartments:
Here:
5.0
State:
4.3
Notable locations in this zip code not listed on our city pages
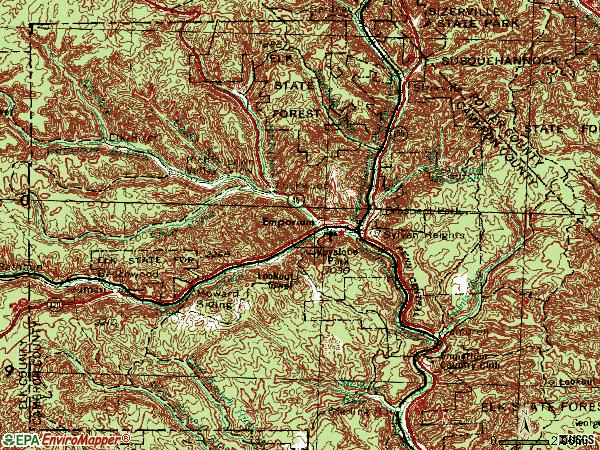
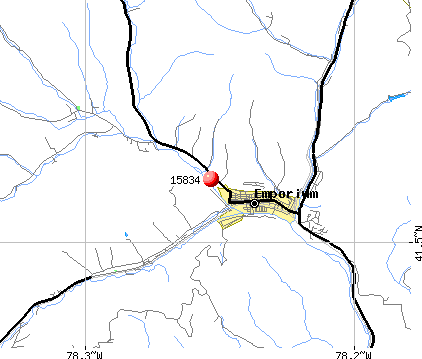
Notable locations in zip code 15834: Emporium Junction (A), Canoe Run (B), Lewis Run (C), Elk River (D), Department of Conservation and Natural Resources Elk District 13 (E), Emporium Fire Department (F). Display/hide their locations on the map
Streams, rivers, and creeks: Hunts Run (A), Russell Hollow Run (B), Rock Run (C), Frenchmans Branch (D), Gillis Bliss Run (E), Bear Run (F), State Road Branch (G), North Creek (H), Bender Run (I). Display/hide their locations on the map
In group quarters: 60 (-1 institutionalized population)
Size of family households: 726 2-persons, 226 3-persons, 108 4-persons, 74 5-persons, 35 6-persons, 23 7-or-more-persons
Size of nonfamily households: 733 1-person, 123 2-persons, 8 3-persons
305 married couples with children.
291 single-parent households (133 men, 158 women).
97.3% of residents of 15834 zip code speak English at home.
2.1% of residents speak Spanish at home (48% very well, 52% well).
0.4% of residents speak other Indo-European language at home (100% very well).
0.1% of residents speak Asian or Pacific Island language at home (100% well).
0.1% of residents speak other language at home (100% very well).
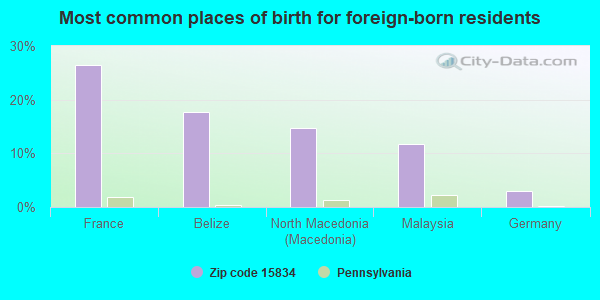
Foreign born population: 34 (0.8%) (70.5% of them are naturalized citizens)
This zip code:
0.8%
Whole state:
7.5%
26%France
18%Belize
15%North Macedonia (Macedonia)
12%Malaysia
3%Germany
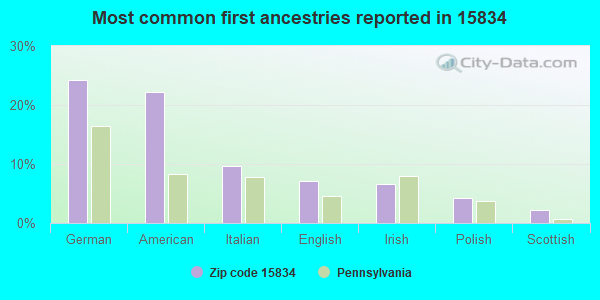
24%German
22%American
10%Italian
7%English
7%Irish
4%Polish
2%Scottish
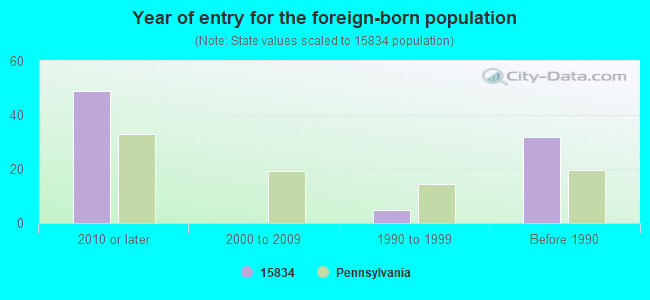
Year of entry for the foreign-born population
492010 or later
02000 to 2009
51990 to 1999
32Before 1990
Facilities with environmental interests located in this zip code:
AMER SINTERED TECH (513 E. SECOND ST. in EMPORIUM, PA)
AIR MINOR (AIRS/AFS) STATE MASTER (Pennsylvania database) - RCRIS-PAR000008904, HAZARDOUS WASTE PROGRAM, AFS-36-1058780-2, AIR PROGRAM Conditionally Exempt Small Quantity Generators, less than 100 kg/month of hazardous waste (Resource Conservation and Recovery Act (tracking hazardous waste)) - notification TRI REPORTER (Tracking of toxic chemicals releasing facilities) Business SIC classification: PRIMARY METAL PRODUCTS; FABRICATED METAL PRODUCTS Organizations: AMERICAN SINTERED TECH INC (CONTACT/OWNER)
, AMERICAN SINTERED TECHNOLOGIES (CONTACT/OWNER)
Alternative names: AMERICAN SINTERED TECH. S. INC.
BAREN STREET PLANT (RR 2 BOX 47 in EMPORIUM, PA)
National Pollutant Discharge Elimination System NON-MAJOR (Tracking pollutant discharge elimination systems) - permit Business SIC classification: PRIMARY METAL PRODUCTS Alternative names: SINTER METALS INC EMPORIUM - B
Housing units lacking complete plumbing facilities: 10.1% Housing units lacking complete kitchen facilities: 6.7%
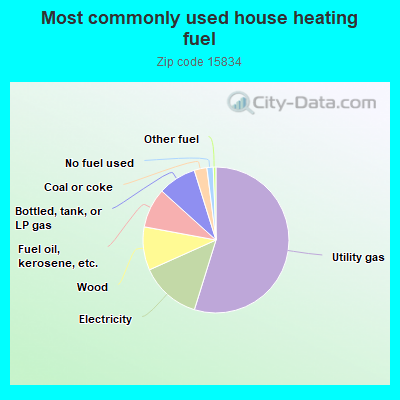
54.8%Utility gas
13.5%Electricity
9.6%Wood
8.8%Fuel oil, kerosene, etc.
8.5%Bottled, tank, or LP gas
2.8%Coal or coke
1.4%No fuel used
0.6%Other fuel
Population in 1990: 5,219. Population change in the 1990s: +104 (+2.0%).
Place of birth for U.S.-born residents:
This state: 3,499
Northeast: 231
Midwest: 129
South: 131
West: 62
70% of the 15834 zip code residents lived in the same house 5 years ago. Out of people who lived in different houses, 64% lived in this county. Out of people who lived in different counties, 50% lived in Pennsylvania.
94% of the 15834 zip code residents lived in the same house 1 year ago. Out of people who lived in different houses, 51% moved from this county. Out of people who lived in different houses, 31% moved from different county within same state. Out of people who lived in different houses, 15% moved from different state. Out of people who lived in different houses, 5% moved from abroad.
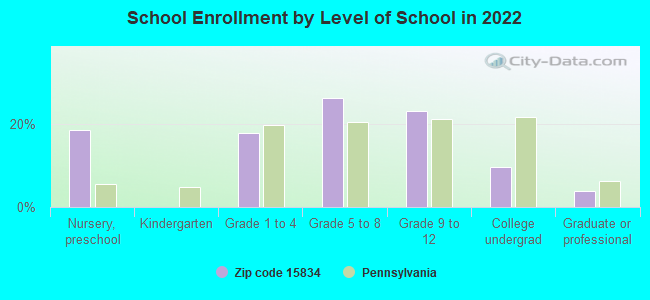
Private vs. public school enrollment:
Students in private schools in grades 1 to 8 (elementary and middle school): 6
Here:
1.8%
Pennsylvania:
15.7%
Students in private schools in grades 9 to 12 (high school): 23
Here:
13.8%
Pennsylvania:
13.4%
Students in private undergraduate colleges: 20
Here:
28.3%
Pennsylvania:
39.8%
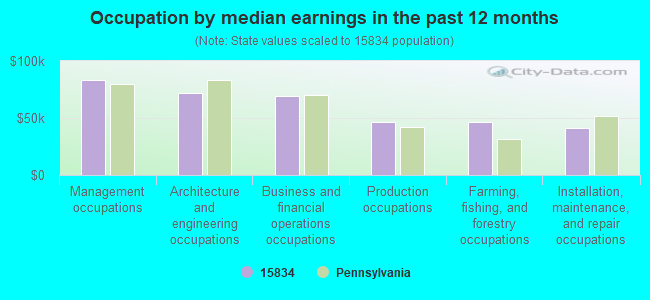
Occupation by median earnings in the past 12 months ($)
83,648Management occupations
72,068Architecture and engineering occupations
69,042Business and financial operations occupations
46,855Production occupations
46,326Farming, fishing, and forestry occupations
41,224Installation, maintenance, and repair occupations
Top industries in this zip code by the number of employees in 2005:
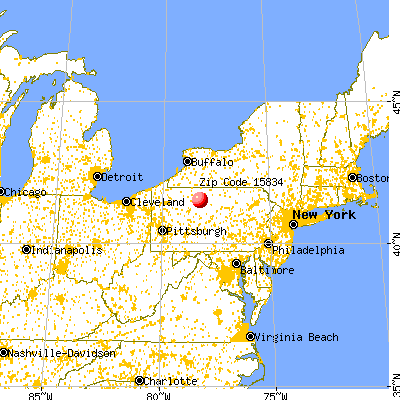


 Nearest zip codes: 15821, 15868, 15857, 15832, 16724, 15870.