Estimated zip code population in 2022: 1,524 Zip code population in 2010: 1,535 Zip code population in 2000: 1,687
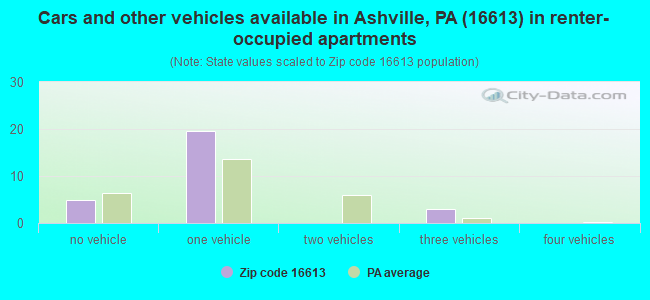
Houses and condos: 756 Renter-occupied apartments: 27
% of renters here:
4%
State:
31%
March 2022 cost of living index in zip code 16613: 90.2 (less than average, U.S. average is 100)
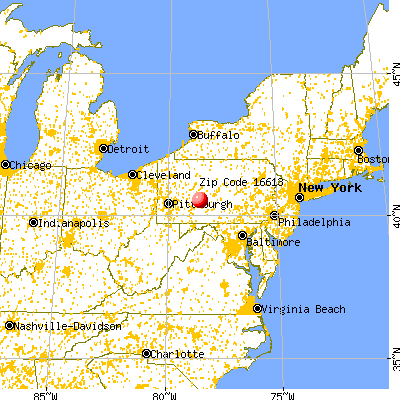
Land area: 25.6 sq. mi. Water area: 0.0 sq. mi.
Population density: 59 people per square mile
(very low).
OSM Map
General Map
Google Map
MSN Map
OSM Map
General Map
Google Map
MSN Map
OSM Map
General Map
Google Map
MSN Map
OSM Map
General Map
Google Map
MSN Map
Please wait while loading the map...
Real estate property taxes paid for housing units in 2022:
This zip code:
0.9% ($1,376)
Pennsylvania:
1.3% ($3,094)
Median real estate property taxes paid for housing units with mortgages in 2022: $1,659 (0.9%) Median real estate property taxes paid for housing units with no mortgage in 2022: $1,282 (1.0%)
Business Search- 14 Million verified businesses
Males: 674
(44.3%)
Females: 850
(55.7%)
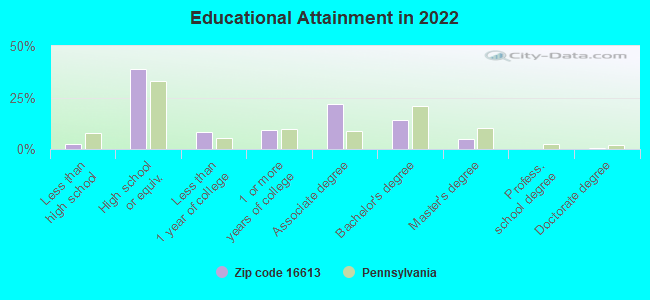
For population 25 years and over in 16613:
High school or higher: 97.2%
Bachelor's degree or higher: 19.4%
Graduate or professional degree: 5.3%
Unemployed: 3.9%
Mean travel time to work (commute): 25.5 minutes
For population 15 years and over in 16613:
Never married: 23.7%
Now married: 54.1%
Separated: 1.3%
Widowed: 6.9%
Divorced: 14.1%
Zip code 16613 compared to state average:
Median house value below state average.
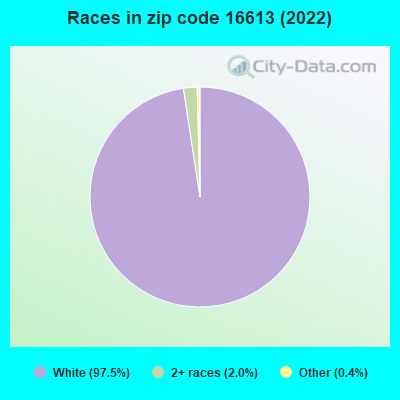
Black race population percentage significantly below state average.
Hispanic race population percentage significantly below state average.
Median age significantly above state average.
Foreign-born population percentage significantly below state average.
Renting percentage significantly below state average.
Length of stay since moving in significantly above state average.
Number of college students below state average.
Percentage of population with a bachelor's degree or higher below state average.
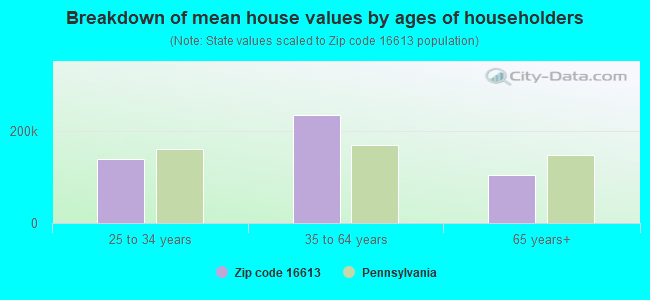
Estimated median house/condo value in 2022: $147,712
16613:
$147,712
Pennsylvania:
$245,500
Median resident age:
This zip code:
50.1 years
Pennsylvania median age:
40.9 years
Average household size:
This zip code:
2.3 people
Pennsylvania:
2.4 people
Averages for the 2020 tax year for zip code 16613, filed in 2021:
Average Adjusted Gross Income (AGI) in 2020: $54,893 (Individual Income Tax Returns)
Here:
$54,893
State:
$75,707
Salary/wage: $53,769 (reported on 77.3% of returns)
Here:
$53,769
State:
$62,806
(% of AGI for various income ranges: 838.1% for AGIs below $25k, 3246.4% for AGIs $25k-50k, 5387.0% for AGIs $50k-75k, 9540.0% for AGIs $75k-100k, 14189.0% for AGIs $100k-200k)
Taxable interest for individuals: $538 (reported on 32.0% of returns)
This zip code:
$538
Pennsylvania:
$1,633
(% of AGI for various income ranges: 15.6% for AGIs below $25k, 42.1% for AGIs $25k-50k, 34.0% for AGIs $50k-75k, 3.3% for AGIs $75k-100k, 9.0% for AGIs $100k-200k)
Ordinary dividends: $1,258 (reported on 16.0% of returns)
Here:
$1,258
State:
$7,382
(% of AGI for various income ranges: 41.9% for AGIs below $25k, 53.0% for AGIs $50k-75k, 31.0% for AGIs $100k-200k)
Net capital gain/loss in AGI: +$1,800 (reported on 14.7% of returns)
Here:
+$1,800
State:
+$23,522
(% of AGI for various income ranges: 21.9% for AGIs below $25k, 95.0% for AGIs $50k-75k, 68.0% for AGIs $100k-200k)
Profit/loss from business: +$4,250 (reported on 8.0% of returns)
Here:
+$4,250
State:
+$16,274
(% of AGI for various income ranges: 113.6% for AGIs $25k-50k, 160.0% for AGIs $75k-100k)
Taxable individual retirement arrangement distribution: $10,538 (reported on 10.7% of returns)
16613:
$10,538
Pennsylvania:
$18,583
(% of AGI for various income ranges: 160.6% for AGIs below $25k, 586.0% for AGIs $50k-75k)
Earned income credit: $2,300 (reported on 9.3% of returns)
Here:
$2,300
State:
$2,100
(% of AGI for various income ranges: 61.3% for AGIs below $25k, 45.0% for AGIs $25k-50k)
Percentage of individuals using paid preparers for their 2020 taxes: 93.3%
Here:
93%
State:
92%
(% for various income ranges: 95.7% for AGIs below $25k, 88.9% for AGIs $25k-50k, 92.3% for AGIs $50k-75k, 100.0% for AGIs $75k-100k, 92.3% for AGIs $100k-200k)
Averages for the 2012 tax year for zip code 16613, filed in 2013:
Average Adjusted Gross Income (AGI) in 2012: $44,536 (Individual Income Tax Returns)
Here:
$44,536
State:
$61,346
Salary/wage: $43,192 (reported on 84.0% of returns)
Here:
$43,192
State:
$51,902
(% of AGI for various income ranges: 65.9% for AGIs below $25k, 77.3% for AGIs $25k-50k, 81.7% for AGIs $50k-75k, 86.4% for AGIs $75k-100k, 86.9% for AGIs $100k-200k)
Taxable interest for individuals: $428 (reported on 33.3% of returns)
This zip code:
$428
Pennsylvania:
$1,588
(% of AGI for various income ranges: 0.8% for AGIs below $25k, 0.6% for AGIs $25k-50k, 0.2% for AGIs $50k-75k, 0.1% for AGIs $75k-100k, 0.2% for AGIs $100k-200k)
Ordinary dividends: $733 (reported on 16.0% of returns)
Here:
$733
State:
$5,827
(% of AGI for various income ranges: 0.6% for AGIs below $25k, 0.4% for AGIs $25k-50k, 0.2% for AGIs $50k-75k, 0.2% for AGIs $75k-100k)
Net capital gain/loss in AGI: +$1,250 (reported on 8.0% of returns)
Here:
+$1,250
State:
+$14,495
Profit/loss from business: +$4,012 (reported on 10.7% of returns)
Here:
+$4,012
State:
+$16,268
Taxable individual retirement arrangement distribution: $7,120 (reported on 6.7% of returns)
16613:
$7,120
Pennsylvania:
$14,550
Total itemized deductions: $16,238 (23% of AGI, reported on 17.3% of returns)
Here:
$16,238
State:
$23,538
Here:
22.9% of AGI
State:
18.4% of AGI
(% of AGI for various income ranges: 7.2% for AGIs $25k-50k, 4.5% for AGIs $50k-75k, 7.2% for AGIs $75k-100k, 9.6% for AGIs $100k-200k)
Charity contributions: $2,133 (reported on 12.0% of returns)
Here:
$2,133
State:
$4,025
(% of AGI for various income ranges: 1.2% for AGIs $25k-50k, 0.9% for AGIs $75k-100k, 0.6% for AGIs $100k-200k)
Taxes paid: $4,600 (reported on 17.3% of returns)
16613:
$4,600
State:
$9,982
(% of AGI for various income ranges: 1.4% for AGIs $25k-50k, 1.3% for AGIs $50k-75k, 2.2% for AGIs $75k-100k, 3.2% for AGIs $100k-200k)
Earned income credit: $1,925 (reported on 10.7% of returns)
Here:
$1,925
State:
$2,106
(% of AGI for various income ranges: 3.1% for AGIs below $25k, 0.8% for AGIs $25k-50k)
Percentage of individuals using paid preparers for their 2012 taxes: 56.0%
Here:
56%
State:
53%
(% for various income ranges: 50.0% for AGIs below $25k, 57.9% for AGIs $25k-50k, 69.2% for AGIs $50k-75k, 50.0% for AGIs $75k-100k, 60.0% for AGIs $100k-200k)
Averages for the 2004 tax year for zip code 16613, filed in 2005:
Average Adjusted Gross Income (AGI) in 2004: $34,453 (Individual Income Tax Returns)
Here:
$34,453
State:
$48,049
Salary/wage: $33,403 (reported on 87.1% of returns)
Here:
$33,403
State:
$42,646
(% of AGI for various income ranges: 71.1% for AGIs below $10k, 74.1% for AGIs $10k-25k, 86.4% for AGIs $25k-50k, 90.1% for AGIs $50k-75k, 86.9% for AGIs $75k-100k, 71.5% for AGIs over 100k)
Taxable interest for individuals: $485 (reported on 44.6% of returns)
This zip code:
$485
Pennsylvania:
$1,657
(% of AGI for various income ranges: 3.7% for AGIs below $10k, 1.5% for AGIs $10k-25k, 0.7% for AGIs $25k-50k, 0.2% for AGIs $50k-75k, 0.1% for AGIs $75k-100k, 0.5% for AGIs over 100k)
Taxable dividends: $515 (reported on 18.5% of returns)
Here:
$515
State:
$3,566
(% of AGI for various income ranges: 2.7% for AGIs below $10k, 0.1% for AGIs $10k-25k, 0.4% for AGIs $25k-50k, 0.1% for AGIs $50k-75k, 0.2% for AGIs $75k-100k)
Net capital gain/loss: +$1,073 (reported on 11.2% of returns)
Here:
+$1,073
State:
+$9,716
(% of AGI for various income ranges: -0.6% for AGIs below $10k, -0.4% for AGIs $10k-25k, 0.0% for AGIs $25k-50k, 1.3% for AGIs $50k-75k, -0.0% for AGIs $75k-100k)
Profit/loss from business: +$4,889 (reported on 11.0% of returns)
Here:
+$4,889
State:
+$14,267
(% of AGI for various income ranges: 8.2% for AGIs below $10k, 4.6% for AGIs $10k-25k, 1.4% for AGIs $25k-50k, 1.2% for AGIs $50k-75k)
IRA payment deduction: $2,692 (reported on 1.8% of returns)
16613:
$2,692
Pennsylvania:
$2,903
Total itemized deductions: $13,627 (20% of AGI, reported on 16.1% of returns)
Here:
$13,627
State:
$18,804
Here:
20.4% of AGI
State:
19.5% of AGI
(% of AGI for various income ranges: 4.8% for AGIs $25k-50k, 8.4% for AGIs $50k-75k, 8.8% for AGIs $75k-100k, 10.0% for AGIs over 100k)
Charity contributions deductions: $1,489 (2% of AGI, reported on 12.8% of returns)
Here:
$1,489
State:
$3,337
Here:
2.1% of AGI
State:
3.3% of AGI
(% of AGI for various income ranges: 0.2% for AGIs $25k-50k, 0.6% for AGIs $50k-75k, 0.9% for AGIs $75k-100k, 1.8% for AGIs over 100k)
Total tax: $3,705 (reported on 71.4% of returns)
16613:
$3,705
State:
$8,008
(% of AGI for various income ranges: 1.9% for AGIs below $10k, 4.1% for AGIs $10k-25k, 6.1% for AGIs $25k-50k, 7.4% for AGIs $50k-75k, 10.6% for AGIs $75k-100k, 15.0% for AGIs over 100k)
Earned income credit: $1,462 (reported on 14.4% of returns)
Here:
$1,462
State:
$1,643
Percentage of individuals using paid preparers for their 2004 taxes: 60.1%
Here:
60%
State:
56%
(% for various income ranges: 45.4% for AGIs below $10k, 58.0% for AGIs $10k-25k, 64.3% for AGIs $25k-50k, 73.8% for AGIs $50k-75k, 60.4% for AGIs $75k-100k, 66.7% for AGIs over 100k)
Household received Food Stamps/SNAP in the past 12 months: 70 Household did not receive Food Stamps/SNAP in the past 12 months: 605
Women who had a birth in the past 12 months: 3 (3 now married, 0 unmarried) Women who did not have a birth in the past 12 months: 299 (131 now married, 167 unmarried)
Housing units in zip code 16613 with a mortgage: 265 (49 second mortgage, 46 both second mortgage and home equity loan) Houses without a mortgage: 22
Median monthly owner costs for units with a mortgage: $1,353 Median monthly owner costs for units without a mortgage: $358
Residents with income below the poverty level in 2022:
This zip code:
2.7%
Whole state:
11.8%
Residents with income below 50% of the poverty level in 2022:
This zip code:
1.7%
Whole state:
6.1%
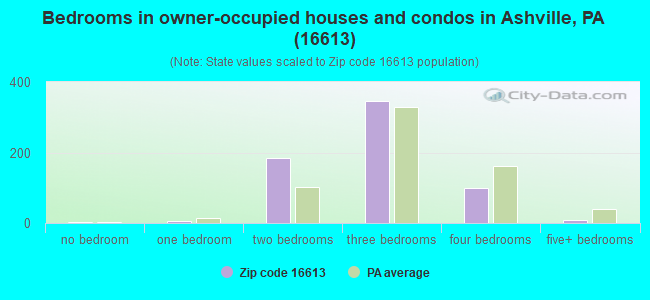
Median number of rooms in houses and condos:
Here:
6.1
State:
6.8
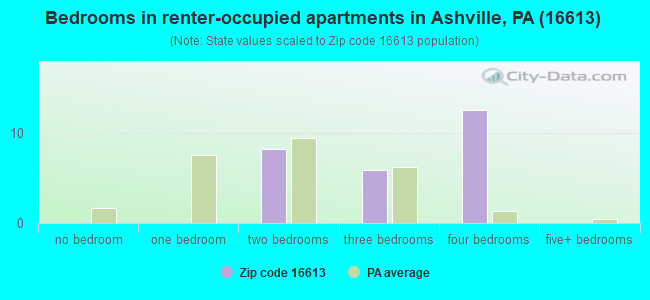
Median number of rooms in apartments:
Here:
6.2
State:
4.3
Notable locations in this zip code not listed on our city pages
Notable locations in zip code 16613: South Burgoon Gap (A), Burgoons Gap (B), Ashville Volunteer Fire Company 1 (C). Display/hide their locations on the map
Size of family households: 222 2-persons, 104 3-persons, 41 4-persons, 36 5-persons, 11 6-persons
Size of nonfamily households: 235 1-person, 26 2-persons
198 married couples with children.
40 single-parent households (5 men, 35 women).
98.3% of residents of 16613 zip code speak English at home.
1.5% of residents speak Spanish at home (64% very well, 36% well).
Foreign born population: 3 (0.2%) (0.0% of them are naturalized citizens)
:
0.2%
Whole state:
7.5%
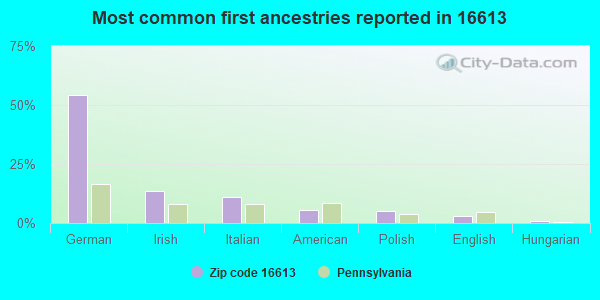
54%German
14%Irish
11%Italian
5%American
5%Polish
3%English
1%Hungarian
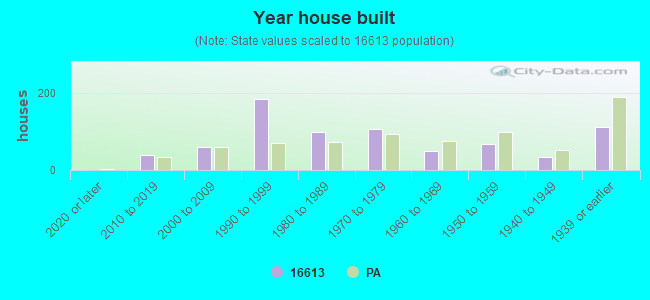
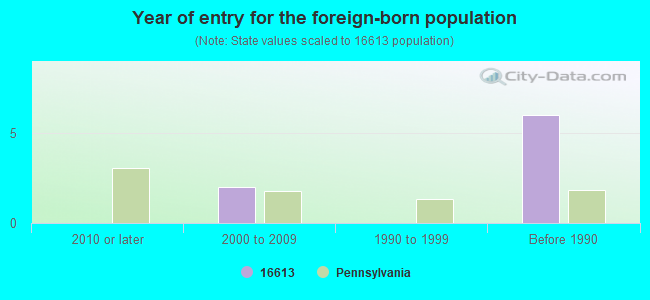
Year of entry for the foreign-born population
02010 or later
22000 to 2009
01990 to 1999
6Before 1990
Facilities with environmental interests located in this zip code:
ASHVILLE BORO STP (ROUTE 36 in ASHVILLE, PA)
STATE MASTER (Pennsylvania database) - PCS-PA0095621, National Pollutant Discharge Elimination System Permit National Pollutant Discharge Elimination System NON-MAJOR (Tracking pollutant discharge elimination systems) - permit Business SIC classification: SEWERAGE SYSTEMS Alternative names: ASHVILLE BOROUGH COUNCIL
AT & T LONG LINES EQUIP ENGR (2.5 M NE OF BUCKHORN in ASHVILLE, PA)
AUTO WORKS UNLIMITED (1666 LIBERTY ST in ASHVILLE, PA)
Conditionally Exempt Small Quantity Generators, less than 100 kg/month of hazardous waste (Resource Conservation and Recovery Act (tracking hazardous waste)) - notification Organizations: SLEBODNICK JOE (CONTACT/OWNER)
Housing units lacking complete plumbing facilities: 2.7% Housing units lacking complete kitchen facilities: 3.7%
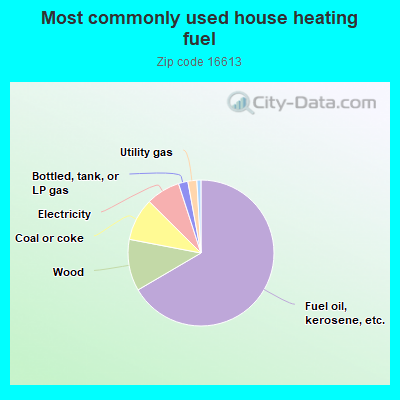
66.9%Fuel oil, kerosene, etc.
11.5%Wood
9.5%Coal or coke
7.6%Electricity
2.1%Bottled, tank, or LP gas
2.0%Utility gas
0.9%Other fuel
Population in 1990: 1,275. Population change in the 1990s: +412 (+32.3%).
Place of birth for U.S.-born residents:
This state: 1,437
Northeast: 12
Midwest: 21
South: 22
West: 6
77% of the 16613 zip code residents lived in the same house 5 years ago. Out of people who lived in different houses, 59% lived in this county. Out of people who lived in different counties, 50% lived in Pennsylvania.
100% of the 16613 zip code residents lived in the same house 1 year ago. Out of people who lived in different houses, 100% moved from different county within same state. Out of people who lived in different houses, 200% moved from different state.
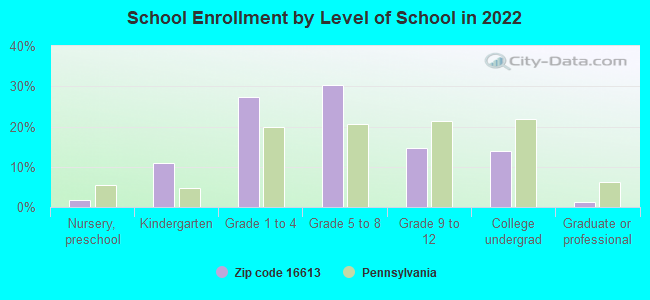
Private vs. public school enrollment:
Students in private schools in grades 1 to 8 (elementary and middle school): 4
Here:
3.0%
Pennsylvania:
15.7%
Students in private schools in grades 9 to 12 (high school):
Here:
0.0%
Pennsylvania:
13.4%
Students in private undergraduate colleges: 8
Here:
23.0%
Pennsylvania:
39.8%
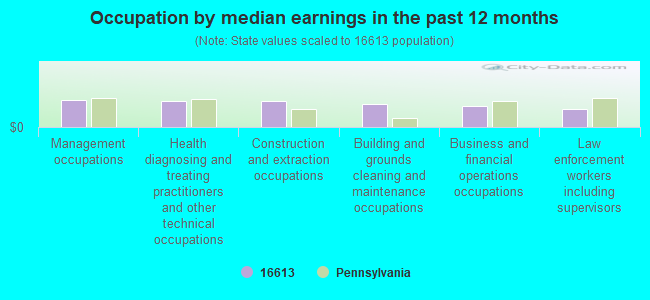
Occupation by median earnings in the past 12 months ($)
78,388Management occupations
73,745Health diagnosing and treating practitioners and other technical occupations
73,579Construction and extraction occupations
65,830Building and grounds cleaning and maintenance occupations
59,130Business and financial operations occupations
52,641Law enforcement workers including supervisors
Top industries in this zip code by the number of employees in 2005:
Other Services (except Public Administration): Civic and Social Organizations (5-9 employees: 1 establishment)
Other Services (except Public Administration): Religious Organizations (5-9: 1)
Construction: Painting and Wall Covering Contractors (5-9: 1)
Construction: Residential Remodelers (1-4: 3)
Accommodation and Food Services: Drinking Places (Alcoholic Beverages) (1-4: 1)
Real Estate and Rental and Leasing: Residential Property Managers (1-4: 1)
Administrative and Support and Waste Management and Remediation Services: Landscaping Services (1-4: 1)
Construction: All Other Specialty Trade Contractors (1-4: 1)
Administrative and Support and Waste Management and Remediation Services: Solid Waste Collection (1-4: 1)
Fatal accident statistics in 2011:
Fatal accident count: 1
Vehicles involved in fatal accidents: 2
Fatal accidents caused by drunken drivers: 0
Fatalities: 1
Persons involved in fatal accidents: 2
Pedestrians involved in fatal accidents: 0
Home Mortgage Disclosure Act Aggregated Statistics For Year 2009 (Based on 6 partial tracts)
A) FHA, FSA/RHS & VA Home Purchase Loans
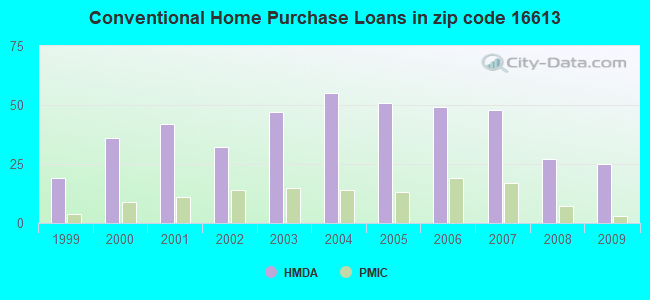
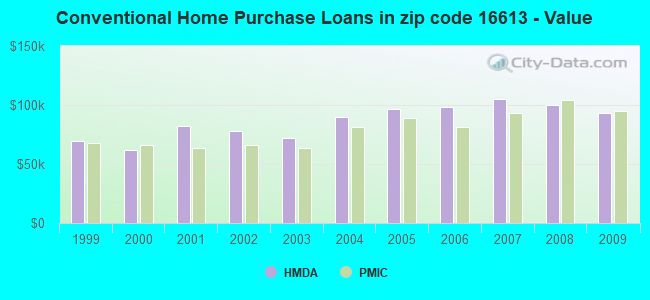
B) Conventional Home Purchase Loans
C) Refinancings
D) Home Improvement Loans
F) Non-occupant Loans on < 5 Family Dwellings (A B C & D)
G) Loans On Manufactured Home Dwelling (A B C & D)
Number
Average Value
Number
Average Value
Number
Average Value
Number
Average Value
Number
Average Value
Number
Average Value
LOANS ORIGINATED
9
$100,079
25
$92,912
73
$115,479
21
$25,057
4
$76,272
5
$56,590
APPLICATIONS APPROVED, NOT ACCEPTED
1
$67,720
2
$103,725
3
$179,820
1
$12,870
0
$0
0
$0
APPLICATIONS DENIED
2
$89,130
4
$71,405
28
$94,338
13
$25,858
0
$0
1
$22,180
APPLICATIONS WITHDRAWN
1
$27,540
2
$82,495
14
$128,539
2
$47,105
1
$9,180
0
$0
FILES CLOSED FOR INCOMPLETENESS
1
$26,010
0
$0
3
$143,280
0
$0
0
$0
0
$0
Aggregated Statistics For Year 2008 (Based on 6 partial tracts)
A) FHA, FSA/RHS & VA Home Purchase Loans
B) Conventional Home Purchase Loans
C) Refinancings
D) Home Improvement Loans
E) Loans on Dwellings For 5+ Families
F) Non-occupant Loans on < 5 Family Dwellings (A B C & D)
G) Loans On Manufactured Home Dwelling (A B C & D)
Number
Average Value
Number
Average Value
Number
Average Value
Number
Average Value
Number
Average Value
Number
Average Value
Number
Average Value
LOANS ORIGINATED
12
$93,011
27
$100,299
52
$97,289
48
$34,579
2
$84,115
10
$58,258
7
$54,964
APPLICATIONS APPROVED, NOT ACCEPTED
1
$63,470
5
$55,910
7
$106,066
7
$23,450
0
$0
1
$58,850
1
$22,070
APPLICATIONS DENIED
1
$52,690
5
$53,722
49
$91,645
18
$47,164
0
$0
1
$36,780
2
$95,995
APPLICATIONS WITHDRAWN
1
$140,480
1
$102,830
16
$86,138
2
$63,225
0
$0
1
$7,650
0
$0
FILES CLOSED FOR INCOMPLETENESS
0
$0
2
$175,485
6
$131,337
1
$52,430
0
$0
0
$0
1
$98,690
Aggregated Statistics For Year 2007 (Based on 6 partial tracts)
A) FHA, FSA/RHS & VA Home Purchase Loans
B) Conventional Home Purchase Loans
C) Refinancings
D) Home Improvement Loans
F) Non-occupant Loans on < 5 Family Dwellings (A B C & D)
G) Loans On Manufactured Home Dwelling (A B C & D)
Number
Average Value
Number
Average Value
Number
Average Value
Number
Average Value
Number
Average Value
Number
Average Value
LOANS ORIGINATED
6
$87,382
48
$104,973
66
$81,466
47
$31,664
8
$58,545
5
$72,684
APPLICATIONS APPROVED, NOT ACCEPTED
1
$31,370
5
$86,098
11
$95,344
3
$40,817
1
$277,630
0
$0
APPLICATIONS DENIED
0
$0
13
$76,047
75
$81,663
33
$47,686
3
$43,563
9
$70,950
APPLICATIONS WITHDRAWN
0
$0
3
$91,027
25
$82,468
3
$67,030
2
$86,880
1
$40,670
FILES CLOSED FOR INCOMPLETENESS
0
$0
2
$116,445
8
$97,409
0
$0
0
$0
1
$97,920
Aggregated Statistics For Year 2006 (Based on 6 partial tracts)
A) FHA, FSA/RHS & VA Home Purchase Loans
B) Conventional Home Purchase Loans
C) Refinancings
D) Home Improvement Loans
F) Non-occupant Loans on < 5 Family Dwellings (A B C & D)
G) Loans On Manufactured Home Dwelling (A B C & D)
Number
Average Value
Number
Average Value
Number
Average Value
Number
Average Value
Number
Average Value
Number
Average Value
LOANS ORIGINATED
6
$65,438
49
$97,992
69
$71,945
62
$26,127
9
$55,820
8
$77,961
APPLICATIONS APPROVED, NOT ACCEPTED
0
$0
8
$109,895
11
$97,259
6
$28,363
1
$18,630
1
$87,210
APPLICATIONS DENIED
1
$24,480
11
$72,256
77
$76,448
27
$37,421
1
$85,540
4
$32,318
APPLICATIONS WITHDRAWN
0
$0
6
$38,275
33
$80,024
3
$46,897
1
$26,650
1
$108,480
FILES CLOSED FOR INCOMPLETENESS
0
$0
2
$23,330
8
$97,369
1
$38,250
1
$32,900
0
$0
Aggregated Statistics For Year 2005 (Based on 6 partial tracts)
A) FHA, FSA/RHS & VA Home Purchase Loans
B) Conventional Home Purchase Loans
C) Refinancings
D) Home Improvement Loans
E) Loans on Dwellings For 5+ Families
F) Non-occupant Loans on < 5 Family Dwellings (A B C & D)
G) Loans On Manufactured Home Dwelling (A B C & D)
Number
Average Value
Number
Average Value
Number
Average Value
Number
Average Value
Number
Average Value
Number
Average Value
Number
Average Value
LOANS ORIGINATED
3
$60,083
51
$96,820
68
$78,824
52
$29,538
0
$0
3
$34,590
8
$55,904
APPLICATIONS APPROVED, NOT ACCEPTED
0
$0
6
$65,580
24
$64,150
5
$54,198
0
$0
0
$0
1
$50,700
APPLICATIONS DENIED
0
$0
18
$76,674
84
$71,385
26
$27,272
0
$0
1
$69,120
12
$49,144
APPLICATIONS WITHDRAWN
0
$0
10
$120,886
44
$100,667
5
$80,680
1
$149,940
3
$132,410
3
$94,463
FILES CLOSED FOR INCOMPLETENESS
0
$0
1
$95,510
5
$124,342
0
$0
0
$0
1
$70,380
0
$0
Aggregated Statistics For Year 2004 (Based on 6 partial tracts)
A) FHA, FSA/RHS & VA Home Purchase Loans
B) Conventional Home Purchase Loans
C) Refinancings
D) Home Improvement Loans
F) Non-occupant Loans on < 5 Family Dwellings (A B C & D)
G) Loans On Manufactured Home Dwelling (A B C & D)
Number
Average Value
Number
Average Value
Number
Average Value
Number
Average Value
Number
Average Value
Number
Average Value
LOANS ORIGINATED
6
$74,362
55
$89,924
89
$74,857
57
$31,356
5
$45,848
5
$67,786
APPLICATIONS APPROVED, NOT ACCEPTED
1
$19,130
4
$70,622
25
$76,452
2
$32,915
0
$0
2
$43,125
APPLICATIONS DENIED
0
$0
19
$45,668
70
$75,043
25
$37,327
2
$29,940
9
$40,934
APPLICATIONS WITHDRAWN
0
$0
3
$69,977
41
$71,980
7
$72,084
1
$83,230
0
$0
FILES CLOSED FOR INCOMPLETENESS
1
$46,660
0
$0
14
$99,546
2
$93,465
0
$0
0
$0
Aggregated Statistics For Year 2003 (Based on 6 partial tracts)
A) FHA, FSA/RHS & VA Home Purchase Loans
B) Conventional Home Purchase Loans
C) Refinancings
D) Home Improvement Loans
F) Non-occupant Loans on < 5 Family Dwellings (A B C & D)
Number
Average Value
Number
Average Value
Number
Average Value
Number
Average Value
Number
Average Value
LOANS ORIGINATED
7
$81,117
47
$71,933
200
$70,909
38
$29,269
7
$50,001
APPLICATIONS APPROVED, NOT ACCEPTED
1
$35,950
1
$39,450
26
$73,128
2
$20,990
1
$61,380
APPLICATIONS DENIED
0
$0
12
$44,684
77
$78,306
12
$15,435
3
$41,007
APPLICATIONS WITHDRAWN
0
$0
3
$101,230
41
$75,707
3
$15,647
0
$0
FILES CLOSED FOR INCOMPLETENESS
0
$0
0
$0
4
$64,230
0
$0
0
$0
Aggregated Statistics For Year 2002 (Based on 6 partial tracts)
A) FHA, FSA/RHS & VA Home Purchase Loans
B) Conventional Home Purchase Loans
C) Refinancings
D) Home Improvement Loans
F) Non-occupant Loans on < 5 Family Dwellings (A B C & D)
Number
Average Value
Number
Average Value
Number
Average Value
Number
Average Value
Number
Average Value
LOANS ORIGINATED
4
$83,580
32
$78,223
95
$73,048
33
$20,913
3
$35,947
APPLICATIONS APPROVED, NOT ACCEPTED
1
$19,130
2
$87,990
19
$60,788
2
$25,160
0
$0
APPLICATIONS DENIED
1
$38,250
12
$56,225
62
$61,210
15
$12,573
2
$30,600
APPLICATIONS WITHDRAWN
2
$14,206,100
2
$94,790
25
$1,373,945
0
$0
0
$0
FILES CLOSED FOR INCOMPLETENESS
0
$0
0
$0
9
$79,291
1
$22,950
0
$0
Aggregated Statistics For Year 2001 (Based on 6 partial tracts)
A) FHA, FSA/RHS & VA Home Purchase Loans
B) Conventional Home Purchase Loans
C) Refinancings
D) Home Improvement Loans
F) Non-occupant Loans on < 5 Family Dwellings (A B C & D)
Number
Average Value
Number
Average Value
Number
Average Value
Number
Average Value
Number
Average Value
LOANS ORIGINATED
11
$59,267
42
$81,976
99
$61,528
48
$19,094
7
$49,337
APPLICATIONS APPROVED, NOT ACCEPTED
2
$47,410
7
$42,839
21
$49,875
4
$15,475
0
$0
APPLICATIONS DENIED
1
$45,900
16
$60,881
73
$51,630
16
$20,411
2
$62,310
APPLICATIONS WITHDRAWN
0
$0
2
$64,085
31
$63,321
12
$18,106
1
$35,190
FILES CLOSED FOR INCOMPLETENESS
0
$0
1
$43,610
8
$66,672
1
$28,940
0
$0
Aggregated Statistics For Year 2000 (Based on 6 partial tracts)
A) FHA, FSA/RHS & VA Home Purchase Loans
B) Conventional Home Purchase Loans
C) Refinancings
D) Home Improvement Loans
F) Non-occupant Loans on < 5 Family Dwellings (A B C & D)
Number
Average Value
Number
Average Value
Number
Average Value
Number
Average Value
Number
Average Value
LOANS ORIGINATED
4
$60,958
36
$61,518
40
$44,335
35
$17,537
6
$37,327
APPLICATIONS APPROVED, NOT ACCEPTED
0
$0
4
$49,115
18
$49,402
5
$25,872
0
$0
APPLICATIONS DENIED
2
$68,085
13
$34,902
48
$45,578
16
$14,919
0
$0
APPLICATIONS WITHDRAWN
0
$0
6
$38,058
20
$50,222
6
$33,125
1
$26,780
FILES CLOSED FOR INCOMPLETENESS
0
$0
0
$0
3
$66,317
2
$33,280
0
$0
Aggregated Statistics For Year 1999 (Based on 3 partial tracts)
A) FHA, FSA/RHS & VA Home Purchase Loans
B) Conventional Home Purchase Loans
C) Refinancings
D) Home Improvement Loans
F) Non-occupant Loans on < 5 Family Dwellings (A B C & D)


 Nearest zip codes: 16636, 16624, 16641, 15940, 16630, 16699.