Estimated zip code population in 2022: 2,384 Zip code population in 2010: 2,598 Zip code population in 2000: 2,777
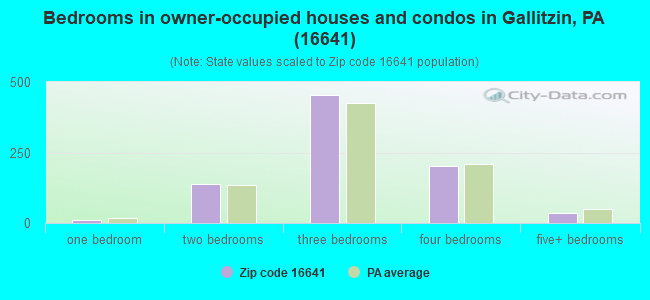
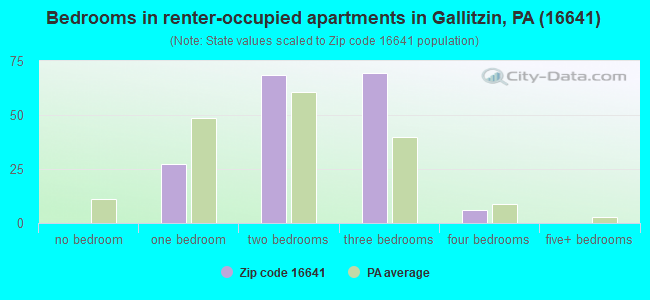
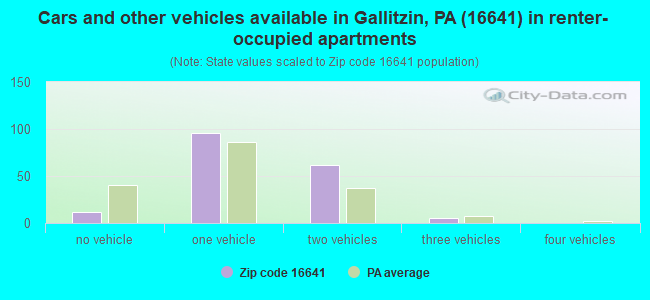
Houses and condos: 1,155 Renter-occupied apartments: 173
% of renters here:
17%
State:
31%
March 2022 cost of living index in zip code 16641: 89.3 (less than average, U.S. average is 100)
Land area: 16.9 sq. mi. Water area: 0.0 sq. mi.
Population density: 141 people per square mile
(very low).
OSM Map
General Map
Google Map
MSN Map
OSM Map
General Map
Google Map
MSN Map
OSM Map
General Map
Google Map
MSN Map
OSM Map
General Map
Google Map
MSN Map
Please wait while loading the map...
Real estate property taxes paid for housing units in 2022:
This zip code:
1.1% ($1,123)
Pennsylvania:
1.3% ($3,094)
Median real estate property taxes paid for housing units with mortgages in 2022: $1,112 (1.0%) Median real estate property taxes paid for housing units with no mortgage in 2022: $1,131 (1.1%)
Business Search- 14 Million verified businesses
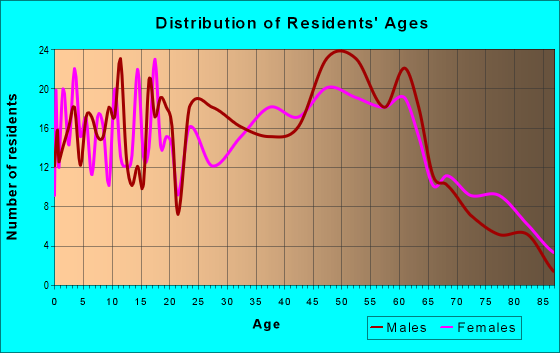
Males: 1,174
(49.3%)
Females: 1,209
(50.7%)
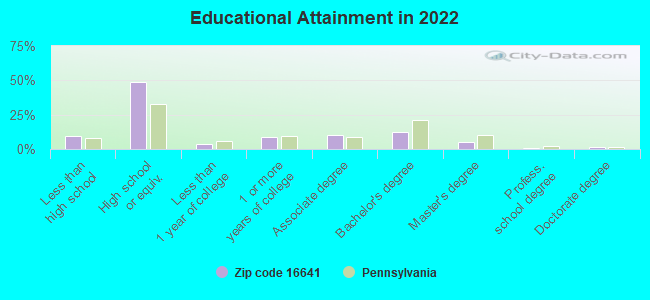
For population 25 years and over in 16641:
High school or higher: 89.3%
Bachelor's degree or higher: 19.1%
Graduate or professional degree: 6.7%
Unemployed: 4.6%
Mean travel time to work (commute): 25.2 minutes
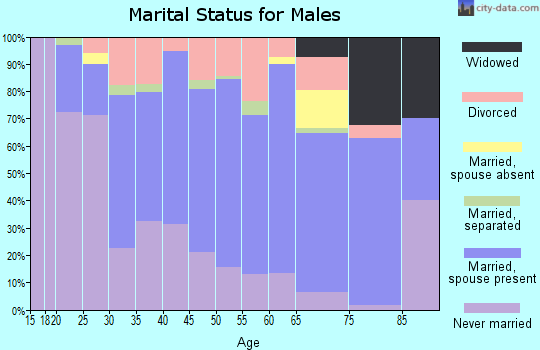
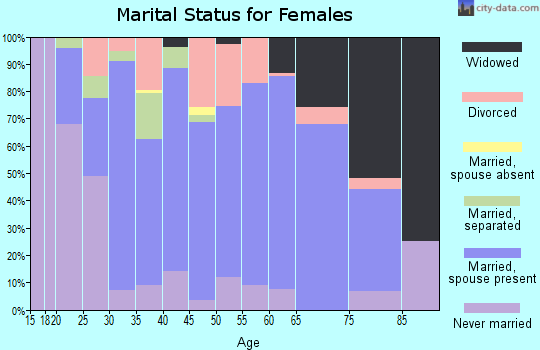
For population 15 years and over in 16641:
Never married: 31.4%
Now married: 48.3%
Separated: 1.7%
Widowed: 5.9%
Divorced: 12.7%
Zip code 16641 compared to state average:
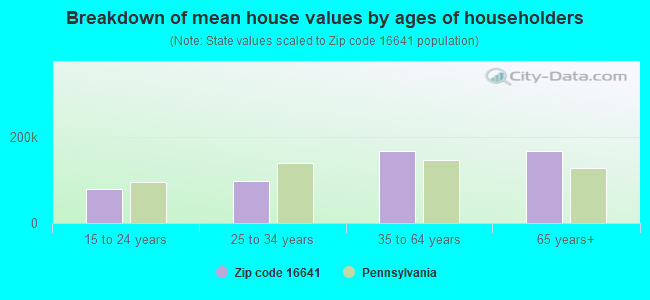
Median house value significantly below state average.
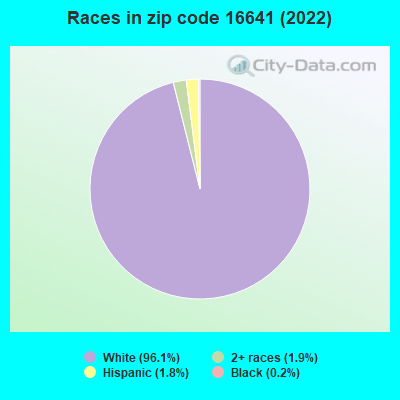
Black race population percentage significantly below state average.
Hispanic race population percentage significantly below state average.
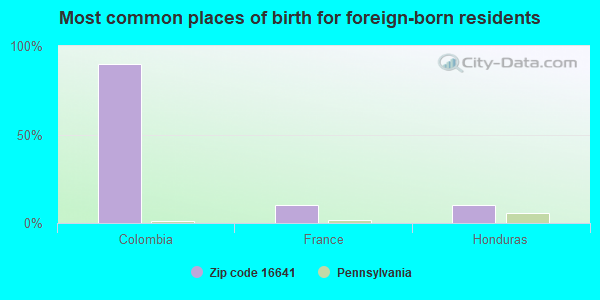
Foreign-born population percentage significantly below state average.
Renting percentage below state average.
Percentage of population with a bachelor's degree or higher below state average.
Estimated median house/condo value in 2022: $104,191
16641:
$104,191
Pennsylvania:
$245,500
According to our research of Pennsylvania and other state lists, there were 4 registered sex offenders living in 16641 zip code as of April 25, 2024. The ratio of all residents to sex offenders in zip code 16641 is 624 to 1. The ratio of registered sex offenders to all residents in this zip code is near the state average.
Median resident age:
This zip code:
44.2 years
Pennsylvania median age:
40.9 years
Average household size:
This zip code:
2.3 people
Pennsylvania:
2.4 people
Averages for the 2020 tax year for zip code 16641, filed in 2021:
Average Adjusted Gross Income (AGI) in 2020: $50,780 (Individual Income Tax Returns)
Here:
$50,780
State:
$75,707
Salary/wage: $44,028 (reported on 79.7% of returns)
Here:
$44,028
State:
$62,806
(% of AGI for various income ranges: 895.9% for AGIs below $25k, 3219.6% for AGIs $25k-50k, 5741.9% for AGIs $50k-75k, 7697.0% for AGIs $75k-100k, 14520.0% for AGIs $100k-200k)
Taxable interest for individuals: $517 (reported on 30.5% of returns)
This zip code:
$517
Pennsylvania:
$1,633
(% of AGI for various income ranges: 11.1% for AGIs below $25k, 14.3% for AGIs $25k-50k, 35.0% for AGIs $50k-75k, 20.0% for AGIs $75k-100k, 44.4% for AGIs $100k-200k)
Ordinary dividends: $1,612 (reported on 13.6% of returns)
Here:
$1,612
State:
$7,382
(% of AGI for various income ranges: 8.1% for AGIs below $25k, 16.1% for AGIs $25k-50k, 41.9% for AGIs $50k-75k, 137.8% for AGIs $100k-200k)
Net capital gain/loss in AGI: +$7,840 (reported on 8.5% of returns)
Here:
+$7,840
State:
+$23,522
(% of AGI for various income ranges: 23.9% for AGIs $25k-50k, 38.8% for AGIs $50k-75k, 727.8% for AGIs $100k-200k)
Profit/loss from business: +$7,400 (reported on 7.6% of returns)
Here:
+$7,400
State:
+$16,274
(% of AGI for various income ranges: 21.9% for AGIs below $25k, 135.4% for AGIs $25k-50k, 228.0% for AGIs $75k-100k)
Taxable individual retirement arrangement distribution: $11,858 (reported on 10.2% of returns)
16641:
$11,858
Pennsylvania:
$18,583
(% of AGI for various income ranges: 89.3% for AGIs below $25k, 56.8% for AGIs $25k-50k, 330.0% for AGIs $50k-75k, 550.0% for AGIs $100k-200k)
Earned income credit: $1,950 (reported on 13.6% of returns)
Here:
$1,950
State:
$2,100
(% of AGI for various income ranges: 60.7% for AGIs below $25k, 52.9% for AGIs $25k-50k)
Percentage of individuals using paid preparers for their 2020 taxes: 93.2%
Here:
93%
State:
92%
(% for various income ranges: 91.9% for AGIs below $25k, 91.4% for AGIs $25k-50k, 90.5% for AGIs $50k-75k, 100.0% for AGIs $75k-100k, 100.0% for AGIs $100k-200k)
Averages for the 2012 tax year for zip code 16641, filed in 2013:
Average Adjusted Gross Income (AGI) in 2012: $41,529 (Individual Income Tax Returns)
Here:
$41,529
State:
$61,346
Salary/wage: $38,196 (reported on 83.7% of returns)
Here:
$38,196
State:
$51,902
(% of AGI for various income ranges: 65.5% for AGIs below $25k, 76.3% for AGIs $25k-50k, 83.2% for AGIs $50k-75k, 81.2% for AGIs $75k-100k, 73.5% for AGIs $100k-200k)
Taxable interest for individuals: $627 (reported on 35.8% of returns)
This zip code:
$627
Pennsylvania:
$1,588
(% of AGI for various income ranges: 0.7% for AGIs below $25k, 0.8% for AGIs $25k-50k, 0.4% for AGIs $50k-75k, 0.5% for AGIs $75k-100k, 0.3% for AGIs $100k-200k)
Ordinary dividends: $795 (reported on 15.4% of returns)
Here:
$795
State:
$5,827
(% of AGI for various income ranges: 0.1% for AGIs below $25k, 0.5% for AGIs $25k-50k, 0.2% for AGIs $50k-75k, 0.1% for AGIs $75k-100k, 0.3% for AGIs $100k-200k)
Net capital gain/loss in AGI: +$444 (reported on 7.3% of returns)
Here:
+$444
State:
+$14,495
(% of AGI for various income ranges: 0.4% for AGIs below $25k, 0.1% for AGIs $75k-100k)
Profit/loss from business: +$5,291 (reported on 8.9% of returns)
Here:
+$5,291
State:
+$16,268
(% of AGI for various income ranges: 3.4% for AGIs below $25k, 1.6% for AGIs $25k-50k, 1.4% for AGIs $50k-75k)
Taxable individual retirement arrangement distribution: $9,209 (reported on 8.9% of returns)
16641:
$9,209
Pennsylvania:
$14,550
(% of AGI for various income ranges: 3.0% for AGIs below $25k, 2.4% for AGIs $25k-50k, 1.9% for AGIs $50k-75k, 3.0% for AGIs $75k-100k)
Total itemized deductions: $16,931 (19% of AGI, reported on 10.6% of returns)
Here:
$16,931
State:
$23,538
Here:
19.2% of AGI
State:
18.4% of AGI
(% of AGI for various income ranges: 3.3% for AGIs $25k-50k, 4.1% for AGIs $50k-75k, 5.1% for AGIs $75k-100k, 7.7% for AGIs $100k-200k)
Charity contributions: $2,050 (reported on 8.1% of returns)
Here:
$2,050
State:
$4,025
(% of AGI for various income ranges: 0.3% for AGIs $25k-50k, 0.3% for AGIs $50k-75k, 0.3% for AGIs $75k-100k, 0.9% for AGIs $100k-200k)
Taxes paid: $5,815 (reported on 10.6% of returns)
16641:
$5,815
State:
$9,982
(% of AGI for various income ranges: 0.9% for AGIs $25k-50k, 1.1% for AGIs $50k-75k, 1.4% for AGIs $75k-100k, 3.6% for AGIs $100k-200k)
Earned income credit: $1,876 (reported on 17.1% of returns)
Here:
$1,876
State:
$2,106
(% of AGI for various income ranges: 4.4% for AGIs below $25k, 1.0% for AGIs $25k-50k)
Percentage of individuals using paid preparers for their 2012 taxes: 52.0%
Here:
52%
State:
53%
(% for various income ranges: 44.9% for AGIs below $25k, 55.6% for AGIs $25k-50k, 55.0% for AGIs $50k-75k, 63.6% for AGIs $75k-100k, 57.1% for AGIs $100k-200k)
Averages for the 2004 tax year for zip code 16641, filed in 2005:
Average Adjusted Gross Income (AGI) in 2004: $32,541 (Individual Income Tax Returns)
Here:
$32,541
State:
$48,049
Salary/wage: $30,653 (reported on 87.7% of returns)
Here:
$30,653
State:
$42,646
(% of AGI for various income ranges: 89.1% for AGIs below $10k, 76.7% for AGIs $10k-25k, 86.2% for AGIs $25k-50k, 87.8% for AGIs $50k-75k, 87.4% for AGIs $75k-100k, 58.0% for AGIs over 100k)
Taxable interest for individuals: $586 (reported on 42.7% of returns)
This zip code:
$586
Pennsylvania:
$1,657
(% of AGI for various income ranges: 2.3% for AGIs below $10k, 1.6% for AGIs $10k-25k, 0.7% for AGIs $25k-50k, 0.4% for AGIs $50k-75k, 0.3% for AGIs $75k-100k, 0.8% for AGIs over 100k)
Taxable dividends: $943 (reported on 18.2% of returns)
Here:
$943
State:
$3,566
(% of AGI for various income ranges: 2.5% for AGIs below $10k, 0.6% for AGIs $10k-25k, 0.2% for AGIs $25k-50k, 0.1% for AGIs $50k-75k, 0.3% for AGIs $75k-100k, 2.3% for AGIs over 100k)
Net capital gain/loss: +$1,009 (reported on 9.3% of returns)
Here:
+$1,009
State:
+$9,716
(% of AGI for various income ranges: -2.4% for AGIs below $10k, -0.2% for AGIs $10k-25k, 0.2% for AGIs $25k-50k, -0.1% for AGIs $50k-75k, 2.6% for AGIs $75k-100k)
Profit/loss from business: +$7,070 (reported on 10.2% of returns)
Here:
+$7,070
State:
+$14,267
(% of AGI for various income ranges: 2.7% for AGIs below $10k, 3.9% for AGIs $10k-25k, 1.5% for AGIs $25k-50k, 3.0% for AGIs $50k-75k, 2.0% for AGIs $75k-100k)
IRA payment deduction: $2,609 (reported on 1.8% of returns)
16641:
$2,609
Pennsylvania:
$2,903
Total itemized deductions: $12,159 (17% of AGI, reported on 10.0% of returns)
Here:
$12,159
State:
$18,804
Here:
16.9% of AGI
State:
19.5% of AGI
(% of AGI for various income ranges: 1.8% for AGIs $10k-25k, 2.8% for AGIs $25k-50k, 4.6% for AGIs $50k-75k, 5.8% for AGIs $75k-100k, 6.0% for AGIs over 100k)
Charity contributions deductions: $1,724 (2% of AGI, reported on 8.4% of returns)
Here:
$1,724
State:
$3,337
Here:
2.2% of AGI
State:
3.3% of AGI
(% of AGI for various income ranges: 0.3% for AGIs $25k-50k, 0.5% for AGIs $50k-75k, 0.7% for AGIs $75k-100k, 1.4% for AGIs over 100k)
Total tax: $3,519 (reported on 73.1% of returns)
16641:
$3,519
State:
$8,008
(% of AGI for various income ranges: 1.5% for AGIs below $10k, 4.5% for AGIs $10k-25k, 6.6% for AGIs $25k-50k, 8.7% for AGIs $50k-75k, 10.9% for AGIs $75k-100k, 12.9% for AGIs over 100k)
Earned income credit: $1,418 (reported on 16.6% of returns)
Here:
$1,418
State:
$1,643
Percentage of individuals using paid preparers for their 2004 taxes: 52.8%
Here:
53%
State:
56%
(% for various income ranges: 43.0% for AGIs below $10k, 53.7% for AGIs $10k-25k, 53.2% for AGIs $25k-50k, 58.4% for AGIs $50k-75k, 64.3% for AGIs $75k-100k, 66.7% for AGIs over 100k)
Household received Food Stamps/SNAP in the past 12 months: 177 Household did not receive Food Stamps/SNAP in the past 12 months: 838
Women who had a birth in the past 12 months: 27 (18 now married, 8 unmarried) Women who did not have a birth in the past 12 months: 502 (200 now married, 301 unmarried)
Housing units in zip code 16641 with a mortgage: 395 (39 second mortgage, 33 both second mortgage and home equity loan) Houses without a mortgage: 24
Median monthly owner costs for units with a mortgage: $1,031 Median monthly owner costs for units without a mortgage: $465
Residents with income below the poverty level in 2022:
This zip code:
11.1%
Whole state:
11.8%
Residents with income below 50% of the poverty level in 2022:
This zip code:
6.9%
Whole state:
6.1%
Median number of rooms in houses and condos:
Here:
6.9
State:
6.8
Median number of rooms in apartments:
Here:
5.4
State:
4.3
Notable locations in this zip code not listed on our city pages
In group quarters: 5 (-1 institutionalized population)
Size of family households: 284 2-persons, 174 3-persons, 102 4-persons, 25 5-persons, 15 6-persons, 17 7-or-more-persons
Size of nonfamily households: 314 1-person, 77 2-persons, 3 3-persons
336 married couples with children.
129 single-parent households (33 men, 96 women).
96.8% of residents of 16641 zip code speak English at home.
1.7% of residents speak Spanish at home (44% very well, 56% well).
0.6% of residents speak other Indo-European language at home (100% very well).
0.1% of residents speak Asian or Pacific Island language at home (100% very well).
Foreign born population: 10 (0.4%) (20.7% of them are naturalized citizens)
This zip code:
0.4%
Whole state:
7.5%
90%Colombia
10%France
10%Honduras
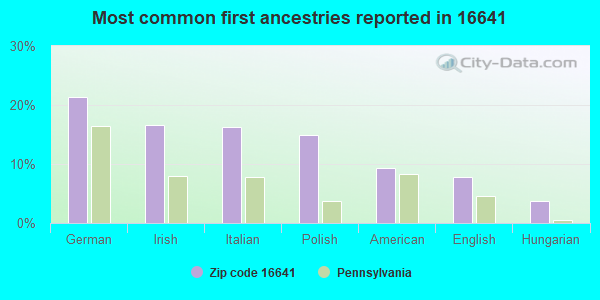
21%German
17%Irish
16%Italian
15%Polish
9%American
8%English
4%Hungarian
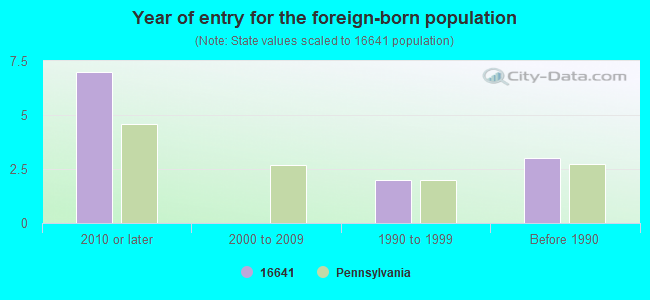
Year of entry for the foreign-born population
72010 or later
02000 to 2009
21990 to 1999
3Before 1990
Facilities with environmental interests located in this zip code:
AMSBRY WATER ASSN (RD 1 BOX 113 in GALLITZIN, PA)
(Integrated Compliance Information System) - ICIS-03-1988-0387, FORMAL ENFORCEMENT ACTION, ICIS-03-1988-0033,
AMSBURY WATER AUTHORITY (119 ROBBINS ST in GALLITZIN, PA)
(Integrated Compliance Information System) - ICIS-03-2003-0095, FORMAL ENFORCEMENT ACTION, Business SIC classification: WATER SUPPLY
BATHURST BODY SHOP (381 KID LONG RD RD 1 BOX 158 in GALLITZIN, PA)
Conditionally Exempt Small Quantity Generators, less than 100 kg/month of hazardous waste (Resource Conservation and Recovery Act (tracking hazardous waste)) - notification
Housing units lacking complete plumbing facilities: 4.2% Housing units lacking complete kitchen facilities: 5.0%
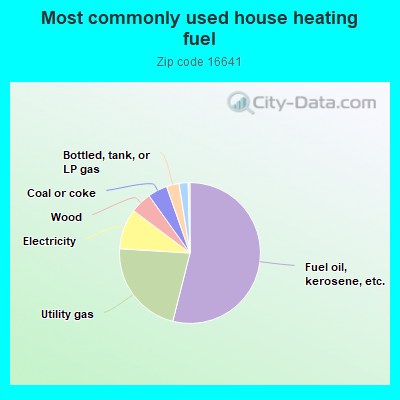
54.1%Fuel oil, kerosene, etc.
22.1%Utility gas
9.3%Electricity
4.9%Wood
4.5%Coal or coke
2.9%Bottled, tank, or LP gas
2.1%Other fuel
Population in 1990: 2,852.
Place of birth for U.S.-born residents:
This state: 2,174
Northeast: 29
Midwest: 67
South: 69
West: 9
76% of the 16641 zip code residents lived in the same house 5 years ago. Out of people who lived in different houses, 65% lived in this county. Out of people who lived in different counties, 50% lived in Pennsylvania.
91% of the 16641 zip code residents lived in the same house 1 year ago. Out of people who lived in different houses, 63% moved from this county. Out of people who lived in different houses, 33% moved from different county within same state. Out of people who lived in different houses, 2% moved from different state.
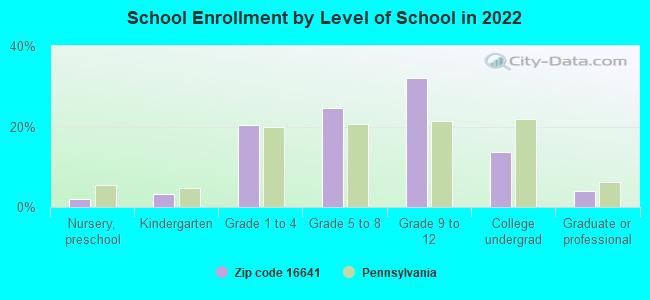
Private vs. public school enrollment:
Students in private schools in grades 1 to 8 (elementary and middle school): 23
Here:
11.0%
Pennsylvania:
15.7%
Students in private schools in grades 9 to 12 (high school): 13
Here:
8.7%
Pennsylvania:
13.4%
Students in private undergraduate colleges: 37
Here:
56.6%
Pennsylvania:
39.8%
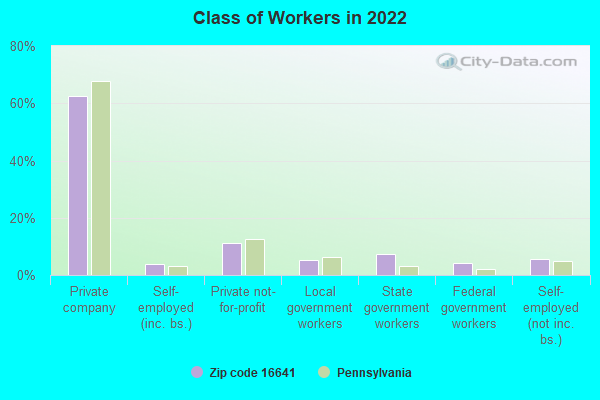
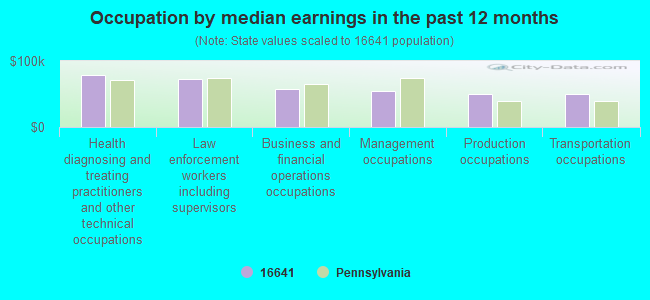
Occupation by median earnings in the past 12 months ($)
78,326Health diagnosing and treating practitioners and other technical occupations
73,222Law enforcement workers including supervisors
56,822Business and financial operations occupations
55,284Management occupations
50,475Production occupations
49,694Transportation occupations
Top industries in this zip code by the number of employees in 2005:
Other Services (except Public Administration): Religious Organizations (10-19 employees: 1 establishment, 1-4 employees: 1 establishment)
Other Services (except Public Administration): Automotive Body, Paint, and Interior Repair and Maintenance (10-19: 1, 1-4: 1)
Wholesale Trade: Home Furnishing Merchant Wholesalers (10-19: 1)
Other Services (except Public Administration): Civic and Social Organizations (5-9: 1, 1-4: 2)
Construction: Residential Remodelers (1-4: 2)
Construction: New Single-Family Housing Construction (except Operative Builders) (1-4: 2)
Finance and Insurance: Savings Institutions (1-4: 1)
Health Care and Social Assistance: Ambulance Services (1-4: 1)
Administrative and Support and Waste Management and Remediation Services: All Other Support Services (1-4: 1)
People in group quarters in 2010:
6 people in other noninstitutional facilities
People in group quarters in 2000:
5 people in religious group quarters
Fatal accident statistics in 2012:
Fatal accident count: 1
Vehicles involved in fatal accidents: 1
Fatal accidents caused by drunken drivers: 0
Fatalities: 1
Persons involved in fatal accidents: 1
Pedestrians involved in fatal accidents: 0
Home Mortgage Disclosure Act Aggregated Statistics For Year 2009 (Based on 2 partial tracts)
A) FHA, FSA/RHS & VA Home Purchase Loans
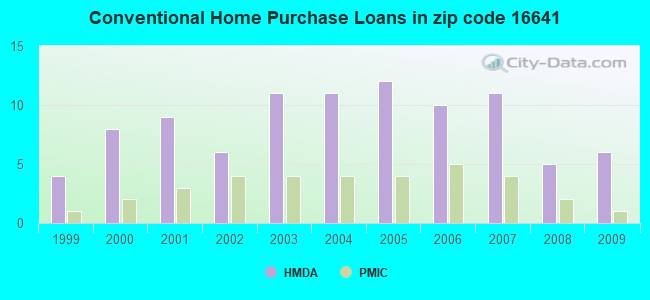
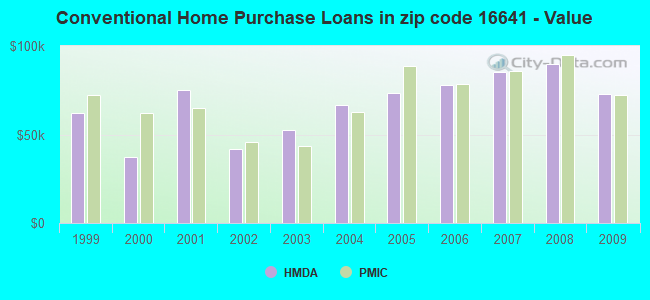
B) Conventional Home Purchase Loans
C) Refinancings
D) Home Improvement Loans
F) Non-occupant Loans on < 5 Family Dwellings (A B C & D)
G) Loans On Manufactured Home Dwelling (A B C & D)
Number
Average Value
Number
Average Value
Number
Average Value
Number
Average Value
Number
Average Value
Number
Average Value
LOANS ORIGINATED
2
$104,895
6
$73,142
14
$85,492
5
$24,492
1
$26,730
2
$40,250
APPLICATIONS APPROVED, NOT ACCEPTED
0
$0
0
$0
1
$92,310
0
$0
0
$0
0
$0
APPLICATIONS DENIED
0
$0
2
$26,420
7
$62,381
4
$18,105
0
$0
0
$0
APPLICATIONS WITHDRAWN
0
$0
0
$0
3
$119,140
0
$0
0
$0
0
$0
FILES CLOSED FOR INCOMPLETENESS
0
$0
0
$0
0
$0
0
$0
0
$0
0
$0
Aggregated Statistics For Year 2008 (Based on 2 partial tracts)
A) FHA, FSA/RHS & VA Home Purchase Loans
B) Conventional Home Purchase Loans
C) Refinancings
D) Home Improvement Loans
E) Loans on Dwellings For 5+ Families
F) Non-occupant Loans on < 5 Family Dwellings (A B C & D)
G) Loans On Manufactured Home Dwelling (A B C & D)
Number
Average Value
Number
Average Value
Number
Average Value
Number
Average Value
Number
Average Value
Number
Average Value
Number
Average Value
LOANS ORIGINATED
4
$73,505
5
$89,946
10
$77,514
12
$31,572
1
$63,400
2
$52,990
2
$55,945
APPLICATIONS APPROVED, NOT ACCEPTED
0
$0
1
$52,840
1
$27,660
2
$30,305
0
$0
0
$0
0
$0
APPLICATIONS DENIED
0
$0
1
$39,470
12
$87,594
5
$47,180
0
$0
0
$0
0
$0
APPLICATIONS WITHDRAWN
0
$0
0
$0
4
$74,748
0
$0
0
$0
0
$0
0
$0
FILES CLOSED FOR INCOMPLETENESS
0
$0
1
$55,010
2
$124,320
0
$0
0
$0
0
$0
0
$0
Aggregated Statistics For Year 2007 (Based on 2 partial tracts)
A) FHA, FSA/RHS & VA Home Purchase Loans
B) Conventional Home Purchase Loans
C) Refinancings
D) Home Improvement Loans
F) Non-occupant Loans on < 5 Family Dwellings (A B C & D)
G) Loans On Manufactured Home Dwelling (A B C & D)
Number
Average Value
Number
Average Value
Number
Average Value
Number
Average Value
Number
Average Value
Number
Average Value
LOANS ORIGINATED
2
$65,425
11
$85,103
15
$65,268
12
$28,593
2
$37,920
2
$59,675
APPLICATIONS APPROVED, NOT ACCEPTED
0
$0
1
$32,940
3
$104,013
1
$32,320
0
$0
0
$0
APPLICATIONS DENIED
0
$0
4
$62,005
23
$74,835
10
$49,542
1
$28,280
3
$75,317
APPLICATIONS WITHDRAWN
0
$0
0
$0
8
$69,036
1
$66,820
1
$36,670
0
$0
FILES CLOSED FOR INCOMPLETENESS
0
$0
1
$27,970
3
$78,530
0
$0
0
$0
0
$0
Aggregated Statistics For Year 2006 (Based on 2 partial tracts)
A) FHA, FSA/RHS & VA Home Purchase Loans
B) Conventional Home Purchase Loans
C) Refinancings
D) Home Improvement Loans
F) Non-occupant Loans on < 5 Family Dwellings (A B C & D)
G) Loans On Manufactured Home Dwelling (A B C & D)
Number
Average Value
Number
Average Value
Number
Average Value
Number
Average Value
Number
Average Value
Number
Average Value
LOANS ORIGINATED
2
$57,345
10
$78,197
17
$71,704
17
$22,158
2
$41,645
2
$94,485
APPLICATIONS APPROVED, NOT ACCEPTED
0
$0
2
$96,970
3
$93,447
1
$25,490
0
$0
0
$0
APPLICATIONS DENIED
0
$0
3
$66,200
25
$72,578
8
$39,860
0
$0
1
$12,740
APPLICATIONS WITHDRAWN
0
$0
2
$27,040
10
$72,168
1
$41,340
0
$0
0
$0
FILES CLOSED FOR INCOMPLETENESS
0
$0
1
$18,960
2
$104,430
0
$0
0
$0
0
$0
Aggregated Statistics For Year 2005 (Based on 2 partial tracts)
A) FHA, FSA/RHS & VA Home Purchase Loans
B) Conventional Home Purchase Loans
C) Refinancings
D) Home Improvement Loans
F) Non-occupant Loans on < 5 Family Dwellings (A B C & D)
G) Loans On Manufactured Home Dwelling (A B C & D)
Number
Average Value
Number
Average Value
Number
Average Value
Number
Average Value
Number
Average Value
Number
Average Value
LOANS ORIGINATED
1
$59,360
12
$73,633
12
$79,150
12
$25,149
1
$11,500
2
$72,885
APPLICATIONS APPROVED, NOT ACCEPTED
0
$0
2
$41,805
8
$64,335
1
$69,620
0
$0
0
$0
APPLICATIONS DENIED
0
$0
5
$69,744
26
$65,507
7
$28,416
0
$0
4
$45,920
APPLICATIONS WITHDRAWN
0
$0
2
$91,530
14
$99,700
1
$64,650
1
$88,890
1
$101,630
FILES CLOSED FOR INCOMPLETENESS
0
$0
0
$0
1
$163,790
0
$0
0
$0
0
$0
Aggregated Statistics For Year 2004 (Based on 2 partial tracts)
A) FHA, FSA/RHS & VA Home Purchase Loans
B) Conventional Home Purchase Loans
C) Refinancings
D) Home Improvement Loans
F) Non-occupant Loans on < 5 Family Dwellings (A B C & D)
G) Loans On Manufactured Home Dwelling (A B C & D)
Number
Average Value
Number
Average Value
Number
Average Value
Number
Average Value
Number
Average Value
Number
Average Value
LOANS ORIGINATED
2
$52,680
11
$66,878
21
$58,445
13
$26,968
1
$42,890
1
$94,790
APPLICATIONS APPROVED, NOT ACCEPTED
0
$0
1
$56,570
7
$58,386
0
$0
0
$0
0
$0
APPLICATIONS DENIED
0
$0
6
$45,792
20
$67,848
7
$36,941
0
$0
3
$39,470
APPLICATIONS WITHDRAWN
0
$0
1
$33,880
12
$65,423
2
$60,450
0
$0
0
$0
FILES CLOSED FOR INCOMPLETENESS
0
$0
0
$0
4
$84,925
1
$66,820
0
$0
0
$0
Aggregated Statistics For Year 2003 (Based on 2 partial tracts)
A) FHA, FSA/RHS & VA Home Purchase Loans
B) Conventional Home Purchase Loans
C) Refinancings
D) Home Improvement Loans
F) Non-occupant Loans on < 5 Family Dwellings (A B C & D)
Number
Average Value
Number
Average Value
Number
Average Value
Number
Average Value
Number
Average Value
LOANS ORIGINATED
2
$76,610
11
$52,440
42
$55,722
10
$26,822
1
$34,500
APPLICATIONS APPROVED, NOT ACCEPTED
0
$0
0
$0
5
$63,714
0
$0
0
$0
APPLICATIONS DENIED
0
$0
3
$40,197
22
$73,151
3
$18,233
1
$44,440
APPLICATIONS WITHDRAWN
0
$0
1
$81,740
10
$67,444
1
$6,840
0
$0
FILES CLOSED FOR INCOMPLETENESS
0
$0
0
$0
1
$71,480
0
$0
0
$0
Aggregated Statistics For Year 2002 (Based on 2 partial tracts)
A) FHA, FSA/RHS & VA Home Purchase Loans
B) Conventional Home Purchase Loans
C) Refinancings
D) Home Improvement Loans
F) Non-occupant Loans on < 5 Family Dwellings (A B C & D)
Number
Average Value
Number
Average Value
Number
Average Value
Number
Average Value
Number
Average Value
LOANS ORIGINATED
1
$83,920
6
$41,595
19
$62,945
10
$19,736
1
$26,730
APPLICATIONS APPROVED, NOT ACCEPTED
0
$0
1
$39,160
6
$57,447
1
$12,430
0
$0
APPLICATIONS DENIED
0
$0
4
$58,508
17
$62,544
5
$10,070
1
$24,860
APPLICATIONS WITHDRAWN
1
$11,539,380
0
$0
8
$1,726,532
0
$0
0
$0
FILES CLOSED FOR INCOMPLETENESS
0
$0
0
$0
2
$87,490
0
$0
0
$0
Aggregated Statistics For Year 2001 (Based on 2 partial tracts)
A) FHA, FSA/RHS & VA Home Purchase Loans
B) Conventional Home Purchase Loans
C) Refinancings
D) Home Improvement Loans
F) Non-occupant Loans on < 5 Family Dwellings (A B C & D)
Number
Average Value
Number
Average Value
Number
Average Value
Number
Average Value
Number
Average Value
LOANS ORIGINATED
4
$47,320
9
$75,352
23
$51,296
15
$16,348
2
$43,510
APPLICATIONS APPROVED, NOT ACCEPTED
1
$26,110
2
$40,405
6
$44,237
1
$17,400
0
$0
APPLICATIONS DENIED
0
$0
5
$59,052
21
$51,090
5
$17,778
1
$30,770
APPLICATIONS WITHDRAWN
0
$0
1
$30,460
8
$63,598
4
$19,502
0
$0
FILES CLOSED FOR INCOMPLETENESS
0
$0
0
$0
2
$63,250
0
$0
0
$0
Aggregated Statistics For Year 2000 (Based on 2 partial tracts)
A) FHA, FSA/RHS & VA Home Purchase Loans
B) Conventional Home Purchase Loans
C) Refinancings
D) Home Improvement Loans
F) Non-occupant Loans on < 5 Family Dwellings (A B C & D)
Number
Average Value
Number
Average Value
Number
Average Value
Number
Average Value
Number
Average Value
LOANS ORIGINATED
1
$76,150
8
$37,451
11
$41,788
9
$14,331
2
$26,885
APPLICATIONS APPROVED, NOT ACCEPTED
0
$0
1
$59,360
5
$52,276
1
$39,780
0
$0
APPLICATIONS DENIED
1
$55,320
4
$33,800
14
$42,757
4
$15,230
0
$0
APPLICATIONS WITHDRAWN
0
$0
2
$35,740
7
$47,464
2
$33,875
0
$0
FILES CLOSED FOR INCOMPLETENESS
0
$0
0
$0
0
$0
1
$27,040
0
$0
Aggregated Statistics For Year 1999 (Based on 1 partial tract)
A) FHA, FSA/RHS & VA Home Purchase Loans
B) Conventional Home Purchase Loans
C) Refinancings
D) Home Improvement Loans
F) Non-occupant Loans on < 5 Family Dwellings (A B C & D)
Detailed PMIC statistics for the following Tracts:0122.00
2003 - 2018 National Fire Incident Reporting System (NFIRS) incidents
According to the data from the years 2003 - 2018 the average number of fire incidents per year is 7. The highest number of reported fires - 24 took place in 2016, and the least - 0 in 2006. The data has a constant trend.
When looking into fire subcategories, the most reports belonged to: Structure Fires (52.2%), and Outside Fires (23.0%).
Fire incident types reported to NFIRS in Zip Code 16641
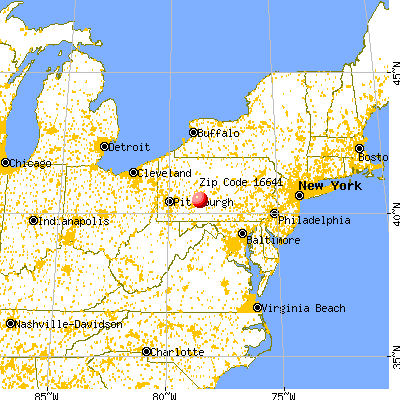


 Nearest zip codes: 16613, 16635, 16699, 16630, 16636, 16665.


 According to the data from the years 2003 - 2018 the average number of fire incidents per year is 7. The highest number of reported fires - 24 took place in 2016, and the least - 0 in 2006. The data has a constant trend.
 When looking into fire subcategories, the most reports belonged to: Structure Fires (52.2%), and Outside Fires (23.0%).