Estimated zip code population in 2022: 5,169 Zip code population in 2010: 5,519 Zip code population in 2000: 5,023
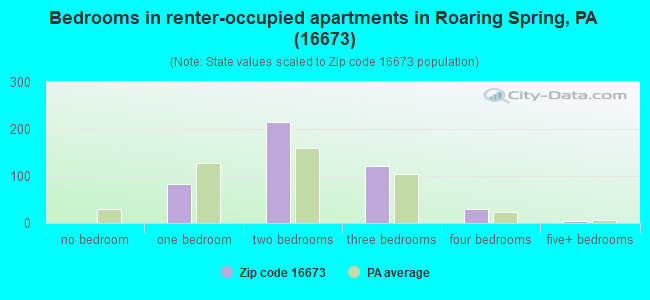
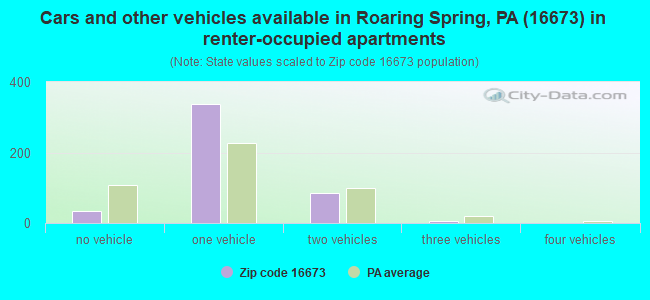
Houses and condos: 2,422 Renter-occupied apartments: 457
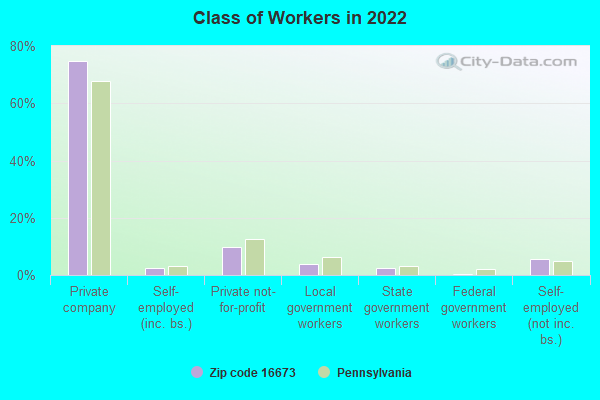
% of renters here:
21%
State:
31%
March 2022 cost of living index in zip code 16673: 90.8 (less than average, U.S. average is 100)
Land area: 31.1 sq. mi. Water area: 0.0 sq. mi.
Population density: 166 people per square mile
(very low).
OSM Map
General Map
Google Map
MSN Map
OSM Map
General Map
Google Map
MSN Map
OSM Map
General Map
Google Map
MSN Map
OSM Map
General Map
Google Map
MSN Map
Please wait while loading the map...
Real estate property taxes paid for housing units in 2022:
This zip code:
1.3% ($2,108)
Pennsylvania:
1.3% ($3,094)
Median real estate property taxes paid for housing units with mortgages in 2022: $2,150 (1.3%) Median real estate property taxes paid for housing units with no mortgage in 2022: $2,042 (1.2%)
Business Search- 14 Million verified businesses
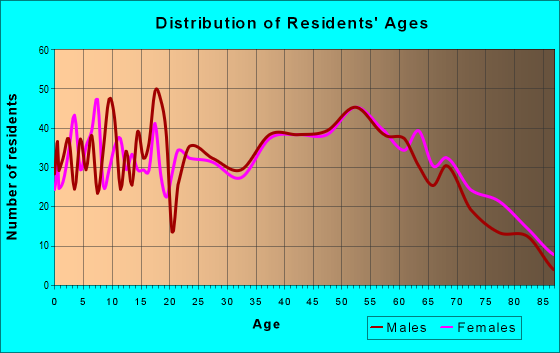
Males: 2,405
(46.5%)
Females: 2,763
(53.5%)
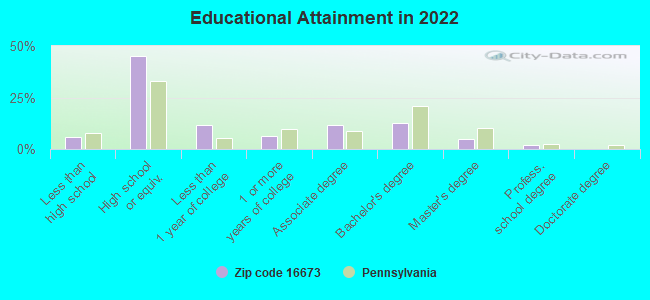
For population 25 years and over in 16673:
High school or higher: 93.3%
Bachelor's degree or higher: 19.7%
Graduate or professional degree: 7.2%
Unemployed: 2.5%
Mean travel time to work (commute): 28.3 minutes
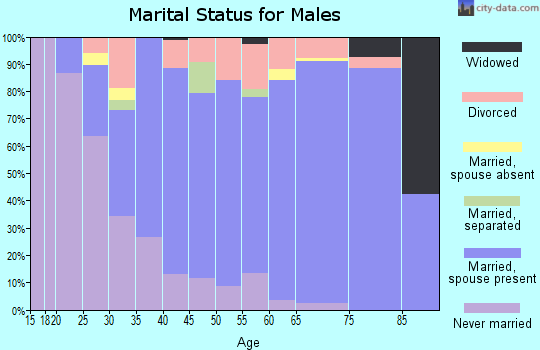
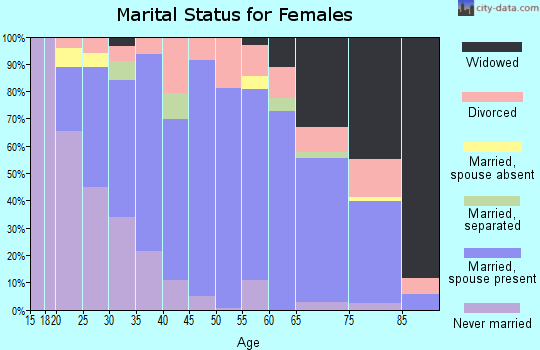
For population 15 years and over in 16673:
Never married: 27.2%
Now married: 56.8%
Separated: 2.6%
Widowed: 7.0%
Divorced: 6.4%
Zip code 16673 compared to state average:
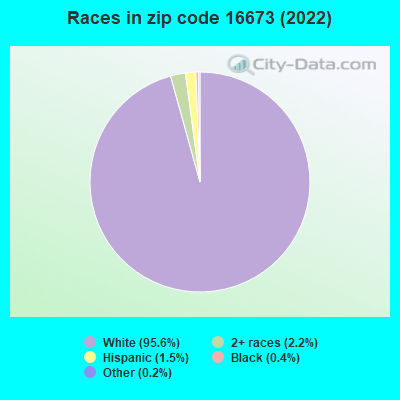
Black race population percentage significantly below state average.
Hispanic race population percentage significantly below state average.
Foreign-born population percentage significantly below state average.
Length of stay since moving in significantly above state average.
Percentage of population with a bachelor's degree or higher below state average.
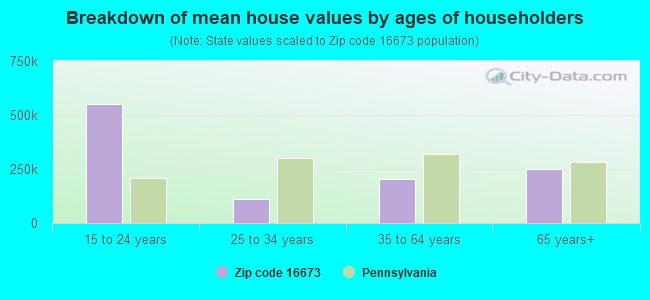
Estimated median house/condo value in 2022: $164,101
16673:
$164,101
Pennsylvania:
$245,500
According to our research of Pennsylvania and other state lists, there were 5 registered sex offenders living in 16673 zip code as of April 25, 2024. The ratio of all residents to sex offenders in zip code 16673 is 1,067 to 1. The ratio of registered sex offenders to all residents in this zip code is lower than the state average.
Median resident age:
This zip code:
43.7 years
Pennsylvania median age:
40.9 years
Average household size:
This zip code:
2.4 people
Pennsylvania:
2.4 people
Averages for the 2020 tax year for zip code 16673, filed in 2021:
Average Adjusted Gross Income (AGI) in 2020: $53,721 (Individual Income Tax Returns)
Here:
$53,721
State:
$75,707
Salary/wage: $47,790 (reported on 78.5% of returns)
Here:
$47,790
State:
$62,806
(% of AGI for various income ranges: 1093.6% for AGIs below $25k, 3540.6% for AGIs $25k-50k, 6013.9% for AGIs $50k-75k, 9345.2% for AGIs $75k-100k, 13052.3% for AGIs $100k-200k)
Taxable interest for individuals: $1,105 (reported on 31.7% of returns)
This zip code:
$1,105
Pennsylvania:
$1,633
(% of AGI for various income ranges: 23.6% for AGIs below $25k, 51.4% for AGIs $25k-50k, 33.6% for AGIs $50k-75k, 23.8% for AGIs $75k-100k, 83.6% for AGIs $100k-200k)
Ordinary dividends: $3,298 (reported on 18.1% of returns)
Here:
$3,298
State:
$7,382
(% of AGI for various income ranges: 29.3% for AGIs below $25k, 40.8% for AGIs $25k-50k, 35.2% for AGIs $50k-75k, 71.4% for AGIs $75k-100k, 290.0% for AGIs $100k-200k)
Net capital gain/loss in AGI: +$6,338 (reported on 14.7% of returns)
Here:
+$6,338
State:
+$23,522
(% of AGI for various income ranges: 12.9% for AGIs below $25k, 47.8% for AGIs $25k-50k, 23.9% for AGIs $50k-75k, 109.0% for AGIs $75k-100k, 332.3% for AGIs $100k-200k)
Profit/loss from business: +$11,209 (reported on 12.1% of returns)
Here:
+$11,209
State:
+$16,274
(% of AGI for various income ranges: 81.4% for AGIs below $25k, 115.9% for AGIs $25k-50k, 185.5% for AGIs $50k-75k, 266.2% for AGIs $75k-100k, 632.7% for AGIs $100k-200k)
Taxable individual retirement arrangement distribution: $14,957 (reported on 13.2% of returns)
16673:
$14,957
Pennsylvania:
$18,583
(% of AGI for various income ranges: 109.5% for AGIs below $25k, 176.9% for AGIs $25k-50k, 183.3% for AGIs $50k-75k, 347.6% for AGIs $75k-100k, 1100.0% for AGIs $100k-200k)
Total itemized deductions: $38,233 (reported on 2.3% of returns)
Here:
$38,233
State:
$34,850
(% of AGI for various income ranges: 106.9% for AGIs $25k-50k, 804.5% for AGIs $100k-200k)
Charity contributions: $13,580 (reported on 1.9% of returns)
Here:
$13,580
State:
$12,392
(% of AGI for various income ranges: 308.6% for AGIs $100k-200k)
Taxes paid: $7,233 (reported on 2.3% of returns)
16673:
$7,233
State:
$8,200
(% of AGI for various income ranges: 18.6% for AGIs $25k-50k, 155.9% for AGIs $100k-200k)
Earned income credit: $2,125 (reported on 10.6% of returns)
Here:
$2,125
State:
$2,100
(% of AGI for various income ranges: 60.7% for AGIs below $25k, 52.0% for AGIs $25k-50k)
Percentage of individuals using paid preparers for their 2020 taxes: 94.7%
Here:
95%
State:
92%
(% for various income ranges: 92.1% for AGIs below $25k, 93.9% for AGIs $25k-50k, 95.5% for AGIs $50k-75k, 100.0% for AGIs $75k-100k, 96.8% for AGIs $100k-200k, 100.0% for AGIs over 200k)
Averages for the 2012 tax year for zip code 16673, filed in 2013:
Average Adjusted Gross Income (AGI) in 2012: $45,758 (Individual Income Tax Returns)
Here:
$45,758
State:
$61,346
Salary/wage: $39,503 (reported on 83.6% of returns)
Here:
$39,503
State:
$51,902
(% of AGI for various income ranges: 67.9% for AGIs below $25k, 78.4% for AGIs $25k-50k, 79.1% for AGIs $50k-75k, 81.0% for AGIs $75k-100k, 79.9% for AGIs $100k-200k)
Taxable interest for individuals: $1,187 (reported on 33.2% of returns)
This zip code:
$1,187
Pennsylvania:
$1,588
(% of AGI for various income ranges: 1.6% for AGIs below $25k, 0.7% for AGIs $25k-50k, 0.6% for AGIs $50k-75k, 0.8% for AGIs $75k-100k, 1.4% for AGIs $100k-200k)
Ordinary dividends: $2,396 (reported on 18.8% of returns)
Here:
$2,396
State:
$5,827
(% of AGI for various income ranges: 1.6% for AGIs below $25k, 0.7% for AGIs $25k-50k, 0.8% for AGIs $50k-75k, 0.6% for AGIs $75k-100k, 1.9% for AGIs $100k-200k)
Net capital gain/loss in AGI: +$6,483 (reported on 11.7% of returns)
Here:
+$6,483
State:
+$14,495
(% of AGI for various income ranges: 0.3% for AGIs below $25k, 0.6% for AGIs $25k-50k, 0.8% for AGIs $50k-75k, 0.9% for AGIs $75k-100k, 6.3% for AGIs $100k-200k)
Profit/loss from business: +$13,158 (reported on 12.1% of returns)
Here:
+$13,158
State:
+$16,268
(% of AGI for various income ranges: 3.9% for AGIs below $25k, 3.4% for AGIs $25k-50k, 3.7% for AGIs $50k-75k, 1.5% for AGIs $75k-100k, 6.8% for AGIs $100k-200k)
Taxable individual retirement arrangement distribution: $11,160 (reported on 11.7% of returns)
16673:
$11,160
Pennsylvania:
$14,550
(% of AGI for various income ranges: 4.3% for AGIs below $25k, 2.9% for AGIs $25k-50k, 1.9% for AGIs $50k-75k, 1.6% for AGIs $75k-100k, 5.7% for AGIs $100k-200k)
Total itemized deductions: $18,443 (20% of AGI, reported on 16.4% of returns)
Here:
$18,443
State:
$23,538
Here:
20.0% of AGI
State:
18.4% of AGI
(% of AGI for various income ranges: 3.5% for AGIs below $25k, 4.0% for AGIs $25k-50k, 6.5% for AGIs $50k-75k, 7.3% for AGIs $75k-100k, 13.5% for AGIs $100k-200k)
Charity contributions: $5,347 (reported on 12.5% of returns)
Here:
$5,347
State:
$4,025
(% of AGI for various income ranges: 0.6% for AGIs below $25k, 0.6% for AGIs $25k-50k, 1.3% for AGIs $50k-75k, 1.6% for AGIs $75k-100k, 3.7% for AGIs $100k-200k)
Taxes paid: $5,971 (reported on 16.4% of returns)
16673:
$5,971
State:
$9,982
(% of AGI for various income ranges: 0.8% for AGIs below $25k, 0.8% for AGIs $25k-50k, 1.8% for AGIs $50k-75k, 2.2% for AGIs $75k-100k, 5.7% for AGIs $100k-200k)
Earned income credit: $2,018 (reported on 14.8% of returns)
Here:
$2,018
State:
$2,106
(% of AGI for various income ranges: 4.2% for AGIs below $25k, 1.1% for AGIs $25k-50k)
Percentage of individuals using paid preparers for their 2012 taxes: 59.0%
Here:
59%
State:
53%
(% for various income ranges: 52.5% for AGIs below $25k, 57.4% for AGIs $25k-50k, 65.1% for AGIs $50k-75k, 66.7% for AGIs $75k-100k, 70.6% for AGIs $100k-200k, 100.0% for AGIs over 200k)
Averages for the 2004 tax year for zip code 16673, filed in 2005:
Average Adjusted Gross Income (AGI) in 2004: $37,941 (Individual Income Tax Returns)
Here:
$37,941
State:
$48,049
Salary/wage: $33,775 (reported on 85.2% of returns)
Here:
$33,775
State:
$42,646
(% of AGI for various income ranges: 98.5% for AGIs below $10k, 71.2% for AGIs $10k-25k, 82.7% for AGIs $25k-50k, 87.3% for AGIs $50k-75k, 79.4% for AGIs $75k-100k, 46.8% for AGIs over 100k)
Taxable interest for individuals: $1,263 (reported on 48.7% of returns)
This zip code:
$1,263
Pennsylvania:
$1,657
(% of AGI for various income ranges: 4.2% for AGIs below $10k, 2.5% for AGIs $10k-25k, 1.3% for AGIs $25k-50k, 0.9% for AGIs $50k-75k, 1.3% for AGIs $75k-100k, 2.6% for AGIs over 100k)
Taxable dividends: $1,566 (reported on 22.5% of returns)
Here:
$1,566
State:
$3,566
(% of AGI for various income ranges: 2.2% for AGIs below $10k, 0.9% for AGIs $10k-25k, 0.5% for AGIs $25k-50k, 0.6% for AGIs $50k-75k, 0.5% for AGIs $75k-100k, 2.2% for AGIs over 100k)
Net capital gain/loss: +$3,622 (reported on 15.8% of returns)
Here:
+$3,622
State:
+$9,716
(% of AGI for various income ranges: 0.2% for AGIs below $10k, 0.9% for AGIs $10k-25k, 0.9% for AGIs $25k-50k, 0.7% for AGIs $50k-75k, 0.7% for AGIs $75k-100k, 4.8% for AGIs over 100k)
Profit/loss from business: +$12,254 (reported on 13.7% of returns)
Here:
+$12,254
State:
+$14,267
(% of AGI for various income ranges: 1.4% for AGIs below $10k, 5.4% for AGIs $10k-25k, 3.0% for AGIs $25k-50k, 2.5% for AGIs $50k-75k, 6.4% for AGIs $75k-100k, 7.3% for AGIs over 100k)
IRA payment deduction: $2,783 (reported on 3.4% of returns)
16673:
$2,783
Pennsylvania:
$2,903
(% of AGI for various income ranges: 0.3% for AGIs $10k-25k, 0.4% for AGIs $25k-50k, 0.2% for AGIs $50k-75k, 0.5% for AGIs $75k-100k)
Total itemized deductions: $13,998 (18% of AGI, reported on 19.9% of returns)
Here:
$13,998
State:
$18,804
Here:
18.3% of AGI
State:
19.5% of AGI
(% of AGI for various income ranges: 4.1% for AGIs $10k-25k, 6.2% for AGIs $25k-50k, 7.8% for AGIs $50k-75k, 10.5% for AGIs $75k-100k, 8.7% for AGIs over 100k)
Charity contributions deductions: $3,820 (5% of AGI, reported on 17.0% of returns)
Here:
$3,820
State:
$3,337
Here:
4.7% of AGI
State:
3.3% of AGI
(% of AGI for various income ranges: 0.8% for AGIs $10k-25k, 1.0% for AGIs $25k-50k, 1.7% for AGIs $50k-75k, 2.6% for AGIs $75k-100k, 2.7% for AGIs over 100k)
Total tax: $4,968 (reported on 75.1% of returns)
16673:
$4,968
State:
$8,008
(% of AGI for various income ranges: 1.8% for AGIs below $10k, 4.5% for AGIs $10k-25k, 6.5% for AGIs $25k-50k, 8.4% for AGIs $50k-75k, 10.5% for AGIs $75k-100k, 20.4% for AGIs over 100k)
Earned income credit: $1,539 (reported on 13.1% of returns)
Here:
$1,539
State:
$1,643
Percentage of individuals using paid preparers for their 2004 taxes: 59.0%
Here:
59%
State:
56%
(% for various income ranges: 48.0% for AGIs below $10k, 56.9% for AGIs $10k-25k, 61.8% for AGIs $25k-50k, 64.0% for AGIs $50k-75k, 64.8% for AGIs $75k-100k, 80.0% for AGIs over 100k)
Household received Food Stamps/SNAP in the past 12 months: 302 Household did not receive Food Stamps/SNAP in the past 12 months: 1,848
Women who had a birth in the past 12 months: 32 (31 now married, 2 unmarried) Women who did not have a birth in the past 12 months: 1,266 (570 now married, 693 unmarried)
Housing units in zip code 16673 with a mortgage: 987 (87 second mortgage, 4 home equity loan, 78 both second mortgage and home equity loan) Houses without a mortgage: 86
Median monthly owner costs for units with a mortgage: $1,147 Median monthly owner costs for units without a mortgage: $515
Residents with income below the poverty level in 2022:
This zip code:
10.0%
Whole state:
11.8%
Residents with income below 50% of the poverty level in 2022:
This zip code:
4.3%
Whole state:
6.1%
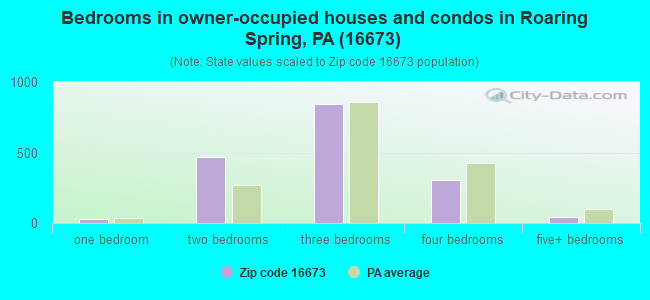
Median number of rooms in houses and condos:
Here:
6.6
State:
6.8
Median number of rooms in apartments:
Here:
4.9
State:
4.3
Notable locations in this zip code not listed on our city pages
In group quarters: 29 (-1 institutionalized population)
Size of family households: 815 2-persons, 327 3-persons, 219 4-persons, 121 5-persons, 29 6-persons, 18 7-or-more-persons
Size of nonfamily households: 561 1-person, 49 2-persons
737 married couples with children.
229 single-parent households (36 men, 193 women).
95.2% of residents of 16673 zip code speak English at home.
0.9% of residents speak Spanish at home (50% very well, 15% well, 35% not well).
3.1% of residents speak other Indo-European language at home (74% very well, 26% well).
0.2% of residents speak Asian or Pacific Island language at home (45% very well, 9% well, 45% not well).
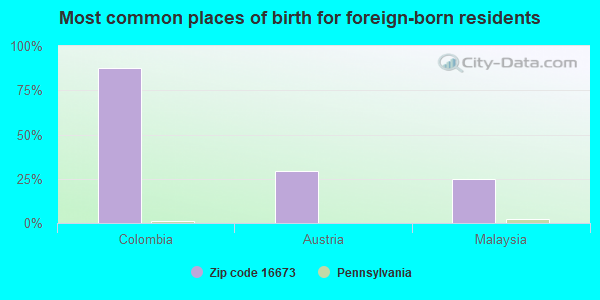
Foreign born population: 25 (0.5%) (67.6% of them are naturalized citizens)
This zip code:
0.5%
Whole state:
7.5%
88%Colombia
29%Austria
25%Malaysia
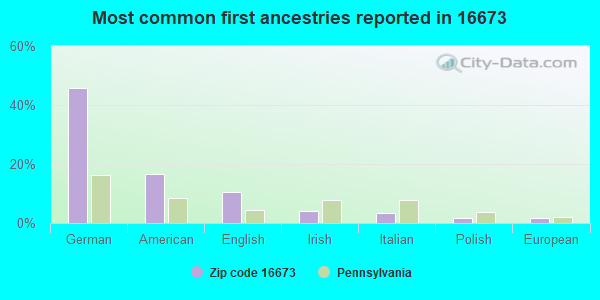
46%German
16%American
11%English
4%Irish
3%Italian
2%Polish
2%European
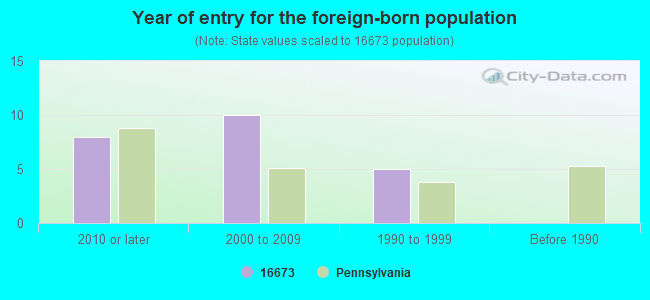
Year of entry for the foreign-born population
82010 or later
102000 to 2009
51990 to 1999
0Before 1990
Facilities with environmental interests located in this zip code:
APPLETON ROARING SPRING PAPER MFG (100 PAPER MILL RD. in ROARING SPRING, PA)
AIR MAJOR (AIRS/AFS) ENFORCEMENT/COMPLIANCE ACTIVITY (Integrated Compliance Information System) - ICIS-03-1987-0406, FORMAL ENFORCEMENT ACTION, ICIS-03-1998-0108, ICIS-03-1998-0345, ICIS-03-1977-0012, ICIS-03-1999-0042, (Integrated Compliance Information System) - ICIS-03-1987-0406, FORMAL ENFORCEMENT ACTION, ICIS-03-1998-0108, ICIS-03-1998-0345, ICIS-03-1977-0012, ICIS-03-1999-0042, COMPLIANCE ACTIVITY (Tracking inspections of insecticide, fungicide, and rodenticide, and toxic substances) CRITERIA AND HAZARDOUS AIR POLLUTANT INVENTORY (Inventory of air pollution sources) STATE MASTER (Pennsylvania database) - AFS-23-0385230-1, AIR PROGRAM, RCRIS-PAD0971289112, HAZARDOUS WASTE PROGRAM National Pollutant Discharge Elimination System MAJOR (Tracking pollutant discharge elimination systems) - permit Small Quantity Generators, between 100 kg and 1000 kg of hazardous waste/month (Resource Conservation and Recovery Act (tracking hazardous waste)) TRI REPORTER (Tracking of toxic chemicals releasing facilities) Business SIC classification: PULP MILLS; PAPER MILLS; COATED AND LAMINATED PAPER Business NAICS classification: PAPER (EXCEPT NEWSPRINT) MILLS. Organizations: OPERNAME (CONTACT/OPERATOR)
Alternative names: APPLETON PAPER CO, APPLETON PAPERS INC., APPLETON PAPERS INC SPRING MILL, APPLETON PAPERS/SPRING MILL
BAKERS SUMMIT AUTO (RT 867 1 MI N OF RT 868 in BAKERS SUMMIT, PA)
Conditionally Exempt Small Quantity Generators, less than 100 kg/month of hazardous waste (Resource Conservation and Recovery Act (tracking hazardous waste)) - notification Organizations: RITCHEY GEORGE (CONTACT/OWNER)
Housing units lacking complete plumbing facilities: 2.2% Housing units lacking complete kitchen facilities: 3.6%
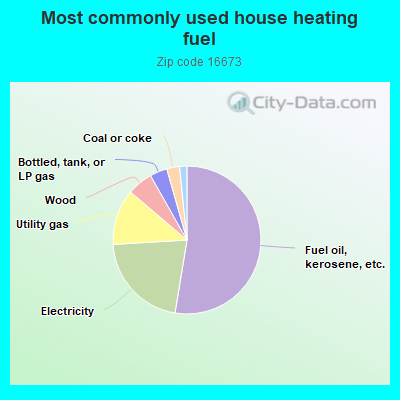
52.7%Fuel oil, kerosene, etc.
21.5%Electricity
12.2%Utility gas
5.6%Wood
3.8%Bottled, tank, or LP gas
2.8%Coal or coke
1.0%Other fuel
0.6%No fuel used
Population in 1990: 4,942. Population change in the 1990s: +81 (+1.6%).
Place of birth for U.S.-born residents:
This state: 4,784
Northeast: 74
Midwest: 28
South: 194
West: 14
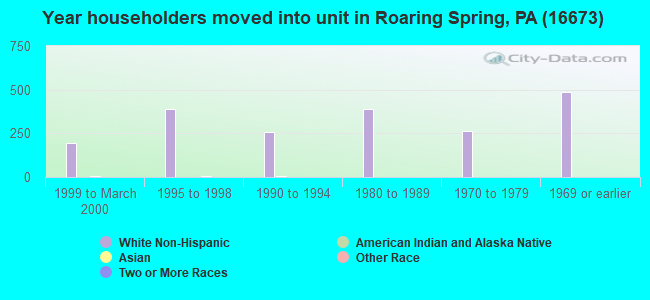
73% of the 16673 zip code residents lived in the same house 5 years ago. Out of people who lived in different houses, 65% lived in this county. Out of people who lived in different counties, 50% lived in Pennsylvania.
94% of the 16673 zip code residents lived in the same house 1 year ago. Out of people who lived in different houses, 60% moved from this county. Out of people who lived in different houses, 31% moved from different county within same state. Out of people who lived in different houses, 7% moved from different state. Out of people who lived in different houses, 4% moved from abroad.
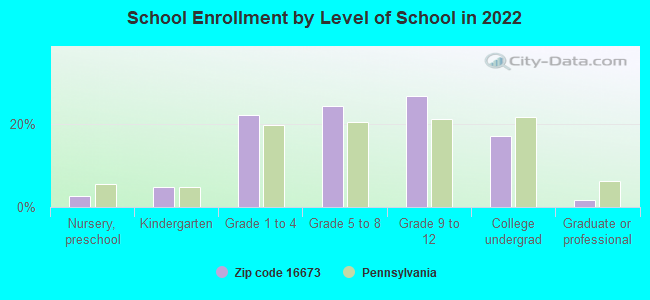
Private vs. public school enrollment:
Students in private schools in grades 1 to 8 (elementary and middle school): 60
Here:
13.6%
Pennsylvania:
15.7%
Students in private schools in grades 9 to 12 (high school): 11
Here:
4.4%
Pennsylvania:
13.4%
Students in private undergraduate colleges: 8
Here:
5.0%
Pennsylvania:
39.8%
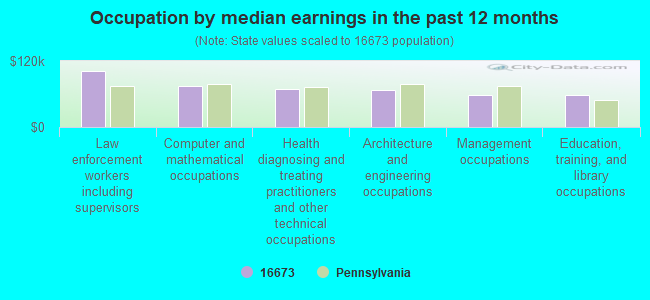
Occupation by median earnings in the past 12 months ($)
101,784Law enforcement workers including supervisors
75,236Computer and mathematical occupations
68,583Health diagnosing and treating practitioners and other technical occupations
66,461Architecture and engineering occupations
58,018Management occupations
57,822Education, training, and library occupations
Companies with federal contracts located in this zip code:
ROARING SPRING BLANK BOOK CO (740 SPANG ST in ROARING SPRING, PA; small business) : $99,066 in 19 contractsfrom 2003 to 2006
Contracts for Beverages, Nonalcoholic, , Food, Oils and Fats by Army, National Institutes of Health, National Park Service Signed by year:2000: $0; 2001: $0; 2002: $0; 2003: $18,711; 2004: $39,476; 2005: $40,786; 2006: $93.
Biggest contracts:
$35,771 with Army for Beverages, Nonalcoholic. Signed on 2005-11-28. Completion date: 2005-11-30.
$31,393, same as above.Signed on 2004-11-19. Completion date: 2005-11-30.
$19,639, same as above.Signed on 2003-09-30. Completion date: 2004-09-30.
$5,777, same as above.Signed on 2004-09-30. Completion date: 2004-09-30.
ORCHARD LANE EXCAVATING, INC (ORCHARD RD in ROARING SPRING, PA; small business)
$39,960 with U.S. Army Corps of Engineers - civil program financing only for Construction of Structures and Facilities -- Highways, Roads, Streets, Bridges, and Railways (includes resurfacing). Signed on 2002-03-19. Completion date: 2002-04-30.
YELLOWBANANAS COM, INC (300 MAIN ST in ROARING SPRING, PA; small business)
$130 with Army for Information Retrieval. Signed on 2005-02-09. Completion date: 2006-04-10.
Top industries in this zip code by the number of employees in 2005:
Health Care and Social Assistance: General Medical and Surgical Hospitals (250-499 employees: 1 establishment)
Management of Companies and Enterprises: Corporate, Subsidiary, and Regional Managing Offices (50-99: 1, 20-49: 1)
Accommodation and Food Services: Limited-Service Restaurants (20-49: 3, 1-4: 1)
Other Services (except Public Administration): Religious Organizations (20-49: 1, 10-19: 1, 5-9: 3, 1-4: 4)
Health Care and Social Assistance: Offices of Physicians (except Mental Health Specialists) (20-49: 1, 10-19: 2, 5-9: 1, 1-4: 2)
Real Estate and Rental and Leasing: Construction, Mining, and Forestry Machinery and Equipment Rental and Leasing (50-99: 1)
Information: Data Processing, Hosting, and Related Services (50-99: 1)
People in group quarters in 2010:
3 people in group homes intended for adults
People in group quarters in 2000:
3 people in homes for the mentally retarded
Fatal accident statistics in 2013:
Fatal accident count: 1
Vehicles involved in fatal accidents: 3
Fatal accidents caused by drunken drivers: 0
Fatalities: 1
Persons involved in fatal accidents: 5
Pedestrians involved in fatal accidents: 0
Fatal accident statistics in 2010:
Fatal accident count: 1
Vehicles involved in fatal accidents: 1
Fatal accidents caused by drunken drivers: 0
Fatalities: 1
Persons involved in fatal accidents: 1
Pedestrians involved in fatal accidents: 0
Home Mortgage Disclosure Act Aggregated Statistics For Year 2009 (Based on 1 full and 2 partial tracts)
A) FHA, FSA/RHS & VA Home Purchase Loans
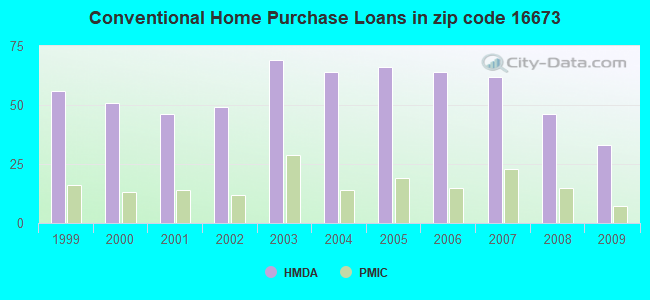
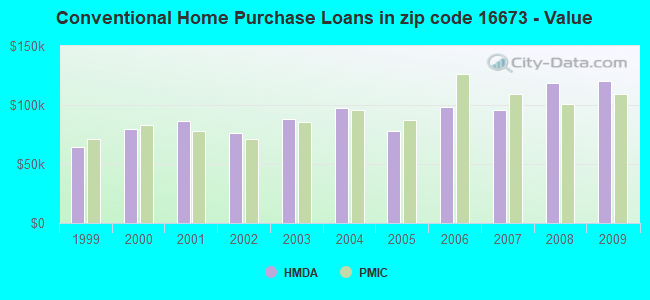
B) Conventional Home Purchase Loans
C) Refinancings
D) Home Improvement Loans
E) Loans on Dwellings For 5+ Families
F) Non-occupant Loans on < 5 Family Dwellings (A B C & D)
G) Loans On Manufactured Home Dwelling (A B C & D)
Number
Average Value
Number
Average Value
Number
Average Value
Number
Average Value
Number
Average Value
Number
Average Value
Number
Average Value
LOANS ORIGINATED
21
$115,510
33
$119,958
108
$114,474
29
$37,722
2
$262,600
4
$54,670
3
$46,797
APPLICATIONS APPROVED, NOT ACCEPTED
2
$60,230
1
$65,000
9
$122,198
2
$9,595
0
$0
1
$65,000
1
$132,310
APPLICATIONS DENIED
2
$151,500
2
$87,900
47
$110,008
11
$14,036
0
$0
3
$23,220
4
$47,342
APPLICATIONS WITHDRAWN
4
$110,848
3
$98,967
39
$130,117
0
$0
0
$0
1
$61,610
3
$106,390
FILES CLOSED FOR INCOMPLETENESS
0
$0
0
$0
9
$114,082
1
$12,120
0
$0
0
$0
0
$0
Aggregated Statistics For Year 2008 (Based on 1 full and 2 partial tracts)
A) FHA, FSA/RHS & VA Home Purchase Loans
B) Conventional Home Purchase Loans
C) Refinancings
D) Home Improvement Loans
E) Loans on Dwellings For 5+ Families
F) Non-occupant Loans on < 5 Family Dwellings (A B C & D)
G) Loans On Manufactured Home Dwelling (A B C & D)
Number
Average Value
Number
Average Value
Number
Average Value
Number
Average Value
Number
Average Value
Number
Average Value
Number
Average Value
LOANS ORIGINATED
11
$120,487
46
$118,228
87
$103,048
31
$26,868
1
$147,000
14
$122,582
4
$71,458
APPLICATIONS APPROVED, NOT ACCEPTED
0
$0
4
$53,308
11
$91,155
2
$8,585
0
$0
2
$126,000
4
$48,825
APPLICATIONS DENIED
3
$120,767
10
$109,361
95
$110,892
35
$86,413
0
$0
4
$91,502
12
$96,424
APPLICATIONS WITHDRAWN
3
$171,000
6
$186,008
19
$145,653
4
$26,260
0
$0
2
$63,125
0
$0
FILES CLOSED FOR INCOMPLETENESS
0
$0
0
$0
11
$144,029
1
$50,500
0
$0
0
$0
0
$0
Aggregated Statistics For Year 2007 (Based on 1 full and 2 partial tracts)
A) FHA, FSA/RHS & VA Home Purchase Loans
B) Conventional Home Purchase Loans
C) Refinancings
D) Home Improvement Loans
E) Loans on Dwellings For 5+ Families
F) Non-occupant Loans on < 5 Family Dwellings (A B C & D)
G) Loans On Manufactured Home Dwelling (A B C & D)
Number
Average Value
Number
Average Value
Number
Average Value
Number
Average Value
Number
Average Value
Number
Average Value
Number
Average Value
LOANS ORIGINATED
7
$82,713
62
$95,993
68
$112,232
43
$26,601
4
$1,780,138
12
$119,373
8
$70,975
APPLICATIONS APPROVED, NOT ACCEPTED
0
$0
9
$84,508
20
$86,911
7
$54,481
0
$0
2
$151,000
3
$32,993
APPLICATIONS DENIED
3
$97,607
18
$78,686
80
$90,047
36
$48,472
0
$0
4
$35,880
24
$63,672
APPLICATIONS WITHDRAWN
0
$0
4
$97,465
25
$108,853
8
$49,112
0
$0
1
$145,440
1
$90,000
FILES CLOSED FOR INCOMPLETENESS
0
$0
4
$57,240
13
$126,651
0
$0
0
$0
0
$0
0
$0
Aggregated Statistics For Year 2006 (Based on 1 full and 2 partial tracts)
A) FHA, FSA/RHS & VA Home Purchase Loans
B) Conventional Home Purchase Loans
C) Refinancings
D) Home Improvement Loans
F) Non-occupant Loans on < 5 Family Dwellings (A B C & D)
G) Loans On Manufactured Home Dwelling (A B C & D)
Number
Average Value
Number
Average Value
Number
Average Value
Number
Average Value
Number
Average Value
Number
Average Value
LOANS ORIGINATED
8
$90,292
64
$98,534
97
$76,305
39
$27,945
9
$57,100
8
$76,379
APPLICATIONS APPROVED, NOT ACCEPTED
0
$0
5
$97,768
30
$105,167
2
$7,575
0
$0
3
$64,640
APPLICATIONS DENIED
0
$0
8
$103,044
81
$84,616
42
$43,561
8
$32,748
6
$73,937
APPLICATIONS WITHDRAWN
2
$106,395
10
$77,267
34
$85,056
0
$0
6
$58,635
3
$69,690
FILES CLOSED FOR INCOMPLETENESS
0
$0
1
$56,000
4
$73,750
1
$80,800
0
$0
0
$0
Aggregated Statistics For Year 2005 (Based on 1 full and 2 partial tracts)
A) FHA, FSA/RHS & VA Home Purchase Loans
B) Conventional Home Purchase Loans
C) Refinancings
D) Home Improvement Loans
F) Non-occupant Loans on < 5 Family Dwellings (A B C & D)
G) Loans On Manufactured Home Dwelling (A B C & D)
Number
Average Value
Number
Average Value
Number
Average Value
Number
Average Value
Number
Average Value
Number
Average Value
LOANS ORIGINATED
5
$92,526
66
$78,116
115
$78,738
39
$46,671
9
$64,889
10
$47,838
APPLICATIONS APPROVED, NOT ACCEPTED
0
$0
4
$81,145
22
$78,549
1
$11,000
1
$120,000
3
$68,193
APPLICATIONS DENIED
1
$82,820
9
$80,363
107
$86,406
61
$37,128
8
$9,828
10
$71,170
APPLICATIONS WITHDRAWN
0
$0
4
$58,075
48
$91,303
6
$110,063
2
$37,370
0
$0
FILES CLOSED FOR INCOMPLETENESS
0
$0
2
$130,795
8
$82,359
0
$0
0
$0
0
$0
Aggregated Statistics For Year 2004 (Based on 1 full and 2 partial tracts)
A) FHA, FSA/RHS & VA Home Purchase Loans
B) Conventional Home Purchase Loans
C) Refinancings
D) Home Improvement Loans
E) Loans on Dwellings For 5+ Families
F) Non-occupant Loans on < 5 Family Dwellings (A B C & D)
G) Loans On Manufactured Home Dwelling (A B C & D)
Number
Average Value
Number
Average Value
Number
Average Value
Number
Average Value
Number
Average Value
Number
Average Value
Number
Average Value
LOANS ORIGINATED
6
$106,167
64
$97,270
137
$77,291
39
$39,985
3
$1,215,000
9
$56,919
13
$71,780
APPLICATIONS APPROVED, NOT ACCEPTED
0
$0
8
$84,511
22
$78,594
3
$23,500
0
$0
0
$0
4
$63,730
APPLICATIONS DENIED
1
$74,740
15
$84,713
84
$86,869
19
$38,761
0
$0
2
$56,000
11
$71,463
APPLICATIONS WITHDRAWN
2
$82,370
8
$68,056
43
$77,018
6
$26,845
0
$0
1
$60,000
5
$54,742
FILES CLOSED FOR INCOMPLETENESS
0
$0
1
$130,000
17
$85,126
0
$0
0
$0
0
$0
0
$0
Aggregated Statistics For Year 2003 (Based on 1 full and 2 partial tracts)
A) FHA, FSA/RHS & VA Home Purchase Loans
B) Conventional Home Purchase Loans
C) Refinancings
D) Home Improvement Loans
E) Loans on Dwellings For 5+ Families
F) Non-occupant Loans on < 5 Family Dwellings (A B C & D)
Number
Average Value
Number
Average Value
Number
Average Value
Number
Average Value
Number
Average Value
Number
Average Value
LOANS ORIGINATED
8
$86,896
69
$88,098
252
$77,416
31
$32,856
2
$1,295,500
8
$63,635
APPLICATIONS APPROVED, NOT ACCEPTED
2
$80,000
8
$73,185
34
$79,929
3
$28,400
0
$0
1
$142,410
APPLICATIONS DENIED
3
$67,173
10
$53,845
107
$82,534
15
$43,792
0
$0
2
$46,915
APPLICATIONS WITHDRAWN
1
$64,000
5
$90,802
62
$99,501
3
$8,367
0
$0
2
$59,590
FILES CLOSED FOR INCOMPLETENESS
0
$0
3
$131,813
5
$81,044
2
$28,190
0
$0
1
$52,000
Aggregated Statistics For Year 2002 (Based on 1 full and 2 partial tracts)
A) FHA, FSA/RHS & VA Home Purchase Loans
B) Conventional Home Purchase Loans
C) Refinancings
D) Home Improvement Loans
E) Loans on Dwellings For 5+ Families
F) Non-occupant Loans on < 5 Family Dwellings (A B C & D)
Number
Average Value
Number
Average Value
Number
Average Value
Number
Average Value
Number
Average Value
Number
Average Value
LOANS ORIGINATED
12
$92,507
49
$76,105
158
$1,270,679
20
$30,407
1
$129,280
4
$7,499,615
APPLICATIONS APPROVED, NOT ACCEPTED
0
$0
5
$62,140
32
$74,849
6
$91,710
0
$0
0
$0
APPLICATIONS DENIED
0
$0
14
$54,136
116
$94,229
14
$28,952
0
$0
3
$82,023
APPLICATIONS WITHDRAWN
1
$59,627,000
5
$63,784
47
$86,511
2
$25,755
0
$0
0
$0
FILES CLOSED FOR INCOMPLETENESS
0
$0
1
$143,420
10
$78,598
0
$0
0
$0
1
$143,420
Aggregated Statistics For Year 2001 (Based on 1 full and 2 partial tracts)
A) FHA, FSA/RHS & VA Home Purchase Loans
B) Conventional Home Purchase Loans
C) Refinancings
D) Home Improvement Loans
F) Non-occupant Loans on < 5 Family Dwellings (A B C & D)
Number
Average Value
Number
Average Value
Number
Average Value
Number
Average Value
Number
Average Value
LOANS ORIGINATED
8
$72,010
46
$86,486
129
$73,142
25
$14,530
6
$84,653
APPLICATIONS APPROVED, NOT ACCEPTED
3
$76,900
7
$48,429
18
$80,957
5
$25,138
0
$0
APPLICATIONS DENIED
2
$70,500
23
$55,704
67
$64,754
18
$17,457
3
$51,833
APPLICATIONS WITHDRAWN
1
$124,000
1
$76,760
31
$81,913
11
$20,372
1
$51,000
FILES CLOSED FOR INCOMPLETENESS
0
$0
0
$0
3
$89,607
2
$20,200
0
$0
Aggregated Statistics For Year 2000 (Based on 1 full and 2 partial tracts)
A) FHA, FSA/RHS & VA Home Purchase Loans
B) Conventional Home Purchase Loans
C) Refinancings
D) Home Improvement Loans
F) Non-occupant Loans on < 5 Family Dwellings (A B C & D)
Number
Average Value
Number
Average Value
Number
Average Value
Number
Average Value
Number
Average Value
LOANS ORIGINATED
11
$70,315
51
$79,796
49
$51,948
53
$17,005
3
$24,427
APPLICATIONS APPROVED, NOT ACCEPTED
2
$49,800
5
$105,758
15
$45,469
6
$22,978
1
$70,700
APPLICATIONS DENIED
3
$68,333
33
$45,795
30
$58,508
21
$15,957
2
$17,170
APPLICATIONS WITHDRAWN
0
$0
5
$43,486
14
$42,779
6
$30,833
1
$43,430
FILES CLOSED FOR INCOMPLETENESS
0
$0
0
$0
5
$41,600
0
$0
0
$0
Aggregated Statistics For Year 1999 (Based on 1 full and 1 partial tracts)
A) FHA, FSA/RHS & VA Home Purchase Loans
B) Conventional Home Purchase Loans
C) Refinancings
D) Home Improvement Loans
F) Non-occupant Loans on < 5 Family Dwellings (A B C & D)
Detailed PMIC statistics for the following Tracts:0114.00
, 0115.00
2006 - 2018 National Fire Incident Reporting System (NFIRS) incidents
According to the data from the years 2006 - 2018 the average number of fire incidents per year is 10. The highest number of reported fires - 42 took place in 2016, and the least - 0 in 2008. The data has a growing trend.
When looking into fire subcategories, the most reports belonged to: Structure Fires (63.7%), and Outside Fires (15.6%).
Fire incident types reported to NFIRS in Zip Code 16673


 Nearest zip codes: 16631, 16682, 16637, 16665, 16662, 16625.


 According to the data from the years 2006 - 2018 the average number of fire incidents per year is 10. The highest number of reported fires - 42 took place in 2016, and the least - 0 in 2008. The data has a growing trend.
 When looking into fire subcategories, the most reports belonged to: Structure Fires (63.7%), and Outside Fires (15.6%).