Estimated zip code population in 2022: 2,360 Zip code population in 2010: 2,818 Zip code population in 2000: 2,956
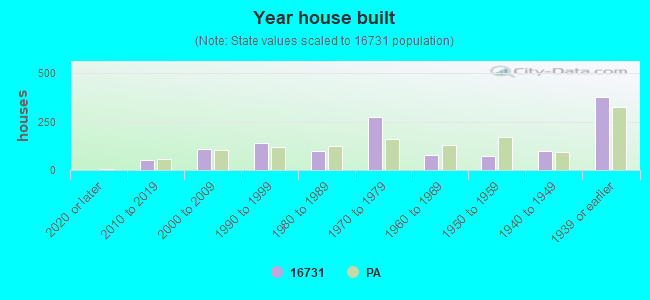
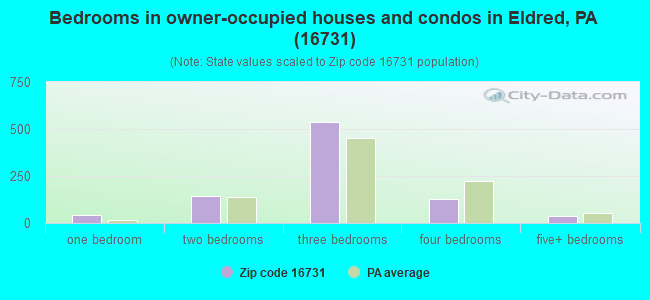
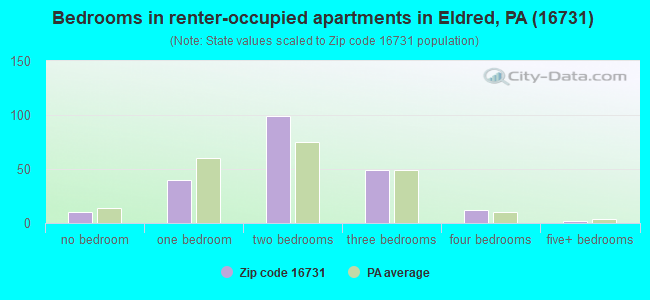
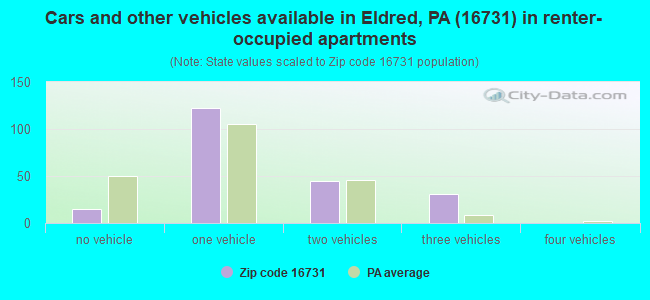
Houses and condos: 1,308 Renter-occupied apartments: 212
% of renters here:
19%
State:
31%
March 2022 cost of living index in zip code 16731: 89.9 (less than average, U.S. average is 100)
Land area: 59.3 sq. mi. Water area: 0.5 sq. mi.
Population density: 40 people per square mile
(very low).
OSM Map
General Map
Google Map
MSN Map
OSM Map
General Map
Google Map
MSN Map
OSM Map
General Map
Google Map
MSN Map
OSM Map
General Map
Google Map
MSN Map
Please wait while loading the map...
Real estate property taxes paid for housing units in 2022:
This zip code:
1.3% ($1,432)
Pennsylvania:
1.3% ($3,094)
Median real estate property taxes paid for housing units with mortgages in 2022: $1,533 (1.4%) Median real estate property taxes paid for housing units with no mortgage in 2022: $1,347 (1.3%)
Business Search- 14 Million verified businesses
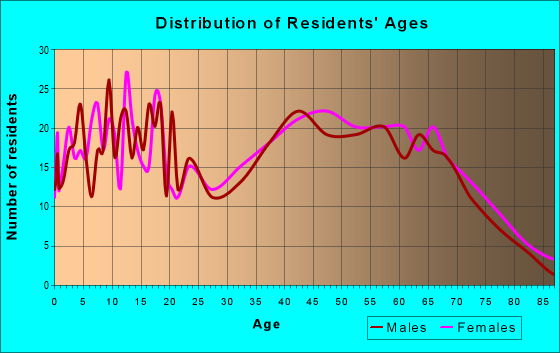
Males: 1,220
(51.7%)
Females: 1,139
(48.3%)
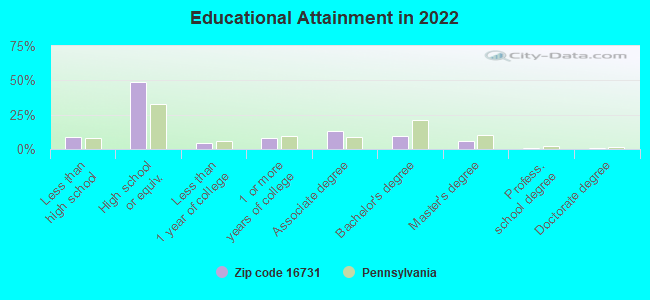
For population 25 years and over in 16731:
High school or higher: 90.2%
Bachelor's degree or higher: 17.1%
Graduate or professional degree: 7.6%
Unemployed: 7.7%
Mean travel time to work (commute): 26.1 minutes
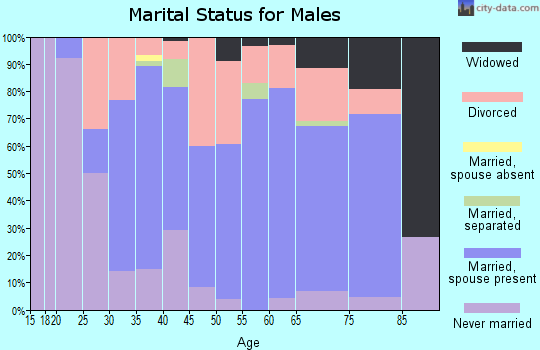
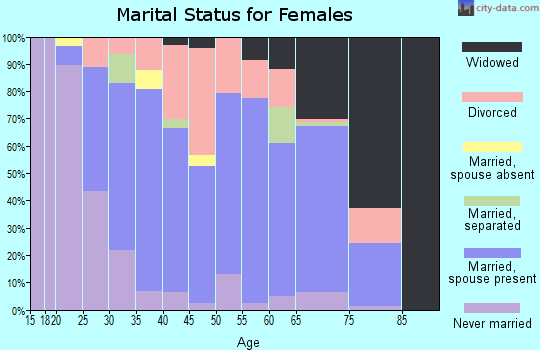
For population 15 years and over in 16731:
Never married: 23.8%
Now married: 50.1%
Separated: 0.4%
Widowed: 9.5%
Divorced: 16.2%
Zip code 16731 compared to state average:
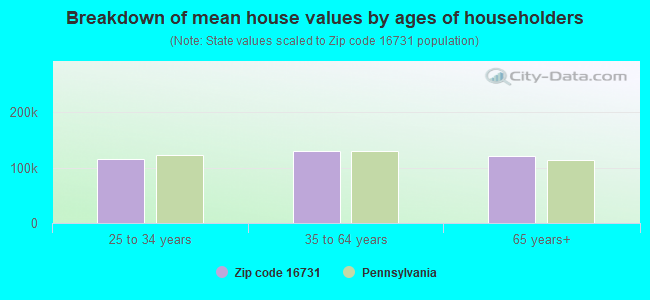
Median house value significantly below state average.
Unemployed percentage above state average.
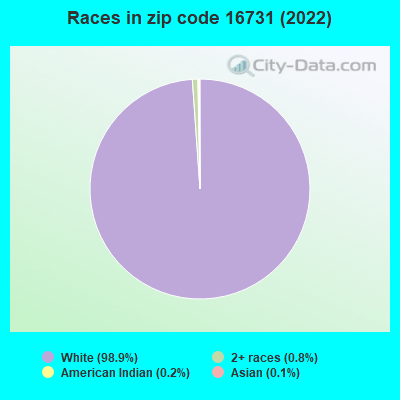
Black race population percentage significantly below state average.
Hispanic race population percentage significantly below state average.
Median age significantly above state average.
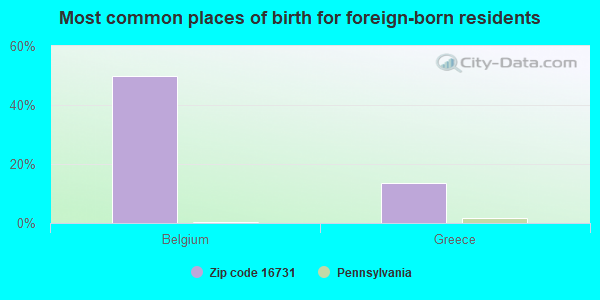
Foreign-born population percentage significantly below state average.
Renting percentage below state average.
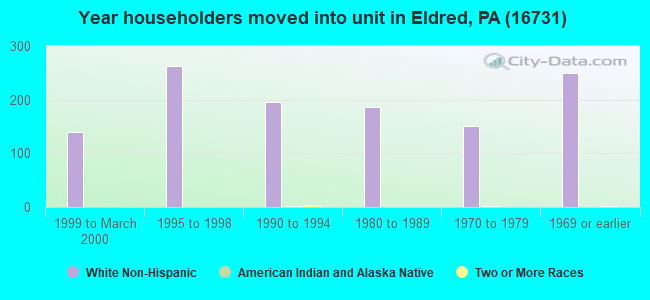
Length of stay since moving in significantly above state average.
Percentage of population with a bachelor's degree or higher below state average.
Averages for the 2020 tax year for zip code 16731, filed in 2021:
Average Adjusted Gross Income (AGI) in 2020: $51,601 (Individual Income Tax Returns)
Here:
$51,601
State:
$75,707
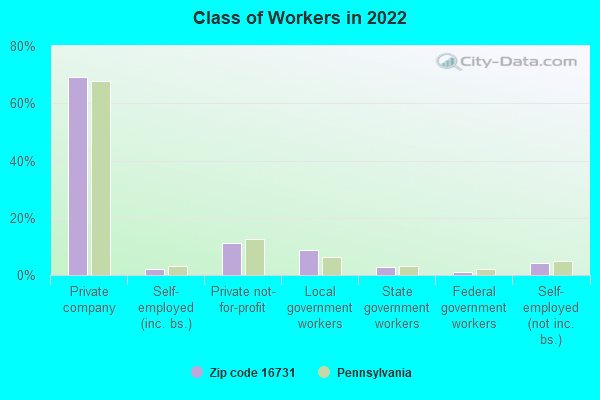
Salary/wage: $44,513 (reported on 78.9% of returns)
Here:
$44,513
State:
$62,806
(% of AGI for various income ranges: 972.1% for AGIs below $25k, 3200.7% for AGIs $25k-50k, 5906.1% for AGIs $50k-75k, 9027.0% for AGIs $75k-100k, 18517.5% for AGIs $100k-200k)
Taxable interest for individuals: $602 (reported on 33.8% of returns)
This zip code:
$602
Pennsylvania:
$1,633
(% of AGI for various income ranges: 12.4% for AGIs below $25k, 13.9% for AGIs $25k-50k, 24.4% for AGIs $50k-75k, 15.0% for AGIs $75k-100k, 163.8% for AGIs $100k-200k)
Ordinary dividends: $2,126 (reported on 17.3% of returns)
Here:
$2,126
State:
$7,382
(% of AGI for various income ranges: 25.0% for AGIs below $25k, 16.8% for AGIs $25k-50k, 30.0% for AGIs $50k-75k, 29.0% for AGIs $75k-100k, 342.5% for AGIs $100k-200k)
Net capital gain/loss in AGI: +$4,469 (reported on 12.0% of returns)
Here:
+$4,469
State:
+$23,522
(% of AGI for various income ranges: 10.0% for AGIs below $25k, 21.4% for AGIs $25k-50k, 93.9% for AGIs $50k-75k, 104.0% for AGIs $75k-100k, 435.0% for AGIs $100k-200k)
Profit/loss from business: +$9,757 (reported on 10.5% of returns)
Here:
+$9,757
State:
+$16,274
(% of AGI for various income ranges: 79.4% for AGIs below $25k, 244.6% for AGIs $25k-50k, 411.0% for AGIs $75k-100k)
Taxable individual retirement arrangement distribution: $14,169 (reported on 12.0% of returns)
16731:
$14,169
Pennsylvania:
$18,583
(% of AGI for various income ranges: 95.9% for AGIs below $25k, 75.7% for AGIs $25k-50k, 506.7% for AGIs $50k-75k, 1021.2% for AGIs $100k-200k)
Earned income credit: $2,271 (reported on 15.8% of returns)
Here:
$2,271
State:
$2,100
(% of AGI for various income ranges: 84.1% for AGIs below $25k, 68.2% for AGIs $25k-50k)
Percentage of individuals using paid preparers for their 2020 taxes: 96.2%
Here:
96%
State:
92%
(% for various income ranges: 93.8% for AGIs below $25k, 97.1% for AGIs $25k-50k, 95.7% for AGIs $50k-75k, 100.0% for AGIs $75k-100k, 100.0% for AGIs $100k-200k, 100.0% for AGIs over 200k)
Averages for the 2012 tax year for zip code 16731, filed in 2013:
Average Adjusted Gross Income (AGI) in 2012: $43,319 (Individual Income Tax Returns)
Here:
$43,319
State:
$61,346
Salary/wage: $38,139 (reported on 82.6% of returns)
Here:
$38,139
State:
$51,902
(% of AGI for various income ranges: 66.4% for AGIs below $25k, 82.0% for AGIs $25k-50k, 82.2% for AGIs $50k-75k, 74.7% for AGIs $75k-100k, 59.2% for AGIs $100k-200k)
Taxable interest for individuals: $670 (reported on 34.8% of returns)
This zip code:
$670
Pennsylvania:
$1,588
(% of AGI for various income ranges: 0.9% for AGIs below $25k, 0.6% for AGIs $25k-50k, 0.4% for AGIs $50k-75k, 0.2% for AGIs $75k-100k, 0.7% for AGIs $100k-200k)
Ordinary dividends: $1,773 (reported on 16.7% of returns)
Here:
$1,773
State:
$5,827
(% of AGI for various income ranges: 0.5% for AGIs below $25k, 0.4% for AGIs $25k-50k, 1.0% for AGIs $50k-75k, 0.2% for AGIs $75k-100k, 1.1% for AGIs $100k-200k)
Net capital gain/loss in AGI: +$218 (reported on 8.3% of returns)
Here:
+$218
State:
+$14,495
(% of AGI for various income ranges: 0.3% for AGIs $50k-75k)
Profit/loss from business: +$7,820 (reported on 11.4% of returns)
Here:
+$7,820
State:
+$16,268
(% of AGI for various income ranges: 5.5% for AGIs below $25k, 1.9% for AGIs $25k-50k, 2.4% for AGIs $50k-75k, 2.7% for AGIs $75k-100k)
Taxable individual retirement arrangement distribution: $9,340 (reported on 11.4% of returns)
16731:
$9,340
Pennsylvania:
$14,550
(% of AGI for various income ranges: 5.1% for AGIs below $25k, 2.6% for AGIs $25k-50k, 1.7% for AGIs $50k-75k, 5.3% for AGIs $75k-100k)
Total itemized deductions: $19,112 (19% of AGI, reported on 12.1% of returns)
Here:
$19,112
State:
$23,538
Here:
18.5% of AGI
State:
18.4% of AGI
(% of AGI for various income ranges: 4.2% for AGIs $25k-50k, 4.8% for AGIs $50k-75k, 4.9% for AGIs $75k-100k, 9.3% for AGIs $100k-200k)
Charity contributions: $3,989 (reported on 6.8% of returns)
Here:
$3,989
State:
$4,025
Taxes paid: $6,506 (reported on 12.1% of returns)
16731:
$6,506
State:
$9,982
(% of AGI for various income ranges: 0.8% for AGIs $25k-50k, 1.2% for AGIs $50k-75k, 1.5% for AGIs $75k-100k, 4.1% for AGIs $100k-200k)
Earned income credit: $2,124 (reported on 18.9% of returns)
Here:
$2,124
State:
$2,106
(% of AGI for various income ranges: 5.9% for AGIs below $25k, 1.1% for AGIs $25k-50k)
Percentage of individuals using paid preparers for their 2012 taxes: 72.7%
Here:
73%
State:
53%
(% for various income ranges: 67.2% for AGIs below $25k, 71.9% for AGIs $25k-50k, 81.0% for AGIs $50k-75k, 75.0% for AGIs $75k-100k, 88.9% for AGIs $100k-200k)
Averages for the 2004 tax year for zip code 16731, filed in 2005:
Average Adjusted Gross Income (AGI) in 2004: $34,374 (Individual Income Tax Returns)
Here:
$34,374
State:
$48,049
Salary/wage: $30,271 (reported on 87.8% of returns)
Here:
$30,271
State:
$42,646
(% of AGI for various income ranges: 85.9% for AGIs below $10k, 75.3% for AGIs $10k-25k, 86.1% for AGIs $25k-50k, 85.1% for AGIs $50k-75k, 85.5% for AGIs $75k-100k, 40.3% for AGIs over 100k)
Taxable interest for individuals: $974 (reported on 43.9% of returns)
This zip code:
$974
Pennsylvania:
$1,657
(% of AGI for various income ranges: 4.7% for AGIs below $10k, 1.9% for AGIs $10k-25k, 0.9% for AGIs $25k-50k, 0.8% for AGIs $50k-75k, 0.8% for AGIs $75k-100k, 1.9% for AGIs over 100k)
Taxable dividends: $1,317 (reported on 17.2% of returns)
Here:
$1,317
State:
$3,566
(% of AGI for various income ranges: 0.5% for AGIs below $10k, 0.4% for AGIs $10k-25k, 0.5% for AGIs $25k-50k, 0.7% for AGIs $50k-75k, 0.3% for AGIs $75k-100k, 1.5% for AGIs over 100k)
Net capital gain/loss: +$2,840 (reported on 11.8% of returns)
Here:
+$2,840
State:
+$9,716
(% of AGI for various income ranges: -0.8% for AGIs below $10k, -0.0% for AGIs $10k-25k, 0.5% for AGIs $25k-50k, 0.2% for AGIs $50k-75k, 0.1% for AGIs $75k-100k, 5.1% for AGIs over 100k)
Profit/loss from business: +$4,253 (reported on 13.2% of returns)
Here:
+$4,253
State:
+$14,267
(% of AGI for various income ranges: 4.2% for AGIs below $10k, 2.9% for AGIs $10k-25k, 1.8% for AGIs $25k-50k, 0.2% for AGIs $50k-75k, 3.5% for AGIs over 100k)
IRA payment deduction: $2,933 (reported on 2.3% of returns)
16731:
$2,933
Pennsylvania:
$2,903
Total itemized deductions: $13,698 (17% of AGI, reported on 11.3% of returns)
Here:
$13,698
State:
$18,804
Here:
17.2% of AGI
State:
19.5% of AGI
(% of AGI for various income ranges: 9.6% for AGIs below $10k, 3.5% for AGIs $25k-50k, 3.8% for AGIs $50k-75k, 8.1% for AGIs $75k-100k, 7.4% for AGIs over 100k)
Charity contributions deductions: $2,764 (3% of AGI, reported on 8.3% of returns)
Here:
$2,764
State:
$3,337
Here:
3.2% of AGI
State:
3.3% of AGI
(% of AGI for various income ranges: 2.4% for AGIs below $10k, 0.5% for AGIs $25k-50k, 0.7% for AGIs $50k-75k, 1.5% for AGIs $75k-100k, 0.5% for AGIs over 100k)
Total tax: $4,129 (reported on 71.1% of returns)
16731:
$4,129
State:
$8,008
(% of AGI for various income ranges: 1.4% for AGIs below $10k, 3.8% for AGIs $10k-25k, 6.5% for AGIs $25k-50k, 8.2% for AGIs $50k-75k, 10.3% for AGIs $75k-100k, 17.1% for AGIs over 100k)
Earned income credit: $1,651 (reported on 19.3% of returns)
Here:
$1,651
State:
$1,643
Percentage of individuals using paid preparers for their 2004 taxes: 73.2%
Here:
73%
State:
56%
(% for various income ranges: 70.8% for AGIs below $10k, 71.1% for AGIs $10k-25k, 74.2% for AGIs $25k-50k, 78.6% for AGIs $50k-75k, 70.0% for AGIs $75k-100k, 81.1% for AGIs over 100k)
Household received Food Stamps/SNAP in the past 12 months: 149 Household did not receive Food Stamps/SNAP in the past 12 months: 950
Women who had a birth in the past 12 months: 12 (9 now married, 2 unmarried) Women who did not have a birth in the past 12 months: 359 (135 now married, 223 unmarried)
Housing units in zip code 16731 with a mortgage: 400 (26 second mortgage, 9 both second mortgage and home equity loan) Houses without a mortgage: 40
Median monthly owner costs for units with a mortgage: $922 Median monthly owner costs for units without a mortgage: $457
Residents with income below the poverty level in 2022:
This zip code:
10.0%
Whole state:
11.8%
Residents with income below 50% of the poverty level in 2022:
This zip code:
5.9%
Whole state:
6.1%
Median number of rooms in houses and condos:
Here:
6.4
State:
6.8
Median number of rooms in apartments:
Here:
4.7
State:
4.3
Notable locations in this zip code not listed on our city pages
Notable locations in zip code 16731: Bonnet (A), Eldred Township Volunteer Fire Department Station 18 (B), Eldred Borough Volunteer Fire Department Station 4 (C). Display/hide their locations on the map
Streams, rivers, and creeks: Newell Creek (A), Potato Creek (B), Fowler Brook (C), McCrea Run (D), Rices Creek (E), Carpenter Creek (F), Canfield Creek (G), Barden Brook (H), Louds Creek (I). Display/hide their locations on the map
In group quarters: 6 (-1 institutionalized population)
Size of family households: 333 2-persons, 123 3-persons, 115 4-persons, 29 5-persons, 25 6-persons, 8 7-or-more-persons
Size of nonfamily households: 430 1-person, 26 2-persons, 7 3-persons
195 married couples with children.
97 single-parent households (49 men, 48 women).
97.7% of residents of 16731 zip code speak English at home.
0.2% of residents speak Spanish at home (100% very well).
1.8% of residents speak other Indo-European language at home (75% very well, 18% well, 8% not well).
Foreign born population: 23 (1.0%) (82.4% of them are naturalized citizens)
This zip code:
1.0%
Whole state:
7.5%
50%Belgium
14%Greece
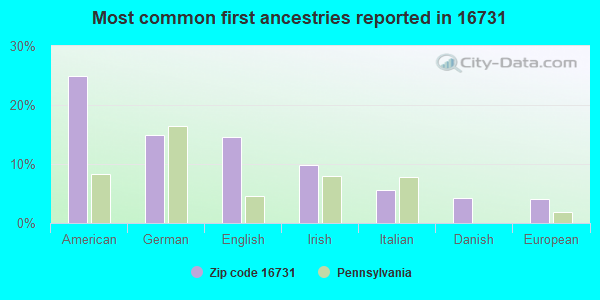
25%American
15%German
15%English
10%Irish
6%Italian
4%Danish
4%European
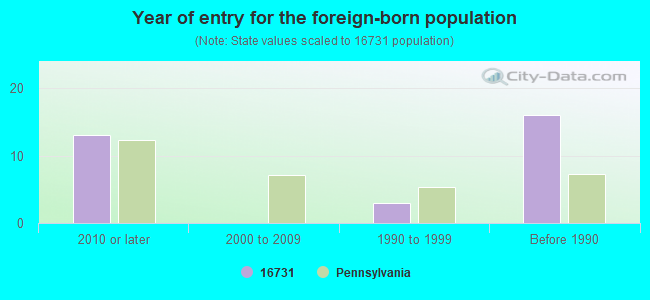
Year of entry for the foreign-born population
132010 or later
02000 to 2009
31990 to 1999
16Before 1990
Housing units lacking complete plumbing facilities: 3.3% Housing units lacking complete kitchen facilities: 0.6%
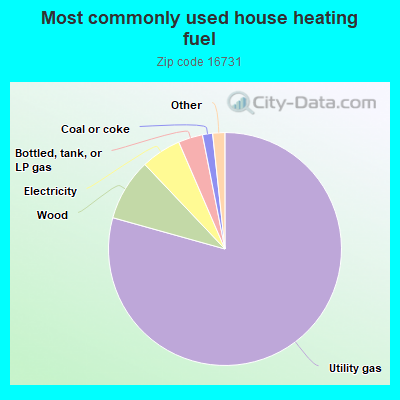
79.5%Utility gas
8.6%Wood
5.6%Electricity
3.4%Bottled, tank, or LP gas
1.4%Coal or coke
0.9%Fuel oil, kerosene, etc.
0.6%Other fuel
Population in 1990: 2,616. Population change in the 1990s: +340 (+13.0%).
Place of birth for U.S.-born residents:
This state: 1,114
Northeast: 1,094
Midwest: 37
South: 89
West: 12
73% of the 16731 zip code residents lived in the same house 5 years ago. Out of people who lived in different houses, 68% lived in this county. Out of people who lived in different counties, 50% lived in Pennsylvania.
95% of the 16731 zip code residents lived in the same house 1 year ago. Out of people who lived in different houses, 65% moved from this county. Out of people who lived in different houses, 12% moved from different county within same state. Out of people who lived in different houses, 26% moved from different state.
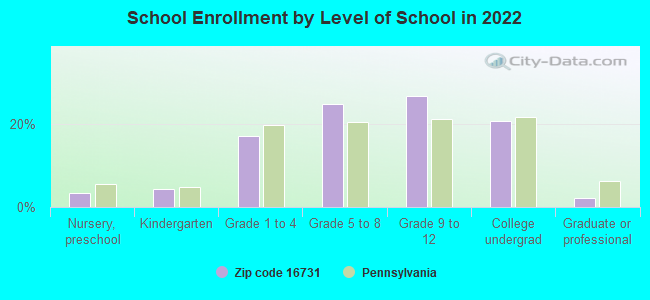
Private vs. public school enrollment:
Students in private schools in grades 1 to 8 (elementary and middle school): 8
Here:
5.6%
Pennsylvania:
15.7%
Students in private schools in grades 9 to 12 (high school):
Here:
0.0%
Pennsylvania:
13.4%
Students in private undergraduate colleges: 28
Here:
38.4%
Pennsylvania:
39.8%
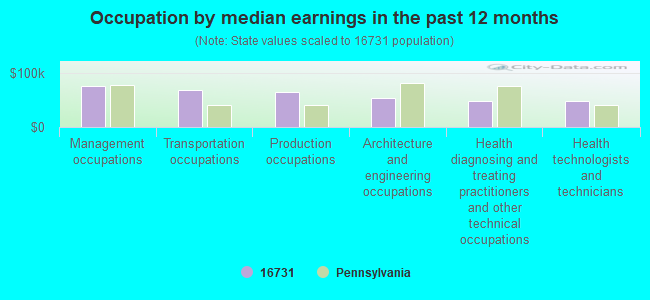
Occupation by median earnings in the past 12 months ($)
75,500Management occupations
67,926Transportation occupations
64,646Production occupations
54,229Architecture and engineering occupations
48,657Health diagnosing and treating practitioners and other technical occupations
48,504Health technologists and technicians
Companies with federal contracts located in this zip code:
HERITAGE SURVEYS (No data from D and B in ELDRED, PA; small business) 2 employees, $0 revenue. : $49,000 in 6 contractsfrom 2000 to 2002
Contracts for Land Surveys, Cadastral Services (non-construction) by Forest Service (disused code: now 12C2) Signed by year:2000: $6,000; 2001: $0; 2002: $43,000; 2003: $0; 2004: $0; 2005: $0; 2006: $0.
Biggest contracts:
$16,000 with Forest Service (disused code: now 12C2) for Land Surveys, Cadastral Services (non-construction). Signed on 2002-08-15. Completion date: 2002-09-15.
$13,000, same as above.Signed on 2002-08-15. Completion date: 2002-09-15.
$9,000, same as above.Signed on 2002-08-15. Completion date: 2002-09-15.
$6,000, same as above.Signed on 2000-02-15. Completion date: 2000-12-15.
Top industries in this zip code by the number of employees in 2005:
Health Care and Social Assistance: Residential Mental Retardation Facilities (50-99 employees: 1 establishment)
Other Services (except Public Administration): Labor Unions and Similar Labor Organizations (20-49: 1, 5-9: 1)
Accommodation and Food Services: Full-Service Restaurants (10-19: 1, 5-9: 1)
Other Services (except Public Administration): Religious Organizations (5-9: 2, 1-4: 2)
Construction: Site Preparation Contractors (10-19: 1, 1-4: 1)
People in group quarters in 2010:
2 people in other noninstitutional facilities
Fatal accident statistics in 2014:
Fatal accident count: 1
Vehicles involved in fatal accidents: 2
Fatal accidents caused by drunken drivers: 0
Fatalities: 1
Persons involved in fatal accidents: 4
Pedestrians involved in fatal accidents: 0
Fatal accident statistics in 2013:
Fatal accident count: 1
Vehicles involved in fatal accidents: 2
Fatal accidents caused by drunken drivers: 1
Fatalities: 1
Persons involved in fatal accidents: 4
Pedestrians involved in fatal accidents: 0
Most common first names in zip code 16731 among deceased individuals
Name
Count
Lived (average)
John
27
71.3 years
Robert
24
67.2 years
Mary
21
78.3 years
William
20
77.4 years
George
19
73.6 years
James
14
71.8 years
Ruth
13
79.4 years
Margaret
13
72.1 years
Richard
13
72.0 years
Helen
12
73.3 years
Most common last names in zip code 16731 among deceased individuals
Last name
Count
Lived (average)
Brown
13
79.1 years
Bennett
13
72.7 years
Smith
11
78.7 years
Bell
10
76.4 years
Wood
10
79.3 years
Baker
9
72.8 years
Vaughn
9
67.4 years
Cawley
8
81.0 years
Johnson
7
74.2 years
App
7
72.0 years
Businesses in zip code 16731
H&R Block: 1
Discuss Eldred, Pennsylvania (PA) on our hugely popular Pennsylvania forum.
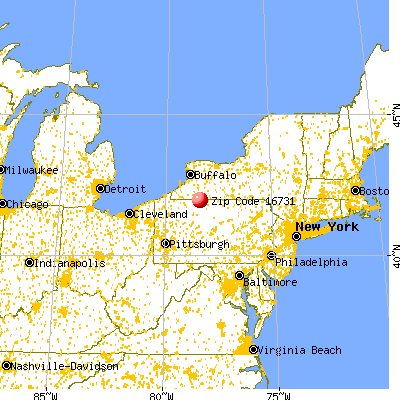


 Nearest zip codes: 16750, 14770, 14788, 14721, 16729, 16745.