Estimated zip code population in 2022: 6,250 Zip code population in 2010: 5,591 Zip code population in 2000: 5,222
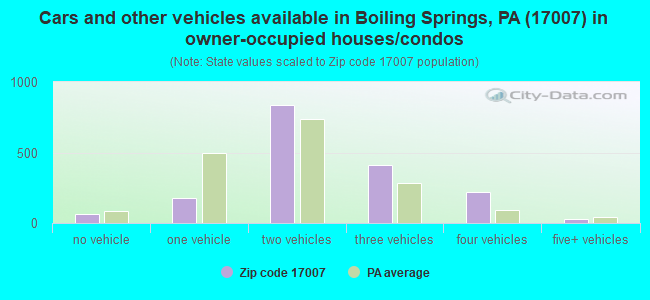
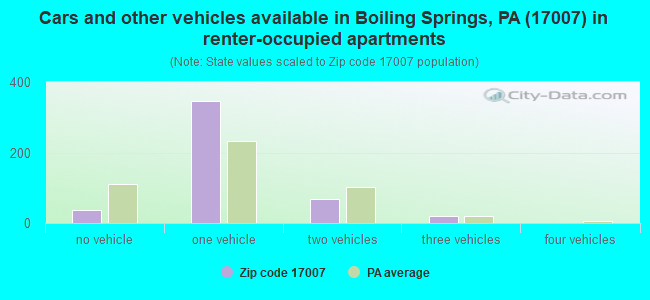
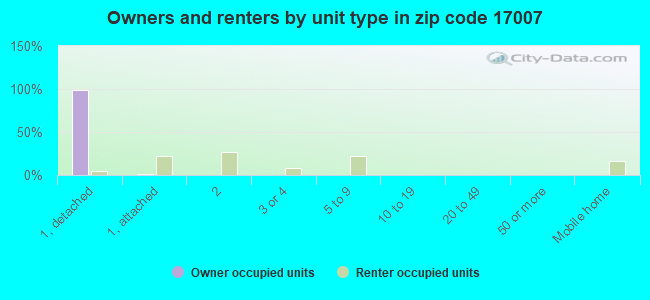
Houses and condos: 2,223 Renter-occupied apartments: 472
% of renters here:
21%
State:
31%
March 2022 cost of living index in zip code 17007: 92.2 (less than average, U.S. average is 100)
Land area: 20.8 sq. mi. Water area: 0.2 sq. mi.
Population density: 301 people per square mile
(very low).
OSM Map
General Map
Google Map
MSN Map
OSM Map
General Map
Google Map
MSN Map
OSM Map
General Map
Google Map
MSN Map
OSM Map
General Map
Google Map
MSN Map
Please wait while loading the map...
Real estate property taxes paid for housing units in 2022:
This zip code:
1.0% ($3,194)
Pennsylvania:
1.3% ($3,094)
Median real estate property taxes paid for housing units with mortgages in 2022: $3,676 (0.9%) Median real estate property taxes paid for housing units with no mortgage in 2022: $2,737 (1.0%)
Business Search- 14 Million verified businesses
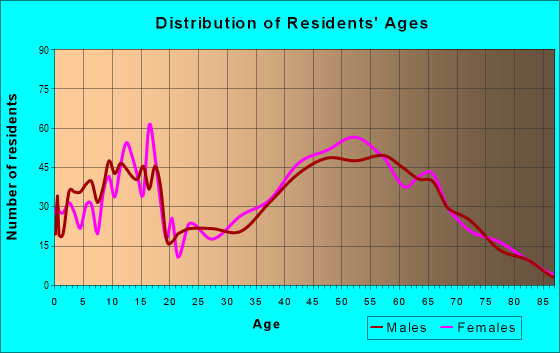
Males: 3,189
(51.0%)
Females: 3,061
(49.0%)
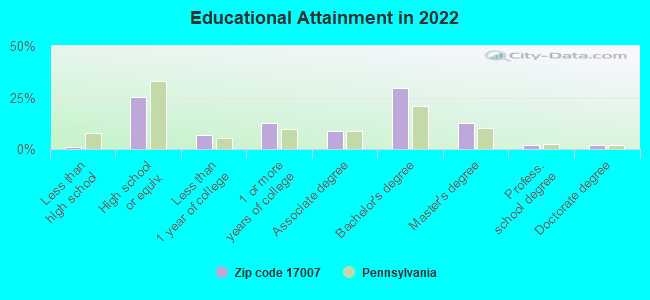
For population 25 years and over in 17007:
High school or higher: 99.9%
Bachelor's degree or higher: 46.1%
Graduate or professional degree: 16.5%
Unemployed: 1.9%
Mean travel time to work (commute): 19.7 minutes
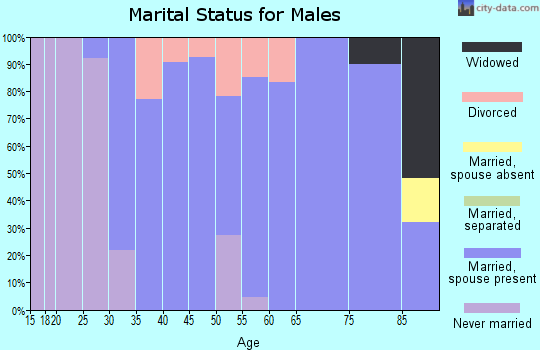
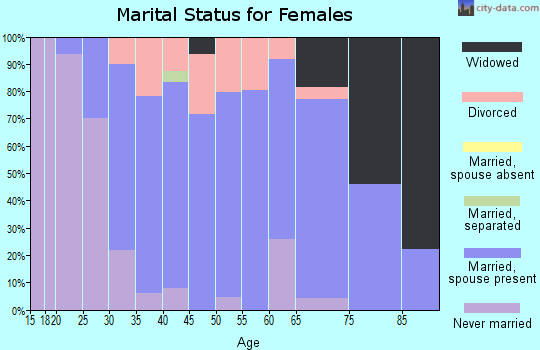
For population 15 years and over in 17007:
Never married: 28.2%
Now married: 59.3%
Separated: 1.2%
Widowed: 3.9%
Divorced: 7.5%
Zip code 17007 compared to state average:
Unemployed percentage below state average.
Black race population percentage significantly below state average.
Hispanic race population percentage significantly below state average.
Foreign-born population percentage below state average.
Length of stay since moving in significantly above state average.
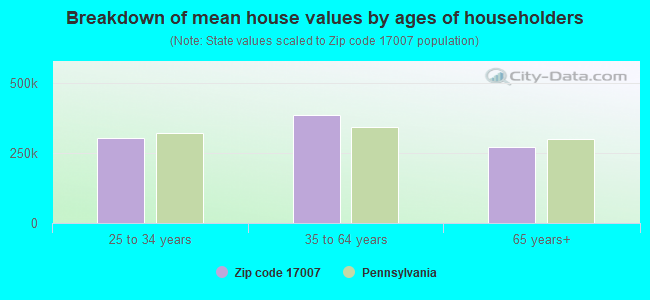
Estimated median house/condo value in 2022: $320,387
17007:
$320,387
Pennsylvania:
$245,500
According to our research of Pennsylvania and other state lists, there were 3 registered sex offenders living in 17007 zip code as of April 23, 2024. The ratio of all residents to sex offenders in zip code 17007 is 1,893 to 1. The ratio of registered sex offenders to all residents in this zip code is much lower than the state average.
Median resident age:
This zip code:
42.9 years
Pennsylvania median age:
40.9 years
Average household size:
This zip code:
2.8 people
Pennsylvania:
2.4 people
Averages for the 2020 tax year for zip code 17007, filed in 2021:
Average Adjusted Gross Income (AGI) in 2020: $88,427 (Individual Income Tax Returns)
Here:
$88,427
State:
$75,707
Salary/wage: $73,011 (reported on 77.9% of returns)
Here:
$73,011
State:
$62,806
(% of AGI for various income ranges: 1090.7% for AGIs below $25k, 3350.0% for AGIs $25k-50k, 5788.5% for AGIs $50k-75k, 8058.0% for AGIs $75k-100k, 16494.2% for AGIs $100k-200k, 69293.3% for AGIs over 200k)
Taxable interest for individuals: $1,270 (reported on 45.6% of returns)
This zip code:
$1,270
Pennsylvania:
$1,633
(% of AGI for various income ranges: 29.6% for AGIs below $25k, 36.3% for AGIs $25k-50k, 48.2% for AGIs $50k-75k, 70.0% for AGIs $75k-100k, 148.6% for AGIs $100k-200k, 805.0% for AGIs over 200k)
Ordinary dividends: $4,786 (reported on 32.9% of returns)
Here:
$4,786
State:
$7,382
(% of AGI for various income ranges: 51.1% for AGIs below $25k, 82.4% for AGIs $25k-50k, 123.6% for AGIs $50k-75k, 256.8% for AGIs $75k-100k, 342.8% for AGIs $100k-200k, 2705.0% for AGIs over 200k)
Net capital gain/loss in AGI: +$13,401 (reported on 28.2% of returns)
Here:
+$13,401
State:
+$23,522
(% of AGI for various income ranges: 12.0% for AGIs below $25k, 70.3% for AGIs $25k-50k, 83.3% for AGIs $50k-75k, 231.6% for AGIs $75k-100k, 587.4% for AGIs $100k-200k, 12593.3% for AGIs over 200k)
Profit/loss from business: +$16,388 (reported on 13.8% of returns)
Here:
+$16,388
State:
+$16,274
(% of AGI for various income ranges: 56.2% for AGIs below $25k, 144.7% for AGIs $25k-50k, 171.5% for AGIs $50k-75k, 380.0% for AGIs $75k-100k, 564.7% for AGIs $100k-200k, 3286.7% for AGIs over 200k)
Taxable individual retirement arrangement distribution: $22,128 (reported on 15.4% of returns)
17007:
$22,128
Pennsylvania:
$18,583
(% of AGI for various income ranges: 114.2% for AGIs below $25k, 199.7% for AGIs $25k-50k, 366.1% for AGIs $50k-75k, 457.6% for AGIs $75k-100k, 999.5% for AGIs $100k-200k, 3760.0% for AGIs over 200k)
Self-employed (Keogh) retirement plans: $14,350 (reported on 0.7% of returns)
17007:
$14,350
Pennsylvania:
$25,407
(% of AGI for various income ranges: 66.7% for AGIs $100k-200k)
Total itemized deductions: $32,915 (reported on 8.7% of returns)
Here:
$32,915
State:
$34,850
(% of AGI for various income ranges: 142.9% for AGIs below $25k, 239.1% for AGIs $50k-75k, 454.0% for AGIs $75k-100k, 665.1% for AGIs $100k-200k, 5218.3% for AGIs over 200k)
Charity contributions: $9,560 (reported on 6.7% of returns)
Here:
$9,560
State:
$12,392
(% of AGI for various income ranges: 58.8% for AGIs $50k-75k, 50.4% for AGIs $75k-100k, 189.3% for AGIs $100k-200k, 1296.7% for AGIs over 200k)
Taxes paid: $8,035 (reported on 8.7% of returns)
17007:
$8,035
State:
$8,200
(% of AGI for various income ranges: 29.6% for AGIs below $25k, 63.0% for AGIs $50k-75k, 102.0% for AGIs $75k-100k, 205.8% for AGIs $100k-200k, 1013.3% for AGIs over 200k)
Earned income credit: $1,944 (reported on 6.0% of returns)
Here:
$1,944
State:
$2,100
(% of AGI for various income ranges: 41.6% for AGIs below $25k, 42.9% for AGIs $25k-50k)
Percentage of individuals using paid preparers for their 2020 taxes: 93.6%
Here:
94%
State:
92%
(% for various income ranges: 89.9% for AGIs below $25k, 94.0% for AGIs $25k-50k, 95.7% for AGIs $50k-75k, 94.4% for AGIs $75k-100k, 94.7% for AGIs $100k-200k, 95.5% for AGIs over 200k)
Averages for the 2012 tax year for zip code 17007, filed in 2013:
Average Adjusted Gross Income (AGI) in 2012: $68,831 (Individual Income Tax Returns)
Here:
$68,831
State:
$61,346
Salary/wage: $58,564 (reported on 82.7% of returns)
Here:
$58,564
State:
$51,902
(% of AGI for various income ranges: 69.7% for AGIs below $25k, 73.5% for AGIs $25k-50k, 71.1% for AGIs $50k-75k, 70.0% for AGIs $75k-100k, 73.8% for AGIs $100k-200k, 61.7% for AGIs over 200k)
Taxable interest for individuals: $933 (reported on 51.9% of returns)
This zip code:
$933
Pennsylvania:
$1,588
(% of AGI for various income ranges: 1.8% for AGIs below $25k, 0.9% for AGIs $25k-50k, 0.9% for AGIs $50k-75k, 0.9% for AGIs $75k-100k, 0.5% for AGIs $100k-200k, 0.4% for AGIs over 200k)
Ordinary dividends: $3,145 (reported on 32.5% of returns)
Here:
$3,145
State:
$5,827
(% of AGI for various income ranges: 2.6% for AGIs below $25k, 1.3% for AGIs $25k-50k, 1.7% for AGIs $50k-75k, 1.3% for AGIs $75k-100k, 1.5% for AGIs $100k-200k, 1.3% for AGIs over 200k)
Net capital gain/loss in AGI: +$2,907 (reported on 23.5% of returns)
Here:
+$2,907
State:
+$14,495
(% of AGI for various income ranges: 0.2% for AGIs $25k-50k, 0.3% for AGIs $50k-75k, 0.5% for AGIs $75k-100k, 1.3% for AGIs $100k-200k, 1.9% for AGIs over 200k)
Profit/loss from business: +$13,153 (reported on 14.9% of returns)
Here:
+$13,153
State:
+$16,268
(% of AGI for various income ranges: 4.9% for AGIs below $25k, 3.3% for AGIs $25k-50k, 3.7% for AGIs $50k-75k, 2.4% for AGIs $75k-100k, 2.5% for AGIs $100k-200k, 2.7% for AGIs over 200k)
Taxable individual retirement arrangement distribution: $13,619 (reported on 14.9% of returns)
17007:
$13,619
Pennsylvania:
$14,550
(% of AGI for various income ranges: 6.4% for AGIs below $25k, 4.0% for AGIs $25k-50k, 3.3% for AGIs $50k-75k, 3.5% for AGIs $75k-100k, 2.4% for AGIs $100k-200k, 1.9% for AGIs over 200k)
Self-employment retirement plans: $25,600 (reported on 1.0% of returns)
17007:
$25,600
Pennsylvania:
$20,922
Total itemized deductions: $21,527 (18% of AGI, reported on 40.5% of returns)
Here:
$21,527
State:
$23,538
Here:
18.5% of AGI
State:
18.4% of AGI
(% of AGI for various income ranges: 7.6% for AGIs below $25k, 11.2% for AGIs $25k-50k, 11.3% for AGIs $50k-75k, 12.7% for AGIs $75k-100k, 13.5% for AGIs $100k-200k, 14.0% for AGIs over 200k)
Charity contributions: $3,524 (reported on 33.9% of returns)
Here:
$3,524
State:
$4,025
(% of AGI for various income ranges: 0.6% for AGIs below $25k, 1.3% for AGIs $25k-50k, 1.4% for AGIs $50k-75k, 1.9% for AGIs $75k-100k, 2.0% for AGIs $100k-200k, 1.8% for AGIs over 200k)
Taxes paid: $8,032 (reported on 40.5% of returns)
17007:
$8,032
State:
$9,982
(% of AGI for various income ranges: 1.4% for AGIs below $25k, 2.7% for AGIs $25k-50k, 3.8% for AGIs $50k-75k, 4.6% for AGIs $75k-100k, 5.7% for AGIs $100k-200k, 5.4% for AGIs over 200k)
Earned income credit: $1,800 (reported on 6.9% of returns)
Here:
$1,800
State:
$2,106
(% of AGI for various income ranges: 2.7% for AGIs below $25k, 0.6% for AGIs $25k-50k)
Percentage of individuals using paid preparers for their 2012 taxes: 50.9%
Here:
51%
State:
53%
(% for various income ranges: 46.2% for AGIs below $25k, 49.0% for AGIs $25k-50k, 52.3% for AGIs $50k-75k, 54.3% for AGIs $75k-100k, 53.6% for AGIs $100k-200k, 66.7% for AGIs over 200k)
Averages for the 2004 tax year for zip code 17007, filed in 2005:
Average Adjusted Gross Income (AGI) in 2004: $54,260 (Individual Income Tax Returns)
Here:
$54,260
State:
$48,049
Salary/wage: $48,742 (reported on 83.7% of returns)
Here:
$48,742
State:
$42,646
(% of AGI for various income ranges: 106.6% for AGIs below $10k, 68.7% for AGIs $10k-25k, 72.5% for AGIs $25k-50k, 75.2% for AGIs $50k-75k, 79.4% for AGIs $75k-100k, 73.7% for AGIs over 100k)
Taxable interest for individuals: $1,315 (reported on 64.0% of returns)
This zip code:
$1,315
Pennsylvania:
$1,657
(% of AGI for various income ranges: 3.6% for AGIs below $10k, 3.5% for AGIs $10k-25k, 2.2% for AGIs $25k-50k, 1.6% for AGIs $50k-75k, 1.1% for AGIs $75k-100k, 1.3% for AGIs over 100k)
Taxable dividends: $2,205 (reported on 37.7% of returns)
Here:
$2,205
State:
$3,566
(% of AGI for various income ranges: 5.8% for AGIs below $10k, 2.8% for AGIs $10k-25k, 1.7% for AGIs $25k-50k, 1.3% for AGIs $50k-75k, 1.5% for AGIs $75k-100k, 1.3% for AGIs over 100k)
Net capital gain/loss: +$5,616 (reported on 27.5% of returns)
Here:
+$5,616
State:
+$9,716
(% of AGI for various income ranges: -2.3% for AGIs below $10k, 1.2% for AGIs $10k-25k, 0.5% for AGIs $25k-50k, 1.6% for AGIs $50k-75k, 1.2% for AGIs $75k-100k, 5.5% for AGIs over 100k)
Profit/loss from business: +$10,366 (reported on 15.7% of returns)
Here:
+$10,366
State:
+$14,267
(% of AGI for various income ranges: 4.8% for AGIs below $10k, 5.9% for AGIs $10k-25k, 4.4% for AGIs $25k-50k, 2.8% for AGIs $50k-75k, 1.5% for AGIs $75k-100k, 3.0% for AGIs over 100k)
IRA payment deduction: $3,341 (reported on 3.3% of returns)
17007:
$3,341
Pennsylvania:
$2,903
(% of AGI for various income ranges: 0.4% for AGIs $25k-50k, 0.3% for AGIs $50k-75k, 0.2% for AGIs $75k-100k, 0.1% for AGIs over 100k)
Self-employed pension: $9,852 (reported on 1.0% of returns)
Here:
$9,852
Pennsylvania:
$14,674
Total itemized deductions: $17,503 (20% of AGI, reported on 42.5% of returns)
Here:
$17,503
State:
$18,804
Here:
19.8% of AGI
State:
19.5% of AGI
(% of AGI for various income ranges: 7.2% for AGIs below $10k, 9.8% for AGIs $10k-25k, 12.7% for AGIs $25k-50k, 13.8% for AGIs $50k-75k, 15.5% for AGIs $75k-100k, 13.8% for AGIs over 100k)
Charity contributions deductions: $2,762 (3% of AGI, reported on 38.6% of returns)
Here:
$2,762
State:
$3,337
Here:
3.0% of AGI
State:
3.3% of AGI
(% of AGI for various income ranges: 1.5% for AGIs $10k-25k, 1.4% for AGIs $25k-50k, 1.8% for AGIs $50k-75k, 2.2% for AGIs $75k-100k, 2.2% for AGIs over 100k)
Total tax: $7,855 (reported on 80.1% of returns)
17007:
$7,855
State:
$8,008
(% of AGI for various income ranges: 2.2% for AGIs below $10k, 5.0% for AGIs $10k-25k, 7.5% for AGIs $25k-50k, 8.3% for AGIs $50k-75k, 10.3% for AGIs $75k-100k, 16.4% for AGIs over 100k)
Earned income credit: $1,402 (reported on 6.2% of returns)
Here:
$1,402
State:
$1,643
Percentage of individuals using paid preparers for their 2004 taxes: 50.1%
Here:
50%
State:
56%
(% for various income ranges: 39.0% for AGIs below $10k, 52.0% for AGIs $10k-25k, 53.0% for AGIs $25k-50k, 53.1% for AGIs $50k-75k, 50.0% for AGIs $75k-100k, 56.3% for AGIs over 100k)
Likely homosexual households (counted as self-reported same-sex unmarried-partner households)
Lesbian couples: 0.9% of all households
Gay men: 0.0% of all households
Household received Food Stamps/SNAP in the past 12 months: 149 Household did not receive Food Stamps/SNAP in the past 12 months: 2,063
Women who had a birth in the past 12 months: 86 (73 now married, 15 unmarried) Women who did not have a birth in the past 12 months: 1,266 (520 now married, 745 unmarried)
Housing units in zip code 17007 with a mortgage: 1,039 (149 second mortgage, 144 both second mortgage and home equity loan) Houses without a mortgage: 172
Median monthly owner costs for units with a mortgage: $1,765 Median monthly owner costs for units without a mortgage: $635
Residents with income below the poverty level in 2022:
This zip code:
2.1%
Whole state:
11.8%
Residents with income below 50% of the poverty level in 2022:
This zip code:
1.8%
Whole state:
6.1%
Median number of rooms in houses and condos:
Here:
7.6
State:
6.8
Median number of rooms in apartments:
Here:
4.3
State:
4.3
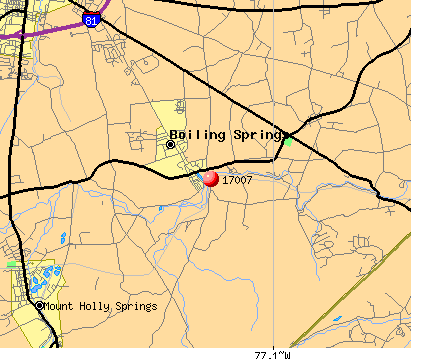
Notable locations in this zip code not listed on our city pages
Notable locations in zip code 17007: Red Tank (A), Allenberry Playhouse (B), South Middleton Township Fire Company Station 35 (C), Whisky Spring Lean-to (D). Display/hide their locations on the map
In group quarters: 6 (-1 institutionalized population)
Size of family households: 655 2-persons, 337 3-persons, 339 4-persons, 207 5-persons, 83 6-persons, 8 7-or-more-persons
Size of nonfamily households: 482 1-person, 94 2-persons
954 married couples with children.
413 single-parent households (413 women).
96.5% of residents of 17007 zip code speak English at home.
1.6% of residents speak Spanish at home (48% very well, 52% well).
0.1% of residents speak other Indo-European language at home (100% very well).
1.4% of residents speak Asian or Pacific Island language at home (65% very well, 35% well).
Foreign born population: 216 (3.5%) (60.6% of them are naturalized citizens)
This zip code:
3.5%
Whole state:
7.5%
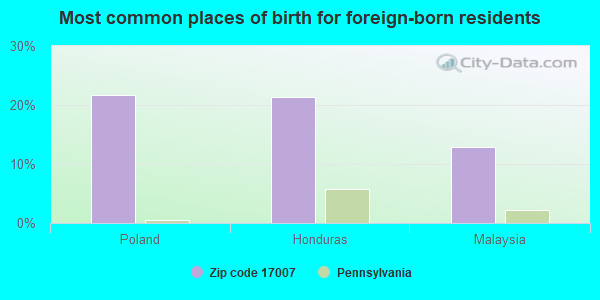
22%Poland
21%Honduras
13%Malaysia
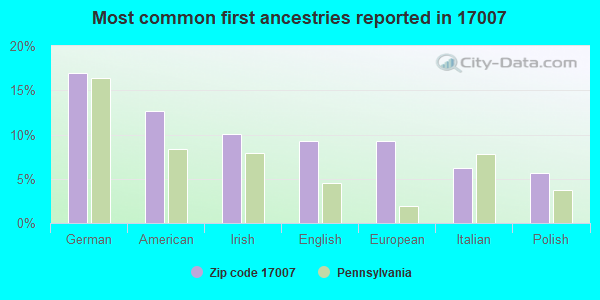
17%German
13%American
10%Irish
9%English
9%European
6%Italian
6%Polish
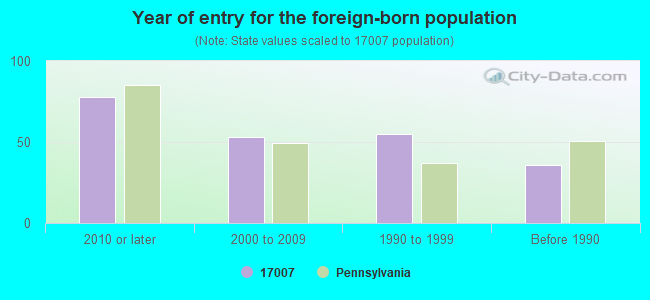
Year of entry for the foreign-born population
782010 or later
532000 to 2009
551990 to 1999
36Before 1990
Facilities with environmental interests located in this zip code:
ALLSAFE ENVIRONMENTAL (375 CRISWELL AVENUE in BOILING SPRINGS, PA)
COMPLIANCE ACTIVITY (Tracking inspections of insecticide, fungicide, and rodenticide, and toxic substances)
Housing units lacking complete plumbing facilities: 0.7% Housing units lacking complete kitchen facilities: 0.7%
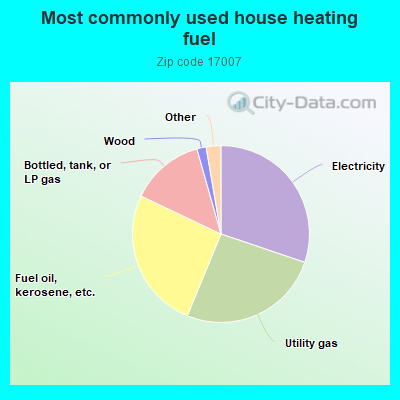
30.3%Electricity
26.1%Utility gas
25.9%Fuel oil, kerosene, etc.
13.6%Bottled, tank, or LP gas
1.7%Wood
0.9%Other fuel
0.8%Coal or coke
0.5%Solar energy
Population in 1990: 4,331. Population change in the 1990s: +891 (+20.6%).
Place of birth for U.S.-born residents:
This state: 4,272
Northeast: 461
Midwest: 437
South: 594
West: 273
66% of the 17007 zip code residents lived in the same house 5 years ago. Out of people who lived in different houses, 68% lived in this county. Out of people who lived in different counties, 50% lived in Pennsylvania.
94% of the 17007 zip code residents lived in the same house 1 year ago. Out of people who lived in different houses, 68% moved from this county. Out of people who lived in different houses, 24% moved from different county within same state. Out of people who lived in different houses, 10% moved from different state.
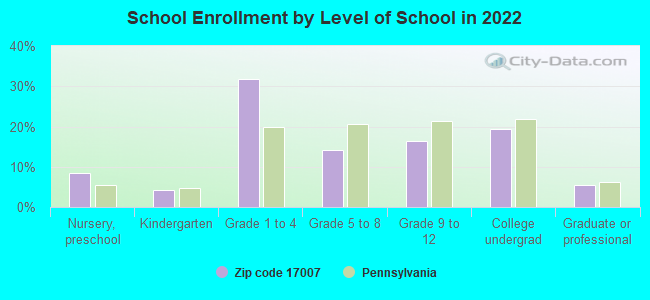
Private vs. public school enrollment:
Students in private schools in grades 1 to 8 (elementary and middle school): 20
Here:
2.5%
Pennsylvania:
15.7%
Students in private schools in grades 9 to 12 (high school): 17
Here:
6.3%
Pennsylvania:
13.4%
Students in private undergraduate colleges: 140
Here:
41.9%
Pennsylvania:
39.8%
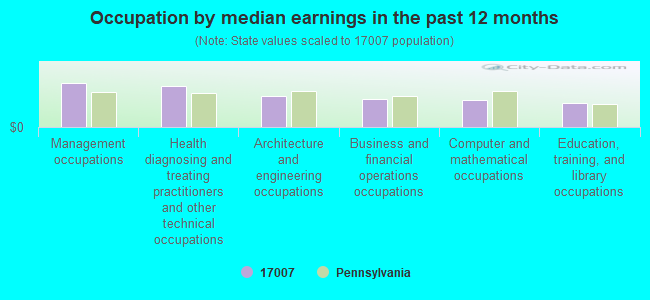
Occupation by median earnings in the past 12 months ($)
124,999Management occupations
116,101Health diagnosing and treating practitioners and other technical occupations
87,215Architecture and engineering occupations
79,887Business and financial operations occupations
76,293Computer and mathematical occupations
68,599Education, training, and library occupations
Companies with federal contracts located in this zip code (BOILING SPRING, PA):
JOSEPH O YORK (23 N PIN OAK DR; small business) : $367,665 in 16 contractsfrom 2001 to 2006
Contracts for Lectures For Training, Educational Services, Education Services by Army Signed by year:2000: $0; 2001: $54,695; 2002: $47,910; 2003: $103,540; 2004: $77,180; 2005: $81,840; 2006: $2,500.
Biggest contracts:
$77,180 with Army for Lectures For Training. Signed on 2004-10-14. Completion date: 2003-09-30.
$72,750, same as above.Signed on 2003-10-09. Completion date: 2003-09-30.
$67,340, same as above.Signed on 2005-12-27. Completion date: 2003-09-30.
$54,695 with Army for Educational Services. Signed on 2001-10-23. Completion date: 2002-09-30.
BARRIE ZAIS (6 LAUREL OAK DRIVE; small business) : $100,556 in 5 contractsfrom 2001 to 2004
Contracts for Education Services, Educational Services by Army Signed by year:2000: $0; 2001: $31,012; 2002: $32,994; 2003: $32,535; 2004: $4,015; 2005: $0; 2006: $0.
Biggest contracts:
$32,994 with Army for Education Services. Signed on 2002-07-10. Completion date: 2003-07-30.
$32,535, same as above.Signed on 2003-07-25. Completion date: 2004-07-30.
$31,012 with Army for Educational Services. Signed on 2001-06-27. Completion date: 2002-06-07.
$3,950 with Army for Education Services. Signed on 2004-04-13. Completion date: 2004-07-30.
CRONIN CONSULTING INC (72 SOUTH PIN OAK DRIVE; small business) : $84,510 in 3 contractsfrom 2002 to 2003
$41,736 with Army for Educational Services. Signed on 2002-09-11. Completion date: 2003-09-08.
$37,774, same as above.Signed on 2003-09-26. Completion date: 2004-09-08.
$5,000, same as above.Signed on 2003-09-09. Completion date: 2004-09-08.
LEE, ROBERT (25 N PIN OAK; small business)
$68,640 with Army for Optometry Services. Signed on 2005-10-01. Completion date: 2006-09-30.
FRANCIS J CUMMINGS (1309 KUHN ROAD; small business)
$10,722 with Navy for Miscellaneous Items. Taking place in RI. Signed on 2005-08-01. Completion date: 2006-05-26.
RAY E PORTER III (32 N PIN OAK DR; small business)
$1,200 with Army for Other Social Services. Signed on 2005-01-11. Completion date: 2005-01-26.
Top industries in this zip code by the number of employees in 2005:
Accommodation and Food Services: Hotels (except Casino Hotels) and Motels (50-99 employees: 1 establishment)
Health Care and Social Assistance: Other Residential Care Facilities (50-99: 1)
Health Care and Social Assistance: Home Health Care Services (50-99: 1)
2004 - 2017 National Fire Incident Reporting System (NFIRS) incidents
According to the data from the years 2004 - 2017 the average number of fires per year is 16. The highest number of reported fire incidents - 38 took place in 2016, and the least - 0 in 2005. The data has a growing trend.
When looking into fire subcategories, the most incidents belonged to: Structure Fires (65.9%), and Outside Fires (26.1%).
Fire incident types reported to NFIRS in Zip Code 17007
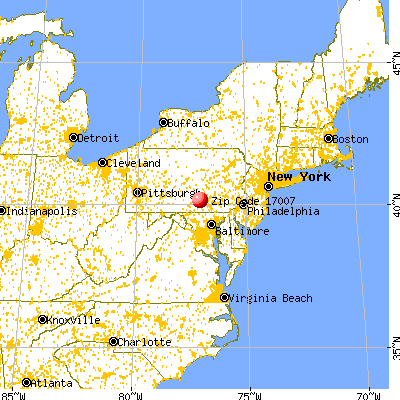


 Nearest zip codes: 17065, 17019, 17072, 17015, 17372, 17027.


 According to the data from the years 2004 - 2017 the average number of fires per year is 16. The highest number of reported fire incidents - 38 took place in 2016, and the least - 0 in 2005. The data has a growing trend.
 When looking into fire subcategories, the most incidents belonged to: Structure Fires (65.9%), and Outside Fires (26.1%).