Estimated zip code population in 2022: 2,462 Zip code population in 2010: 2,787 Zip code population in 2000: 2,300
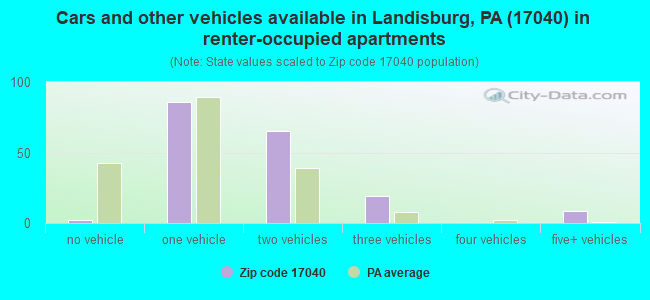
Houses and condos: 1,042 Renter-occupied apartments: 178
% of renters here:
19%
State:
31%
March 2022 cost of living index in zip code 17040: 92.2 (less than average, U.S. average is 100)
Land area: 50.0 sq. mi. Water area: 0.3 sq. mi.
Population density: 49 people per square mile
(very low).
OSM Map
General Map
Google Map
MSN Map
OSM Map
General Map
Google Map
MSN Map
OSM Map
General Map
Google Map
MSN Map
OSM Map
General Map
Google Map
MSN Map
Please wait while loading the map...
Real estate property taxes paid for housing units in 2022:
This zip code:
0.9% ($2,344)
Pennsylvania:
1.3% ($3,094)
Median real estate property taxes paid for housing units with mortgages in 2022: $2,541 (1.0%) Median real estate property taxes paid for housing units with no mortgage in 2022: $2,201 (0.9%)
Business Search- 14 Million verified businesses
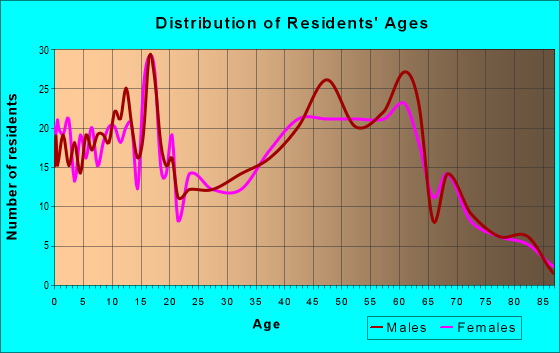
Males: 1,287
(52.3%)
Females: 1,174
(47.7%)
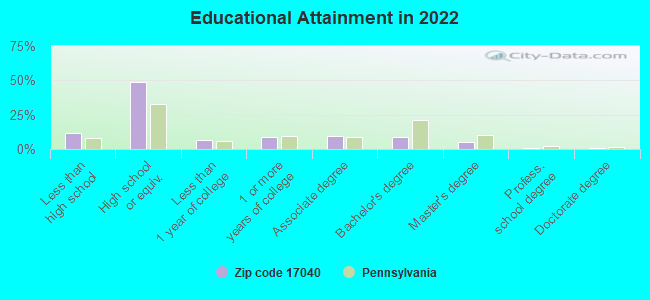
For population 25 years and over in 17040:
High school or higher: 86.7%
Bachelor's degree or higher: 15.0%
Graduate or professional degree: 6.5%
Unemployed: 3.2%
Mean travel time to work (commute): 32.6 minutes
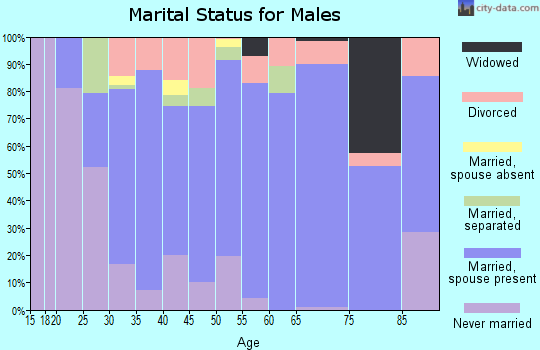
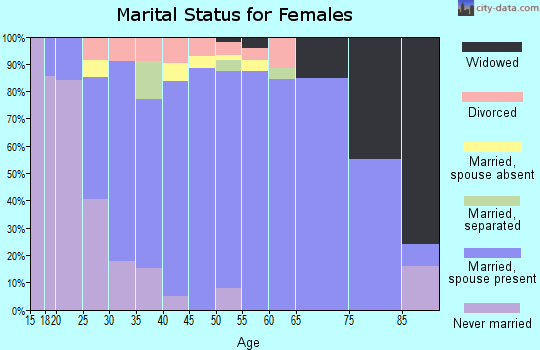
For population 15 years and over in 17040:
Never married: 21.9%
Now married: 58.8%
Separated: 2.5%
Widowed: 4.9%
Divorced: 11.9%
Zip code 17040 compared to state average:
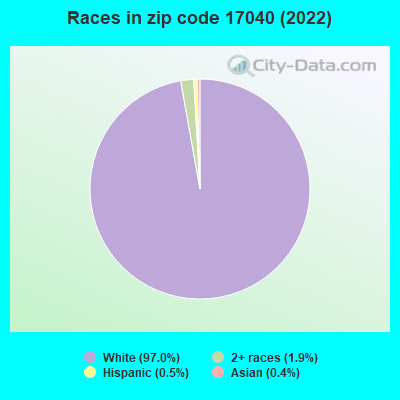
Black race population percentage significantly below state average.
Hispanic race population percentage significantly below state average.
Foreign-born population percentage significantly below state average.
Renting percentage below state average.
Length of stay since moving in significantly above state average.
Number of college students significantly below state average.
Percentage of population with a bachelor's degree or higher significantly below state average.
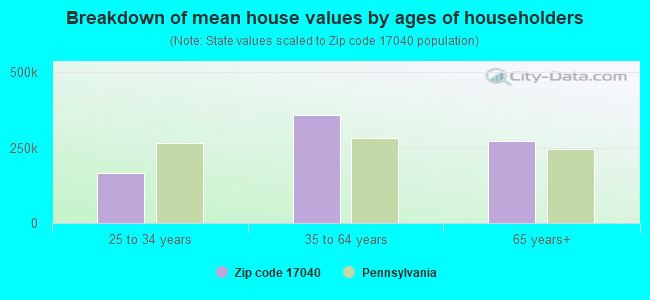
Estimated median house/condo value in 2022: $249,299
17040:
$249,299
Pennsylvania:
$245,500
According to our research of Pennsylvania and other state lists, there were 4 registered sex offenders living in 17040 zip code as of April 19, 2024. The ratio of all residents to sex offenders in zip code 17040 is 574 to 1. The ratio of registered sex offenders to all residents in this zip code is near the state average.
Median resident age:
This zip code:
39.3 years
Pennsylvania median age:
40.9 years
Average household size:
This zip code:
2.7 people
Pennsylvania:
2.4 people
Averages for the 2020 tax year for zip code 17040, filed in 2021:
Average Adjusted Gross Income (AGI) in 2020: $59,076 (Individual Income Tax Returns)
Here:
$59,076
State:
$75,707
Salary/wage: $52,123 (reported on 76.9% of returns)
Here:
$52,123
State:
$62,806
(% of AGI for various income ranges: 1198.0% for AGIs below $25k, 3618.2% for AGIs $25k-50k, 6454.1% for AGIs $50k-75k, 9462.5% for AGIs $75k-100k, 14281.7% for AGIs $100k-200k)
Taxable interest for individuals: $1,028 (reported on 36.2% of returns)
This zip code:
$1,028
Pennsylvania:
$1,633
(% of AGI for various income ranges: 41.2% for AGIs below $25k, 41.4% for AGIs $25k-50k, 44.7% for AGIs $50k-75k, 68.8% for AGIs $75k-100k, 105.8% for AGIs $100k-200k)
Ordinary dividends: $5,221 (reported on 18.5% of returns)
Here:
$5,221
State:
$7,382
(% of AGI for various income ranges: 48.0% for AGIs below $25k, 30.9% for AGIs $25k-50k, 38.2% for AGIs $50k-75k, 27.5% for AGIs $75k-100k, 815.0% for AGIs $100k-200k)
Net capital gain/loss in AGI: +$8,215 (reported on 15.4% of returns)
Here:
+$8,215
State:
+$23,522
(% of AGI for various income ranges: 28.4% for AGIs below $25k, 89.5% for AGIs $25k-50k, 146.5% for AGIs $50k-75k, 938.3% for AGIs $100k-200k)
Profit/loss from business: +$12,810 (reported on 15.4% of returns)
Here:
+$12,810
State:
+$16,274
(% of AGI for various income ranges: 221.2% for AGIs below $25k, 145.5% for AGIs $25k-50k, 57.1% for AGIs $50k-75k, 662.5% for AGIs $75k-100k, 885.0% for AGIs $100k-200k)
Taxable individual retirement arrangement distribution: $14,423 (reported on 10.0% of returns)
17040:
$14,423
Pennsylvania:
$18,583
(% of AGI for various income ranges: 91.2% for AGIs below $25k, 168.2% for AGIs $25k-50k, 298.8% for AGIs $50k-75k, 640.8% for AGIs $100k-200k)
Total itemized deductions: $29,100 (reported on 3.8% of returns)
Here:
$29,100
State:
$34,850
(% of AGI for various income ranges: 308.6% for AGIs $25k-50k, 646.7% for AGIs $100k-200k)
Charity contributions: $10,767 (reported on 2.3% of returns)
Here:
$10,767
State:
$12,392
(% of AGI for various income ranges: 403.7% for AGIs $75k-100k)
Taxes paid: $5,900 (reported on 3.8% of returns)
17040:
$5,900
State:
$8,200
(% of AGI for various income ranges: 52.7% for AGIs $25k-50k, 149.2% for AGIs $100k-200k)
Earned income credit: $2,243 (reported on 10.8% of returns)
Here:
$2,243
State:
$2,100
(% of AGI for various income ranges: 73.6% for AGIs below $25k, 59.1% for AGIs $25k-50k)
Percentage of individuals using paid preparers for their 2020 taxes: 94.6%
Here:
95%
State:
92%
(% for various income ranges: 95.2% for AGIs below $25k, 90.3% for AGIs $25k-50k, 95.7% for AGIs $50k-75k, 100.0% for AGIs $75k-100k, 94.7% for AGIs $100k-200k, 100.0% for AGIs over 200k)
Averages for the 2012 tax year for zip code 17040, filed in 2013:
Average Adjusted Gross Income (AGI) in 2012: $47,316 (Individual Income Tax Returns)
Here:
$47,316
State:
$61,346
Salary/wage: $41,454 (reported on 79.3% of returns)
Here:
$41,454
State:
$51,902
(% of AGI for various income ranges: 65.8% for AGIs below $25k, 73.7% for AGIs $25k-50k, 76.3% for AGIs $50k-75k, 79.2% for AGIs $75k-100k, 56.0% for AGIs $100k-200k)
Taxable interest for individuals: $1,052 (reported on 44.6% of returns)
This zip code:
$1,052
Pennsylvania:
$1,588
(% of AGI for various income ranges: 2.9% for AGIs below $25k, 1.2% for AGIs $25k-50k, 0.5% for AGIs $50k-75k, 0.4% for AGIs $75k-100k, 1.1% for AGIs $100k-200k)
Ordinary dividends: $3,176 (reported on 17.4% of returns)
Here:
$3,176
State:
$5,827
(% of AGI for various income ranges: 2.7% for AGIs below $25k, 0.4% for AGIs $25k-50k, 1.4% for AGIs $50k-75k, 0.2% for AGIs $75k-100k, 1.7% for AGIs $100k-200k)
Net capital gain/loss in AGI: +$5,364 (reported on 11.6% of returns)
Here:
+$5,364
State:
+$14,495
(% of AGI for various income ranges: 0.2% for AGIs below $25k, 0.6% for AGIs $25k-50k, 0.3% for AGIs $50k-75k, 3.8% for AGIs $100k-200k)
Profit/loss from business: +$10,722 (reported on 14.9% of returns)
Here:
+$10,722
State:
+$16,268
(% of AGI for various income ranges: 7.0% for AGIs below $25k, 3.1% for AGIs $25k-50k, 2.9% for AGIs $50k-75k, 7.8% for AGIs $75k-100k)
Taxable individual retirement arrangement distribution: $13,086 (reported on 11.6% of returns)
17040:
$13,086
Pennsylvania:
$14,550
(% of AGI for various income ranges: 4.1% for AGIs below $25k, 4.1% for AGIs $25k-50k, 5.3% for AGIs $50k-75k, 2.6% for AGIs $100k-200k)
Total itemized deductions: $17,763 (21% of AGI, reported on 24.8% of returns)
Here:
$17,763
State:
$23,538
Here:
21.2% of AGI
State:
18.4% of AGI
(% of AGI for various income ranges: 8.6% for AGIs $25k-50k, 11.5% for AGIs $50k-75k, 10.2% for AGIs $75k-100k, 10.3% for AGIs $100k-200k)
Charity contributions: $3,110 (reported on 17.4% of returns)
Here:
$3,110
State:
$4,025
(% of AGI for various income ranges: 1.2% for AGIs $25k-50k, 1.0% for AGIs $50k-75k, 1.0% for AGIs $75k-100k, 1.6% for AGIs $100k-200k)
Taxes paid: $6,007 (reported on 24.8% of returns)
17040:
$6,007
State:
$9,982
(% of AGI for various income ranges: 2.4% for AGIs $25k-50k, 3.3% for AGIs $50k-75k, 3.8% for AGIs $75k-100k, 4.1% for AGIs $100k-200k)
Earned income credit: $1,741 (reported on 14.0% of returns)
Here:
$1,741
State:
$2,106
(% of AGI for various income ranges: 3.7% for AGIs below $25k, 0.9% for AGIs $25k-50k)
Percentage of individuals using paid preparers for their 2012 taxes: 54.5%
Here:
55%
State:
53%
(% for various income ranges: 51.1% for AGIs below $25k, 54.8% for AGIs $25k-50k, 59.1% for AGIs $50k-75k, 50.0% for AGIs $75k-100k, 63.6% for AGIs $100k-200k)
Averages for the 2004 tax year for zip code 17040, filed in 2005:
Average Adjusted Gross Income (AGI) in 2004: $40,871 (Individual Income Tax Returns)
Here:
$40,871
State:
$48,049
Salary/wage: $37,977 (reported on 84.4% of returns)
Here:
$37,977
State:
$42,646
(% of AGI for various income ranges: 116.8% for AGIs below $10k, 72.0% for AGIs $10k-25k, 79.4% for AGIs $25k-50k, 87.1% for AGIs $50k-75k, 80.4% for AGIs $75k-100k, 62.5% for AGIs over 100k)
Taxable interest for individuals: $1,516 (reported on 53.9% of returns)
This zip code:
$1,516
Pennsylvania:
$1,657
(% of AGI for various income ranges: 8.2% for AGIs below $10k, 3.7% for AGIs $10k-25k, 3.1% for AGIs $25k-50k, 1.3% for AGIs $50k-75k, 0.6% for AGIs $75k-100k, 1.6% for AGIs over 100k)
Taxable dividends: $2,876 (reported on 23.7% of returns)
Here:
$2,876
State:
$3,566
(% of AGI for various income ranges: 3.6% for AGIs below $10k, 1.2% for AGIs $10k-25k, 0.7% for AGIs $25k-50k, 0.5% for AGIs $50k-75k, 0.8% for AGIs $75k-100k, 5.7% for AGIs over 100k)
Net capital gain/loss: +$3,139 (reported on 16.7% of returns)
Here:
+$3,139
State:
+$9,716
(% of AGI for various income ranges: -1.6% for AGIs below $10k, 0.1% for AGIs $10k-25k, 1.0% for AGIs $25k-50k, 0.1% for AGIs $50k-75k, 1.7% for AGIs $75k-100k, 3.6% for AGIs over 100k)
Profit/loss from business: +$7,994 (reported on 15.1% of returns)
Here:
+$7,994
State:
+$14,267
(% of AGI for various income ranges: -1.6% for AGIs below $10k, 9.3% for AGIs $10k-25k, 3.5% for AGIs $25k-50k, 1.8% for AGIs $50k-75k, 3.3% for AGIs $75k-100k, 0.6% for AGIs over 100k)
IRA payment deduction: $2,364 (reported on 2.8% of returns)
17040:
$2,364
Pennsylvania:
$2,903
Total itemized deductions: $14,960 (21% of AGI, reported on 27.7% of returns)
Here:
$14,960
State:
$18,804
Here:
21.0% of AGI
State:
19.5% of AGI
(% of AGI for various income ranges: 9.9% for AGIs $10k-25k, 8.4% for AGIs $25k-50k, 9.9% for AGIs $50k-75k, 12.5% for AGIs $75k-100k, 11.2% for AGIs over 100k)
Charity contributions deductions: $2,200 (3% of AGI, reported on 22.4% of returns)
Here:
$2,200
State:
$3,337
Here:
2.9% of AGI
State:
3.3% of AGI
(% of AGI for various income ranges: 0.9% for AGIs $10k-25k, 0.8% for AGIs $25k-50k, 1.0% for AGIs $50k-75k, 1.6% for AGIs $75k-100k, 1.8% for AGIs over 100k)
Total tax: $4,865 (reported on 78.1% of returns)
17040:
$4,865
State:
$8,008
(% of AGI for various income ranges: 3.0% for AGIs below $10k, 5.1% for AGIs $10k-25k, 6.7% for AGIs $25k-50k, 8.2% for AGIs $50k-75k, 10.4% for AGIs $75k-100k, 15.7% for AGIs over 100k)
Earned income credit: $1,311 (reported on 10.5% of returns)
Here:
$1,311
State:
$1,643
Percentage of individuals using paid preparers for their 2004 taxes: 61.6%
Here:
62%
State:
56%
(% for various income ranges: 52.0% for AGIs below $10k, 63.4% for AGIs $10k-25k, 65.2% for AGIs $25k-50k, 63.1% for AGIs $50k-75k, 62.4% for AGIs $75k-100k, 63.8% for AGIs over 100k)
Likely homosexual households (counted as self-reported same-sex unmarried-partner households)
Lesbian couples: 0.4% of all households
Gay men: 0.0% of all households
Household received Food Stamps/SNAP in the past 12 months: 76 Household did not receive Food Stamps/SNAP in the past 12 months: 848
Women who had a birth in the past 12 months: 61 (38 now married, 21 unmarried) Women who did not have a birth in the past 12 months: 447 (223 now married, 222 unmarried)
Housing units in zip code 17040 with a mortgage: 325 (37 second mortgage, 37 both second mortgage and home equity loan) Houses without a mortgage: 55
Median monthly owner costs for units with a mortgage: $1,435 Median monthly owner costs for units without a mortgage: $534
Residents with income below the poverty level in 2022:
This zip code:
7.9%
Whole state:
11.8%
Residents with income below 50% of the poverty level in 2022:
This zip code:
3.4%
Whole state:
6.1%
Median number of rooms in houses and condos:
Here:
6.4
State:
6.8
Median number of rooms in apartments:
Here:
5.5
State:
4.3
Notable locations in this zip code not listed on our city pages
Churches in zip code 17040 include: Laurel Run Church (A), Mount Zion Church (B), Kennedy Valley Church (C), Oak Grove Church (D). Display/hide their locations on the map
Streams, rivers, and creeks: Baken Creek (A), Trout Run (B), Muddy Run (C), Montour Creek (D), Green Valley Run (E), McCabe Run (F), Laurel Run (G). Display/hide their locations on the map
450 married couples with children.
132 single-parent households (72 men, 60 women).
94.3% of residents of 17040 zip code speak English at home.
0.1% of residents speak Spanish at home (100% very well).
5.0% of residents speak other Indo-European language at home (83% very well, 17% well).
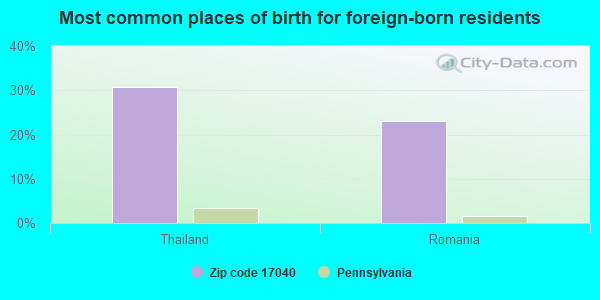
Foreign born population: 13 (0.6%) (100.0% of them are naturalized citizens)
This zip code:
0.6%
Whole state:
7.5%
31%Thailand
23%Romania
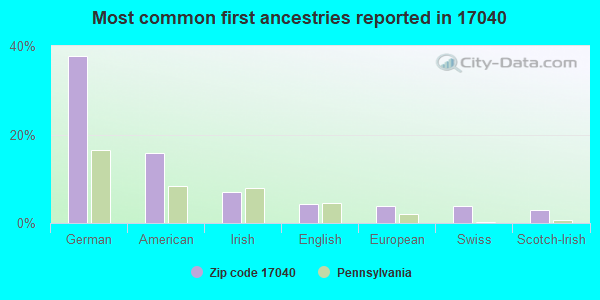
38%German
16%American
7%Irish
4%English
4%European
4%Swiss
3%Scotch-Irish
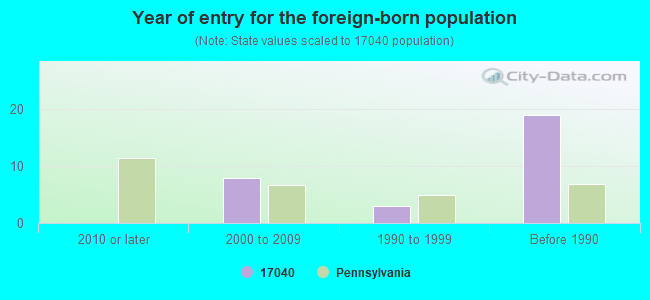
Year of entry for the foreign-born population
02010 or later
82000 to 2009
31990 to 1999
19Before 1990
Housing units lacking complete plumbing facilities: 0.6% Housing units lacking complete kitchen facilities: 1.8%
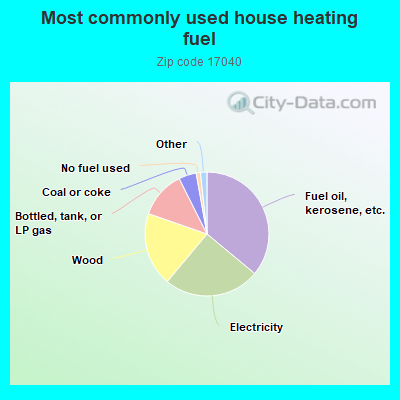
36.1%Fuel oil, kerosene, etc.
25.1%Electricity
19.3%Wood
12.3%Bottled, tank, or LP gas
4.6%Coal or coke
1.1%No fuel used
0.9%Utility gas
0.7%Other fuel
Population in 1990: 1,140. Population change in the 1990s: +1,160 (+101.8%).
Place of birth for U.S.-born residents:
This state: 2,212
Northeast: 39
Midwest: 39
South: 100
West: 16
72% of the 17040 zip code residents lived in the same house 5 years ago. Out of people who lived in different houses, 54% lived in this county. Out of people who lived in different counties, 50% lived in Pennsylvania.
96% of the 17040 zip code residents lived in the same house 1 year ago. Out of people who lived in different houses, 46% moved from this county. Out of people who lived in different houses, 49% moved from different county within same state. Out of people who lived in different houses, 3% moved from different state. Out of people who lived in different houses, 7% moved from abroad.
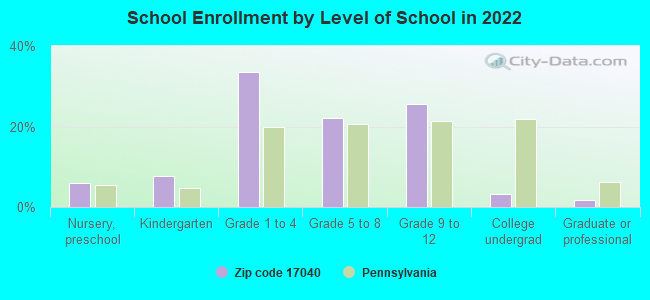
Private vs. public school enrollment:
Students in private schools in grades 1 to 8 (elementary and middle school): 84
Here:
32.5%
Pennsylvania:
15.7%
Students in private schools in grades 9 to 12 (high school): 17
Here:
14.7%
Pennsylvania:
13.4%
Students in private undergraduate colleges:
Here:
0.0%
Pennsylvania:
39.8%
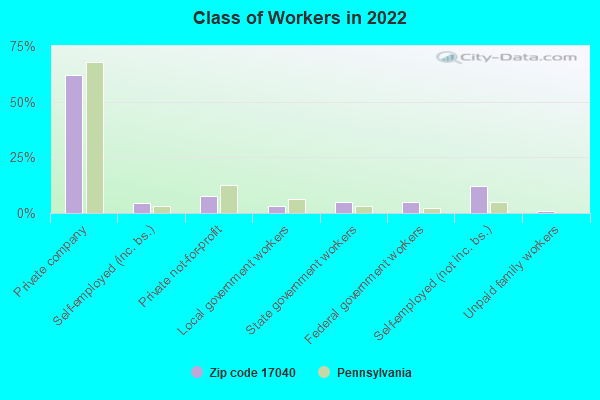
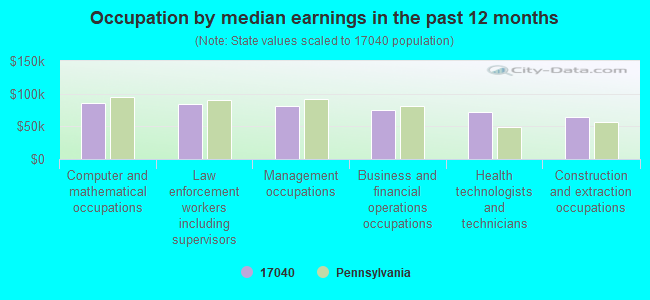
Occupation by median earnings in the past 12 months ($)
85,652Computer and mathematical occupations
84,703Law enforcement workers including supervisors
80,451Management occupations
75,458Business and financial operations occupations
72,446Health technologists and technicians
64,963Construction and extraction occupations
Top industries in this zip code by the number of employees in 2005:
Construction: Other Building Equipment Contractors (20-49 employees: 1 establishment)
Finance and Insurance: Commercial Banking (20-49: 1)
Construction: New Single-Family Housing Construction (except Operative Builders) (10-19: 1, 1-4: 1)
Health Care and Social Assistance: Ambulance Services (5-9: 1)
Educational Services: Professional and Management Development Training (5-9: 1)
Other Services (except Public Administration): General Automotive Repair (1-4: 3)
Other Services (except Public Administration): Religious Organizations (1-4: 2)
Fatal accident statistics in 2013:
Fatal accident count: 1
Vehicles involved in fatal accidents: 2
Fatal accidents caused by drunken drivers: 1
Fatalities: 1
Persons involved in fatal accidents: 2
Pedestrians involved in fatal accidents: 0
Fatal accident statistics in 2012:
Fatal accident count: 1
Vehicles involved in fatal accidents: 2
Fatal accidents caused by drunken drivers: 0
Fatalities: 1
Persons involved in fatal accidents: 2
Pedestrians involved in fatal accidents: 0
Home Mortgage Disclosure Act Aggregated Statistics For Year 2009 (Based on 4 partial tracts)
A) FHA, FSA/RHS & VA Home Purchase Loans
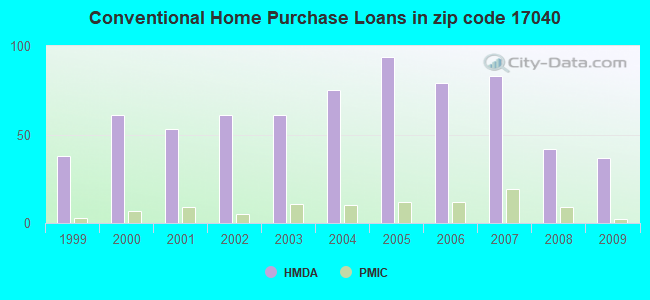
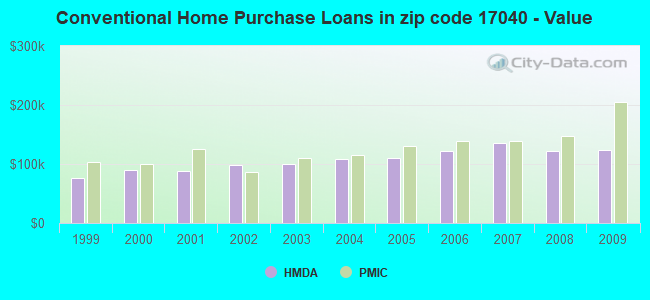
B) Conventional Home Purchase Loans
C) Refinancings
D) Home Improvement Loans
F) Non-occupant Loans on < 5 Family Dwellings (A B C & D)
G) Loans On Manufactured Home Dwelling (A B C & D)
Number
Average Value
Number
Average Value
Number
Average Value
Number
Average Value
Number
Average Value
Number
Average Value
LOANS ORIGINATED
15
$154,653
37
$124,342
176
$119,410
45
$57,266
12
$96,522
17
$60,129
APPLICATIONS APPROVED, NOT ACCEPTED
1
$85,790
2
$48,770
12
$133,710
2
$34,005
0
$0
1
$21,000
APPLICATIONS DENIED
1
$162,900
10
$76,734
47
$149,844
9
$38,994
3
$54,557
8
$57,621
APPLICATIONS WITHDRAWN
3
$131,147
8
$115,889
23
$155,475
1
$223,400
2
$87,240
2
$39,450
FILES CLOSED FOR INCOMPLETENESS
1
$102,320
0
$0
5
$193,498
1
$119,740
0
$0
1
$57,640
Aggregated Statistics For Year 2008 (Based on 4 partial tracts)
A) FHA, FSA/RHS & VA Home Purchase Loans
B) Conventional Home Purchase Loans
C) Refinancings
D) Home Improvement Loans
F) Non-occupant Loans on < 5 Family Dwellings (A B C & D)
G) Loans On Manufactured Home Dwelling (A B C & D)
Number
Average Value
Number
Average Value
Number
Average Value
Number
Average Value
Number
Average Value
Number
Average Value
LOANS ORIGINATED
18
$145,813
42
$121,725
138
$101,506
50
$46,257
20
$109,562
16
$65,016
APPLICATIONS APPROVED, NOT ACCEPTED
0
$0
2
$51,770
12
$130,314
1
$45,600
1
$92,810
1
$63,000
APPLICATIONS DENIED
3
$149,170
17
$91,748
76
$144,251
22
$60,827
2
$137,565
7
$63,070
APPLICATIONS WITHDRAWN
1
$103,440
7
$116,809
24
$151,279
3
$43,730
2
$124,145
2
$45,125
FILES CLOSED FOR INCOMPLETENESS
0
$0
2
$164,275
5
$145,052
1
$13,290
1
$51,170
0
$0
Aggregated Statistics For Year 2007 (Based on 4 partial tracts)
A) FHA, FSA/RHS & VA Home Purchase Loans
B) Conventional Home Purchase Loans
C) Refinancings
D) Home Improvement Loans
F) Non-occupant Loans on < 5 Family Dwellings (A B C & D)
G) Loans On Manufactured Home Dwelling (A B C & D)
Number
Average Value
Number
Average Value
Number
Average Value
Number
Average Value
Number
Average Value
Number
Average Value
LOANS ORIGINATED
7
$132,690
83
$135,019
138
$98,616
51
$41,985
23
$134,039
16
$63,151
APPLICATIONS APPROVED, NOT ACCEPTED
0
$0
6
$151,540
15
$101,077
5
$34,928
2
$101,590
3
$104,263
APPLICATIONS DENIED
2
$136,575
22
$127,781
86
$121,038
26
$50,832
3
$61,333
11
$59,048
APPLICATIONS WITHDRAWN
1
$151,160
8
$115,158
40
$135,992
3
$38,283
1
$106,340
2
$91,065
FILES CLOSED FOR INCOMPLETENESS
0
$0
2
$83,415
8
$169,271
1
$18,650
0
$0
0
$0
Aggregated Statistics For Year 2006 (Based on 4 partial tracts)
A) FHA, FSA/RHS & VA Home Purchase Loans
B) Conventional Home Purchase Loans
C) Refinancings
D) Home Improvement Loans
F) Non-occupant Loans on < 5 Family Dwellings (A B C & D)
G) Loans On Manufactured Home Dwelling (A B C & D)
Number
Average Value
Number
Average Value
Number
Average Value
Number
Average Value
Number
Average Value
Number
Average Value
LOANS ORIGINATED
3
$137,863
79
$121,917
148
$87,897
58
$44,797
14
$83,755
18
$55,128
APPLICATIONS APPROVED, NOT ACCEPTED
1
$142,450
9
$147,977
19
$103,408
5
$24,026
0
$0
1
$52,280
APPLICATIONS DENIED
0
$0
14
$80,100
105
$103,491
23
$59,798
2
$114,165
7
$54,529
APPLICATIONS WITHDRAWN
1
$144,500
8
$96,120
51
$117,985
8
$60,652
1
$47,190
3
$101,240
FILES CLOSED FOR INCOMPLETENESS
0
$0
1
$121,530
13
$154,166
2
$74,435
0
$0
1
$76,430
Aggregated Statistics For Year 2005 (Based on 4 partial tracts)
A) FHA, FSA/RHS & VA Home Purchase Loans
B) Conventional Home Purchase Loans
C) Refinancings
D) Home Improvement Loans
F) Non-occupant Loans on < 5 Family Dwellings (A B C & D)
G) Loans On Manufactured Home Dwelling (A B C & D)
Number
Average Value
Number
Average Value
Number
Average Value
Number
Average Value
Number
Average Value
Number
Average Value
LOANS ORIGINATED
4
$117,432
94
$110,381
153
$90,932
64
$45,205
12
$68,812
22
$54,414
APPLICATIONS APPROVED, NOT ACCEPTED
0
$0
7
$135,269
18
$116,751
5
$17,808
1
$84,770
1
$28,150
APPLICATIONS DENIED
0
$0
28
$71,446
104
$104,824
29
$52,952
4
$73,568
15
$64,331
APPLICATIONS WITHDRAWN
0
$0
8
$99,824
68
$121,048
10
$96,776
2
$257,530
5
$71,926
FILES CLOSED FOR INCOMPLETENESS
0
$0
1
$53,170
16
$125,180
0
$0
1
$212,670
0
$0
Aggregated Statistics For Year 2004 (Based on 4 partial tracts)
A) FHA, FSA/RHS & VA Home Purchase Loans
B) Conventional Home Purchase Loans
C) Refinancings
D) Home Improvement Loans
F) Non-occupant Loans on < 5 Family Dwellings (A B C & D)
G) Loans On Manufactured Home Dwelling (A B C & D)
Number
Average Value
Number
Average Value
Number
Average Value
Number
Average Value
Number
Average Value
Number
Average Value
LOANS ORIGINATED
4
$134,978
75
$108,858
155
$83,762
59
$37,030
20
$90,009
18
$54,563
APPLICATIONS APPROVED, NOT ACCEPTED
1
$87,730
10
$92,929
18
$96,399
1
$8,220
1
$101,020
2
$43,150
APPLICATIONS DENIED
1
$65,130
18
$92,375
87
$108,883
21
$49,343
4
$74,912
10
$63,231
APPLICATIONS WITHDRAWN
1
$77,090
14
$111,192
62
$108,022
7
$58,529
2
$135,715
3
$74,677
FILES CLOSED FOR INCOMPLETENESS
0
$0
1
$120,960
20
$105,676
0
$0
0
$0
1
$61,810
Aggregated Statistics For Year 2003 (Based on 4 partial tracts)
A) FHA, FSA/RHS & VA Home Purchase Loans
B) Conventional Home Purchase Loans
C) Refinancings
D) Home Improvement Loans
E) Loans on Dwellings For 5+ Families
F) Non-occupant Loans on < 5 Family Dwellings (A B C & D)
Number
Average Value
Number
Average Value
Number
Average Value
Number
Average Value
Number
Average Value
Number
Average Value
LOANS ORIGINATED
4
$126,528
61
$99,252
250
$92,585
34
$28,450
1
$96,370
11
$57,750
APPLICATIONS APPROVED, NOT ACCEPTED
1
$110,320
4
$108,632
25
$92,830
2
$38,890
0
$0
0
$0
APPLICATIONS DENIED
1
$75,100
15
$62,586
87
$104,724
15
$21,537
0
$0
3
$52,230
APPLICATIONS WITHDRAWN
0
$0
7
$75,024
61
$99,451
4
$32,798
0
$0
2
$39,565
FILES CLOSED FOR INCOMPLETENESS
0
$0
2
$145,435
6
$116,792
1
$138,280
0
$0
1
$123,620
Aggregated Statistics For Year 2002 (Based on 4 partial tracts)
A) FHA, FSA/RHS & VA Home Purchase Loans
B) Conventional Home Purchase Loans
C) Refinancings
D) Home Improvement Loans
F) Non-occupant Loans on < 5 Family Dwellings (A B C & D)
Number
Average Value
Number
Average Value
Number
Average Value
Number
Average Value
Number
Average Value
LOANS ORIGINATED
6
$109,987
61
$97,522
174
$84,416
29
$23,964
14
$53,925
APPLICATIONS APPROVED, NOT ACCEPTED
2
$71,445
8
$72,081
19
$83,739
4
$19,045
1
$55,160
APPLICATIONS DENIED
1
$34,560
20
$49,423
60
$91,319
8
$17,960
3
$63,397
APPLICATIONS WITHDRAWN
0
$0
8
$108,488
39
$93,193
2
$71,930
1
$129,650
FILES CLOSED FOR INCOMPLETENESS
0
$0
1
$44,530
9
$110,759
0
$0
0
$0
Aggregated Statistics For Year 2001 (Based on 4 partial tracts)
A) FHA, FSA/RHS & VA Home Purchase Loans
B) Conventional Home Purchase Loans
C) Refinancings
D) Home Improvement Loans
F) Non-occupant Loans on < 5 Family Dwellings (A B C & D)
Number
Average Value
Number
Average Value
Number
Average Value
Number
Average Value
Number
Average Value
LOANS ORIGINATED
7
$117,483
53
$88,728
155
$77,404
37
$24,632
5
$43,936
APPLICATIONS APPROVED, NOT ACCEPTED
0
$0
6
$52,698
23
$86,247
2
$29,005
0
$0
APPLICATIONS DENIED
1
$97,030
27
$69,455
66
$89,439
13
$17,565
1
$120,190
APPLICATIONS WITHDRAWN
0
$0
3
$97,190
31
$91,646
4
$24,272
0
$0
FILES CLOSED FOR INCOMPLETENESS
0
$0
1
$29,910
8
$101,860
0
$0
1
$29,910
Aggregated Statistics For Year 2000 (Based on 4 partial tracts)
A) FHA, FSA/RHS & VA Home Purchase Loans
B) Conventional Home Purchase Loans
C) Refinancings
D) Home Improvement Loans
F) Non-occupant Loans on < 5 Family Dwellings (A B C & D)
Number
Average Value
Number
Average Value
Number
Average Value
Number
Average Value
Number
Average Value
LOANS ORIGINATED
5
$94,206
61
$89,776
73
$53,224
35
$18,828
4
$64,882
APPLICATIONS APPROVED, NOT ACCEPTED
0
$0
9
$66,938
10
$60,532
5
$34,156
0
$0
APPLICATIONS DENIED
0
$0
31
$48,894
44
$71,143
11
$35,647
2
$70,790
APPLICATIONS WITHDRAWN
0
$0
8
$66,945
11
$82,647
3
$18,000
1
$116,300
FILES CLOSED FOR INCOMPLETENESS
0
$0
0
$0
12
$84,540
0
$0
1
$28,620
Aggregated Statistics For Year 1999 (Based on 2 partial tracts)
A) FHA, FSA/RHS & VA Home Purchase Loans
B) Conventional Home Purchase Loans
C) Refinancings
D) Home Improvement Loans
F) Non-occupant Loans on < 5 Family Dwellings (A B C & D)
Detailed PMIC statistics for the following Tracts:0305.02
, 0306.01
2005 - 2018 National Fire Incident Reporting System (NFIRS) incidents
According to the data from the years 2005 - 2018 the average number of fires per year is 15. The highest number of reported fire incidents - 36 took place in 2012, and the least - 1 in 2005. The data has a rising trend.
When looking into fire subcategories, the most reports belonged to: Structure Fires (50.5%), and Outside Fires (36.1%).
Fire incident types reported to NFIRS in Zip Code 17040
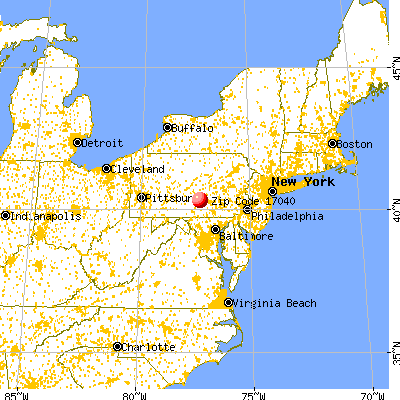


 Nearest zip codes: 17024, 17090, 17081, 17013, 17047, 17068.
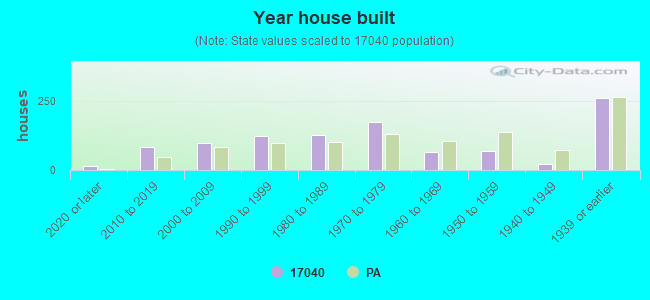


 According to the data from the years 2005 - 2018 the average number of fires per year is 15. The highest number of reported fire incidents - 36 took place in 2012, and the least - 1 in 2005. The data has a rising trend.
 When looking into fire subcategories, the most reports belonged to: Structure Fires (50.5%), and Outside Fires (36.1%).