Estimated zip code population in 2022: 3,400 Zip code population in 2010: 3,345 Zip code population in 2000: 3,126
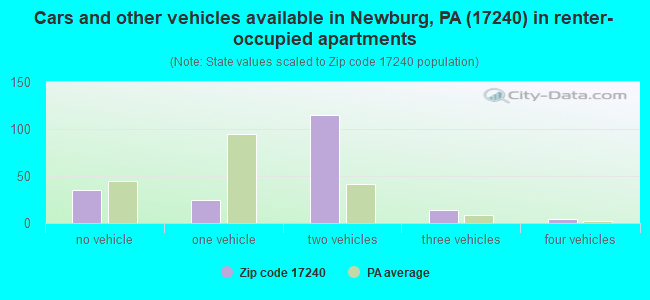
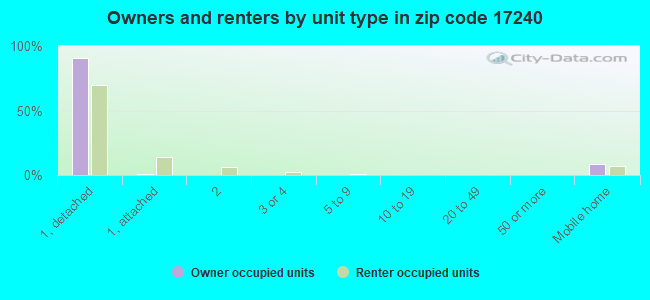
Houses and condos: 1,272 Renter-occupied apartments: 193
% of renters here:
16%
State:
31%
March 2022 cost of living index in zip code 17240: 93.5 (less than average, U.S. average is 100)
Land area: 48.0 sq. mi. Water area: 0.2 sq. mi.
Population density: 71 people per square mile
(very low).
OSM Map
General Map
Google Map
MSN Map
OSM Map
General Map
Google Map
MSN Map
OSM Map
General Map
Google Map
MSN Map
OSM Map
General Map
Google Map
MSN Map
Please wait while loading the map...
Real estate property taxes paid for housing units in 2022:
This zip code:
1.0% ($2,660)
Pennsylvania:
1.3% ($3,094)
Median real estate property taxes paid for housing units with mortgages in 2022: $2,878 (1.1%) Median real estate property taxes paid for housing units with no mortgage in 2022: $2,322 (1.0%)
Business Search- 14 Million verified businesses
Males: 1,763
(51.9%)
Females: 1,636
(48.1%)
For population 25 years and over in 17240:
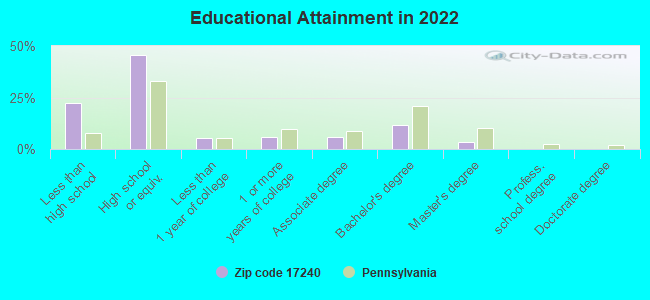
High school or higher: 75.3%
Bachelor's degree or higher: 15.3%
Graduate or professional degree: 3.9%
Unemployed: 3.7%
Mean travel time to work (commute): 29.5 minutes
For population 15 years and over in 17240:
Never married: 20.3%
Now married: 65.0%
Separated: 2.5%
Widowed: 3.2%
Divorced: 9.0%
Zip code 17240 compared to state average:
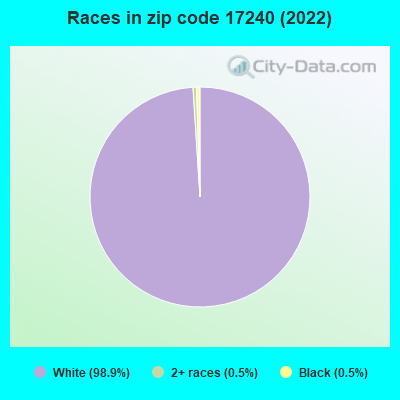
Black race population percentage significantly below state average.
Hispanic race population percentage significantly below state average.
Foreign-born population percentage significantly below state average.
Renting percentage below state average.
Length of stay since moving in significantly above state average.
House age below state average.
Number of college students significantly below state average.
Percentage of population with a bachelor's degree or higher significantly below state average.
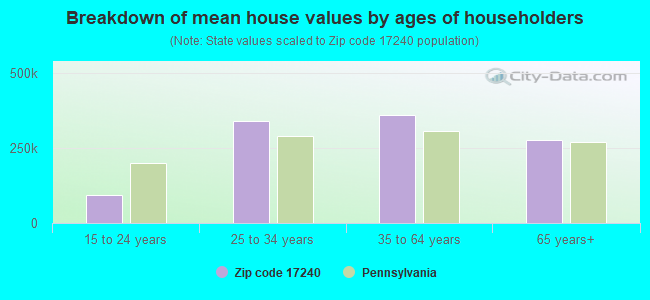
Estimated median house/condo value in 2022: $259,501
17240:
$259,501
Pennsylvania:
$245,500
According to our research of Pennsylvania and other state lists, there were 4 registered sex offenders living in 17240 zip code as of April 17, 2024. The ratio of all residents to sex offenders in zip code 17240 is 990 to 1. The ratio of registered sex offenders to all residents in this zip code is lower than the state average.
Median resident age:
This zip code:
38.5 years
Pennsylvania median age:
40.9 years
Average household size:
This zip code:
2.7 people
Pennsylvania:
2.4 people
Averages for the 2020 tax year for zip code 17240, filed in 2021:
Average Adjusted Gross Income (AGI) in 2020: $61,128 (Individual Income Tax Returns)
Here:
$61,128
State:
$75,707
Salary/wage: $49,750 (reported on 76.2% of returns)
Here:
$49,750
State:
$62,806
(% of AGI for various income ranges: 1349.2% for AGIs below $25k, 4400.0% for AGIs $25k-50k, 7320.7% for AGIs $50k-75k, 10580.0% for AGIs $75k-100k, 14375.0% for AGIs $100k-200k)
Taxable interest for individuals: $1,138 (reported on 33.1% of returns)
This zip code:
$1,138
Pennsylvania:
$1,633
(% of AGI for various income ranges: 36.5% for AGIs below $25k, 65.6% for AGIs $25k-50k, 62.0% for AGIs $50k-75k, 78.2% for AGIs $75k-100k, 66.4% for AGIs $100k-200k)
Ordinary dividends: $2,500 (reported on 19.4% of returns)
Here:
$2,500
State:
$7,382
(% of AGI for various income ranges: 34.6% for AGIs below $25k, 36.8% for AGIs $25k-50k, 58.0% for AGIs $50k-75k, 94.5% for AGIs $75k-100k, 135.0% for AGIs $100k-200k)
Net capital gain/loss in AGI: +$8,274 (reported on 14.4% of returns)
Here:
+$8,274
State:
+$23,522
(% of AGI for various income ranges: 10.4% for AGIs below $25k, 70.4% for AGIs $25k-50k, 34.7% for AGIs $50k-75k, 262.7% for AGIs $75k-100k, 970.7% for AGIs $100k-200k)
Profit/loss from business: +$25,008 (reported on 22.5% of returns)
Here:
+$25,008
State:
+$16,274
(% of AGI for various income ranges: 163.5% for AGIs below $25k, 406.8% for AGIs $25k-50k, 1102.0% for AGIs $50k-75k, 970.0% for AGIs $75k-100k, 3457.9% for AGIs $100k-200k)
Taxable individual retirement arrangement distribution: $15,964 (reported on 8.8% of returns)
17240:
$15,964
Pennsylvania:
$18,583
(% of AGI for various income ranges: 78.1% for AGIs below $25k, 174.0% for AGIs $25k-50k, 146.7% for AGIs $50k-75k, 276.4% for AGIs $75k-100k, 766.4% for AGIs $100k-200k)
Total itemized deductions: $30,617 (reported on 3.8% of returns)
Here:
$30,617
State:
$34,850
(% of AGI for various income ranges: 576.7% for AGIs $50k-75k, 694.3% for AGIs $100k-200k)
Charity contributions: $12,475 (reported on 2.5% of returns)
Here:
$12,475
State:
$12,392
(% of AGI for various income ranges: 356.4% for AGIs $100k-200k)
Taxes paid: $6,650 (reported on 3.8% of returns)
17240:
$6,650
State:
$8,200
(% of AGI for various income ranges: 100.0% for AGIs $50k-75k, 177.9% for AGIs $100k-200k)
Earned income credit: $2,073 (reported on 9.4% of returns)
Here:
$2,073
State:
$2,100
(% of AGI for various income ranges: 55.0% for AGIs below $25k, 67.2% for AGIs $25k-50k)
Percentage of individuals using paid preparers for their 2020 taxes: 94.4%
Here:
94%
State:
92%
(% for various income ranges: 95.7% for AGIs below $25k, 97.6% for AGIs $25k-50k, 92.3% for AGIs $50k-75k, 89.5% for AGIs $75k-100k, 91.7% for AGIs $100k-200k, 100.0% for AGIs over 200k)
Averages for the 2012 tax year for zip code 17240, filed in 2013:
Average Adjusted Gross Income (AGI) in 2012: $44,607 (Individual Income Tax Returns)
Here:
$44,607
State:
$61,346
Salary/wage: $39,892 (reported on 77.8% of returns)
Here:
$39,892
State:
$51,902
(% of AGI for various income ranges: 69.7% for AGIs below $25k, 66.0% for AGIs $25k-50k, 69.8% for AGIs $50k-75k, 77.5% for AGIs $75k-100k, 66.4% for AGIs $100k-200k)
Taxable interest for individuals: $904 (reported on 35.9% of returns)
This zip code:
$904
Pennsylvania:
$1,588
(% of AGI for various income ranges: 2.2% for AGIs below $25k, 0.6% for AGIs $25k-50k, 0.5% for AGIs $50k-75k, 0.3% for AGIs $75k-100k, 0.8% for AGIs $100k-200k)
Ordinary dividends: $2,046 (reported on 17.0% of returns)
Here:
$2,046
State:
$5,827
(% of AGI for various income ranges: 1.1% for AGIs below $25k, 0.9% for AGIs $25k-50k, 0.8% for AGIs $50k-75k, 0.4% for AGIs $75k-100k, 0.8% for AGIs $100k-200k)
Net capital gain/loss in AGI: +$3,482 (reported on 14.4% of returns)
Here:
+$3,482
State:
+$14,495
(% of AGI for various income ranges: 0.9% for AGIs below $25k, 0.8% for AGIs $25k-50k, 1.0% for AGIs $50k-75k, 0.6% for AGIs $75k-100k, 2.1% for AGIs $100k-200k)
Profit/loss from business: +$17,597 (reported on 21.6% of returns)
Here:
+$17,597
State:
+$16,268
(% of AGI for various income ranges: 13.7% for AGIs below $25k, 10.2% for AGIs $25k-50k, 10.2% for AGIs $50k-75k, 5.9% for AGIs $75k-100k, 5.1% for AGIs $100k-200k)
Taxable individual retirement arrangement distribution: $10,907 (reported on 9.8% of returns)
17240:
$10,907
Pennsylvania:
$14,550
(% of AGI for various income ranges: 3.5% for AGIs below $25k, 2.4% for AGIs $25k-50k, 2.7% for AGIs $50k-75k, 3.4% for AGIs $100k-200k)
Total itemized deductions: $17,415 (23% of AGI, reported on 25.5% of returns)
Here:
$17,415
State:
$23,538
Here:
23.3% of AGI
State:
18.4% of AGI
(% of AGI for various income ranges: 7.4% for AGIs below $25k, 6.2% for AGIs $25k-50k, 10.4% for AGIs $50k-75k, 13.4% for AGIs $75k-100k, 11.2% for AGIs $100k-200k)
Charity contributions: $3,943 (reported on 18.3% of returns)
Here:
$3,943
State:
$4,025
(% of AGI for various income ranges: 0.8% for AGIs $25k-50k, 1.2% for AGIs $50k-75k, 2.6% for AGIs $75k-100k, 2.7% for AGIs $100k-200k)
Taxes paid: $5,828 (reported on 25.5% of returns)
17240:
$5,828
State:
$9,982
(% of AGI for various income ranges: 1.2% for AGIs below $25k, 1.8% for AGIs $25k-50k, 3.3% for AGIs $50k-75k, 4.6% for AGIs $75k-100k, 4.6% for AGIs $100k-200k)
Earned income credit: $2,079 (reported on 12.4% of returns)
Here:
$2,079
State:
$2,106
(% of AGI for various income ranges: 4.3% for AGIs below $25k, 0.8% for AGIs $25k-50k)
Percentage of individuals using paid preparers for their 2012 taxes: 62.1%
Here:
62%
State:
53%
(% for various income ranges: 57.1% for AGIs below $25k, 65.0% for AGIs $25k-50k, 63.3% for AGIs $50k-75k, 64.3% for AGIs $75k-100k, 69.2% for AGIs $100k-200k)
Averages for the 2004 tax year for zip code 17240, filed in 2005:
Average Adjusted Gross Income (AGI) in 2004: $39,394 (Individual Income Tax Returns)
Here:
$39,394
State:
$48,049
Salary/wage: $36,438 (reported on 80.9% of returns)
Here:
$36,438
State:
$42,646
(% of AGI for various income ranges: 83.6% for AGIs below $10k, 71.5% for AGIs $10k-25k, 75.0% for AGIs $25k-50k, 81.9% for AGIs $50k-75k, 73.9% for AGIs $75k-100k, 62.6% for AGIs over 100k)
Taxable interest for individuals: $894 (reported on 47.9% of returns)
This zip code:
$894
Pennsylvania:
$1,657
(% of AGI for various income ranges: 5.7% for AGIs below $10k, 1.7% for AGIs $10k-25k, 1.2% for AGIs $25k-50k, 0.9% for AGIs $50k-75k, 0.9% for AGIs $75k-100k, 0.7% for AGIs over 100k)
Taxable dividends: $1,303 (reported on 24.5% of returns)
Here:
$1,303
State:
$3,566
(% of AGI for various income ranges: 1.6% for AGIs below $10k, 0.9% for AGIs $10k-25k, 0.7% for AGIs $25k-50k, 1.0% for AGIs $50k-75k, 0.5% for AGIs $75k-100k, 0.9% for AGIs over 100k)
Net capital gain/loss: +$8,442 (reported on 14.2% of returns)
Here:
+$8,442
State:
+$9,716
(% of AGI for various income ranges: 2.4% for AGIs below $10k, -0.2% for AGIs $10k-25k, 1.2% for AGIs $25k-50k, 0.6% for AGIs $50k-75k, 3.1% for AGIs $75k-100k, 13.5% for AGIs over 100k)
Profit/loss from business: +$13,208 (reported on 20.8% of returns)
Here:
+$13,208
State:
+$14,267
(% of AGI for various income ranges: 13.6% for AGIs below $10k, 8.4% for AGIs $10k-25k, 8.2% for AGIs $25k-50k, 4.8% for AGIs $50k-75k, 9.3% for AGIs $75k-100k, 5.0% for AGIs over 100k)
Profit/loss from farming: +$301 (reported on 7.1% of returns)
Here:
+$301
State:
+$274
(% of AGI for various income ranges: -2.5% for AGIs below $10k, 0.5% for AGIs $10k-25k, 0.8% for AGIs $25k-50k, -0.6% for AGIs $50k-75k)
IRA payment deduction: $2,588 (reported on 2.3% of returns)
17240:
$2,588
Pennsylvania:
$2,903
Total itemized deductions: $13,936 (21% of AGI, reported on 24.7% of returns)
Here:
$13,936
State:
$18,804
Here:
20.7% of AGI
State:
19.5% of AGI
(% of AGI for various income ranges: 6.1% for AGIs $10k-25k, 6.4% for AGIs $25k-50k, 10.3% for AGIs $50k-75k, 11.3% for AGIs $75k-100k, 9.7% for AGIs over 100k)
Charity contributions deductions: $2,481 (3% of AGI, reported on 20.3% of returns)
Here:
$2,481
State:
$3,337
Here:
3.5% of AGI
State:
3.3% of AGI
(% of AGI for various income ranges: 0.6% for AGIs $10k-25k, 0.8% for AGIs $25k-50k, 1.4% for AGIs $50k-75k, 1.6% for AGIs $75k-100k, 2.0% for AGIs over 100k)
Total tax: $4,390 (reported on 76.9% of returns)
17240:
$4,390
State:
$8,008
(% of AGI for various income ranges: 4.2% for AGIs below $10k, 4.8% for AGIs $10k-25k, 6.5% for AGIs $25k-50k, 7.8% for AGIs $50k-75k, 9.9% for AGIs $75k-100k, 15.1% for AGIs over 100k)
Earned income credit: $1,587 (reported on 9.5% of returns)
Here:
$1,587
State:
$1,643
Percentage of individuals using paid preparers for their 2004 taxes: 60.7%
Here:
61%
State:
56%
(% for various income ranges: 51.8% for AGIs below $10k, 61.7% for AGIs $10k-25k, 65.2% for AGIs $25k-50k, 61.7% for AGIs $50k-75k, 58.2% for AGIs $75k-100k, 60.7% for AGIs over 100k)
Household received Food Stamps/SNAP in the past 12 months: 51 Household did not receive Food Stamps/SNAP in the past 12 months: 1,182
Women who had a birth in the past 12 months: 49 (43 now married, 7 unmarried) Women who did not have a birth in the past 12 months: 635 (356 now married, 275 unmarried)
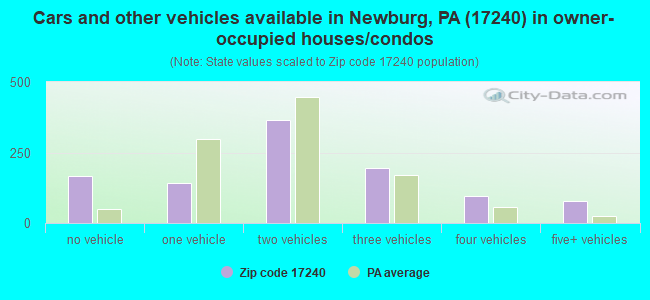
Housing units in zip code 17240 with a mortgage: 647 (133 second mortgage, 2 home equity loan, 100 both second mortgage and home equity loan) Houses without a mortgage: 8
Median monthly owner costs for units with a mortgage: $1,408 Median monthly owner costs for units without a mortgage: $491
Residents with income below the poverty level in 2022:
This zip code:
8.3%
Whole state:
11.8%
Residents with income below 50% of the poverty level in 2022:
This zip code:
3.9%
Whole state:
6.1%
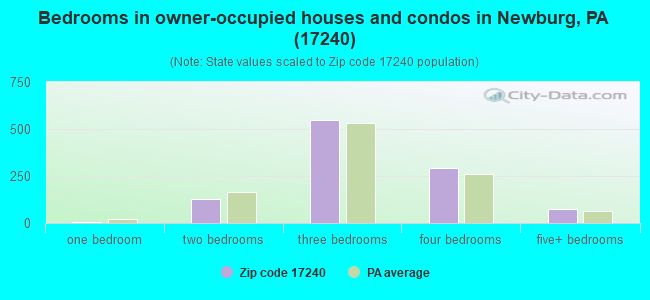
Median number of rooms in houses and condos:
Here:
6.5
State:
6.8
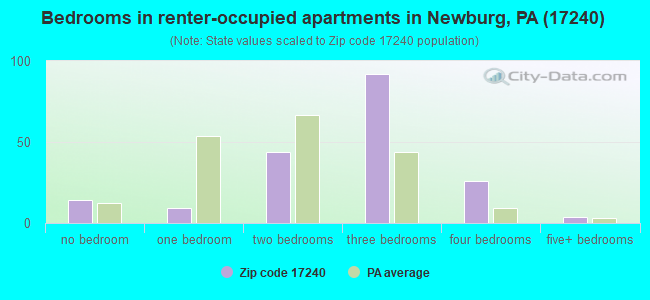
Median number of rooms in apartments:
Here:
5.9
State:
4.3
Notable locations in this zip code not listed on our city pages
696 married couples with children.
43 single-parent households (16 men, 27 women).
79.5% of residents of 17240 zip code speak English at home.
20.1% of residents speak other Indo-European language at home (71% very well, 25% well, 4% not well).
0.1% of residents speak Asian or Pacific Island language at home (100% very well).
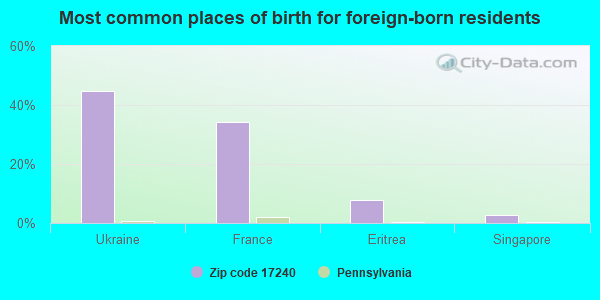
Foreign born population: 38 (1.1%) (36.1% of them are naturalized citizens)
This zip code:
1.1%
Whole state:
7.5%
45%Ukraine
34%France
8%Eritrea
3%Singapore
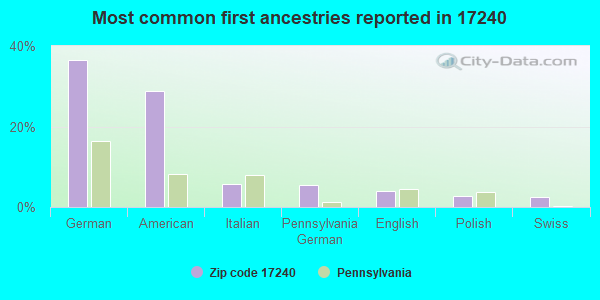
37%German
29%American
6%Italian
5%Pennsylvania German
4%English
3%Polish
3%Swiss
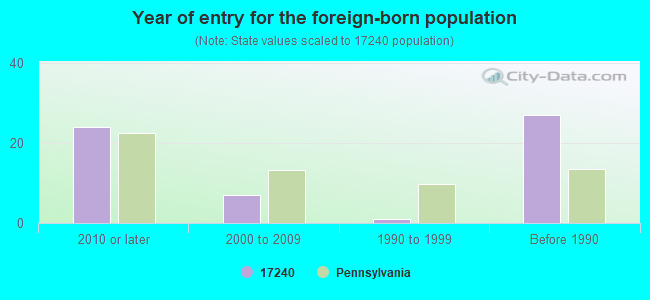
Year of entry for the foreign-born population
242010 or later
72000 to 2009
11990 to 1999
27Before 1990
Facilities with environmental interests located in this zip code:
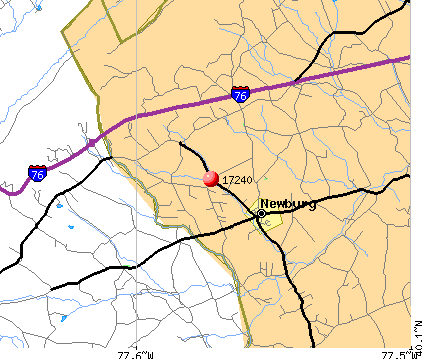
BLUE MTN FARM CAFO (10391 OTTERBEIN CHURCH ROAD in NEWBURG, PA)
STATE MASTER (Pennsylvania database) - PCS-PA0246379, National Pollutant Discharge Elimination System Permit National Pollutant Discharge Elimination System NON-MAJOR (Tracking pollutant discharge elimination systems) - permit Business SIC classification: HOGS; GENERAL FARMS, PRIMARILY LIVESTOCK AND ANIMAL SPECIALTIES Alternative names: BLEVINS BLUE MTN FINSIHING FRM, BLEVINS BLUE MTN FNSHNG FARM
ALLEN RICE & BRIAN BRECHBILL (D/B/A DREAM FARMS in NEWBURG, PA)
National Pollutant Discharge Elimination System NON-MAJOR (Tracking pollutant discharge elimination systems) - permit Business SIC classification: DAIRY FARMS Alternative names: AGWAY AGRICULTURAL PRODUCTS, RICE, ALLEN & BRECHBILL, BRIAN
Housing units lacking complete plumbing facilities: 0.1% Housing units lacking complete kitchen facilities: 1.5%
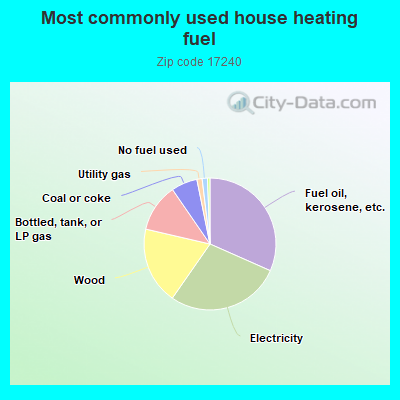
31.7%Fuel oil, kerosene, etc.
28.1%Electricity
19.0%Wood
11.8%Bottled, tank, or LP gas
6.4%Coal or coke
1.3%Utility gas
1.3%No fuel used
0.6%Other fuel
Population in 1990: 2,350. Population change in the 1990s: +776 (+33.0%).
Place of birth for U.S.-born residents:
This state: 2,997
Northeast: 75
Midwest: 62
South: 164
West: 12
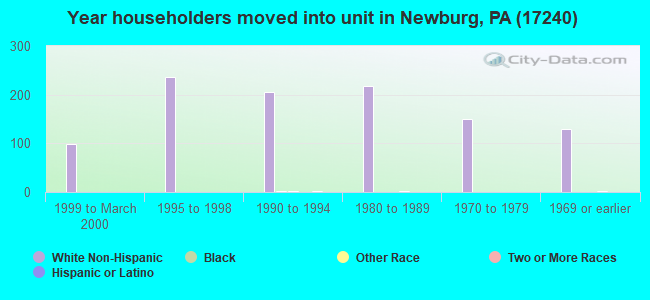
75% of the 17240 zip code residents lived in the same house 5 years ago. Out of people who lived in different houses, 54% lived in this county. Out of people who lived in different counties, 50% lived in Pennsylvania.
95% of the 17240 zip code residents lived in the same house 1 year ago. Out of people who lived in different houses, 61% moved from this county. Out of people who lived in different houses, 39% moved from different county within same state. Out of people who lived in different houses, 2% moved from abroad.
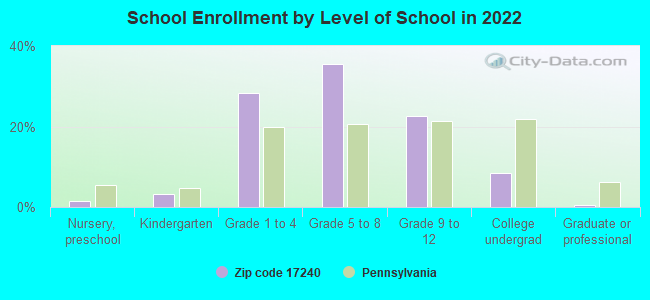
Private vs. public school enrollment:
Students in private schools in grades 1 to 8 (elementary and middle school): 187
Here:
50.5%
Pennsylvania:
15.7%
Students in private schools in grades 9 to 12 (high school): 8
Here:
6.5%
Pennsylvania:
13.4%
Students in private undergraduate colleges: 11
Here:
24.3%
Pennsylvania:
39.8%
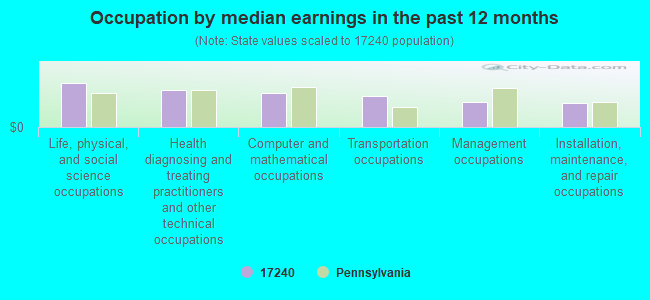
Occupation by median earnings in the past 12 months ($)
118,616Life, physical, and social science occupations
100,170Health diagnosing and treating practitioners and other technical occupations
90,654Computer and mathematical occupations
83,136Transportation occupations
66,836Management occupations
65,501Installation, maintenance, and repair occupations
Companies with federal contracts located in this zip code:
WSI-HARRISBURG HAULING INC (620 NEWVILLE RD in NEWBURG, PA) : $143,382 in 35 contractsfrom 2000 to 2006
Contracts for Other Housekeeping Services, Trash/Garbage Collection Services - Including Portable Sanitation Services by Navy Signed by year:2000: $20,000; 2001: $0; 2002: $38,736; 2003: $33,240; 2004: $3,269; 2005: $31,134; 2006: $17,003.
Biggest contracts:
$11,979 with Navy for Other Housekeeping Services. Signed on 2003-06-23. Completion date: 2003-06-30.
$10,000 with Navy for Trash/Garbage Collection Services - Including Portable Sanitation Services. Signed on 2000-02-22. Completion date: 2001-02-13.
$10,000, same as above.Signed on 2000-08-31. Completion date: 2001-02-13.
$10,000, same as above.Signed on 2002-10-01. Completion date: 2002-02-13.
COMMUNITY REFUSE SERVICE INC (620 NEWVILLE RD in NEWBURG, PA) : $45,505 in 20 contractsfrom 2000 to 2004
Contracts for Trash/Garbage Collection Services - Including Portable Sanitation Services by Navy Signed by year:2000: -$9,870; 2001: $14,863; 2002: -$105; 2003: $5,923; 2004: $34,694; 2005: $0; 2006: $0.
Biggest contracts:
$36,238 with Navy for Trash/Garbage Collection Services - Including Portable Sanitation Services. Signed on 2000-08-03. Completion date: 2001-02-13.
$15,150, same as above.Signed on 2004-02-13. Completion date: 2005-02-12.
$14,863, same as above.Signed on 2001-10-01. Completion date: 2002-02-13.
$4,509, same as above.Signed on 2002-04-03. Completion date: 2002-04-14.
NEGLEYS WELL DRILLING, INC (16199 CUMBERLAND HIGHWAY in NEWBURG, PA; small business)
$1,706 with Army for Maintenance, Repair and Rebuilding of Equipment -- Pumps and Compressors. Signed on 2004-10-25. Completion date: 2004-11-02.
Top industries in this zip code by the number of employees in 2005:
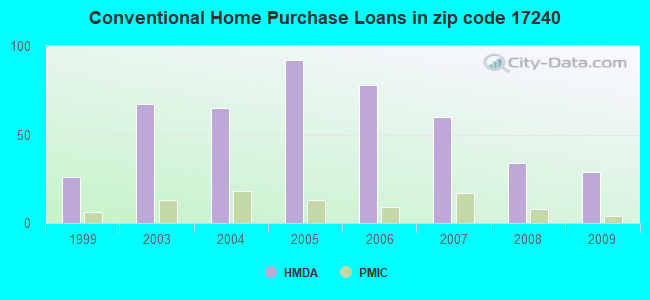
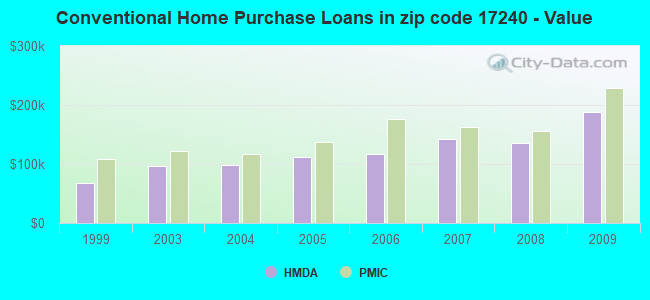
Detailed PMIC statistics for the following Tracts:0131.01
2005 - 2018 National Fire Incident Reporting System (NFIRS) incidents
Based on the data from the years 2005 - 2018 the average number of fires per year is 35. The highest number of fires - 73 took place in 2007, and the least - 13 in 2005. The data has an increasing trend.
When looking into fire subcategories, the most incidents belonged to: Structure Fires (53.3%), and Outside Fires (24.5%).
Fire incident types reported to NFIRS in Zip Code 17240

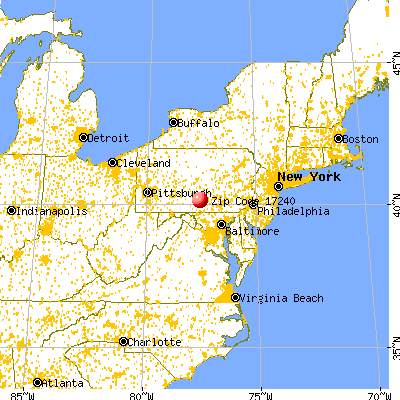


 Nearest zip codes: 17210, 17244, 17251, 17246, 17257, 17006.


 Based on the data from the years 2005 - 2018 the average number of fires per year is 35. The highest number of fires - 73 took place in 2007, and the least - 13 in 2005. The data has an increasing trend.
 When looking into fire subcategories, the most incidents belonged to: Structure Fires (53.3%), and Outside Fires (24.5%).