Estimated zip code population in 2022: 23,611 Zip code population in 2010: 22,156 Zip code population in 2000: 6,232
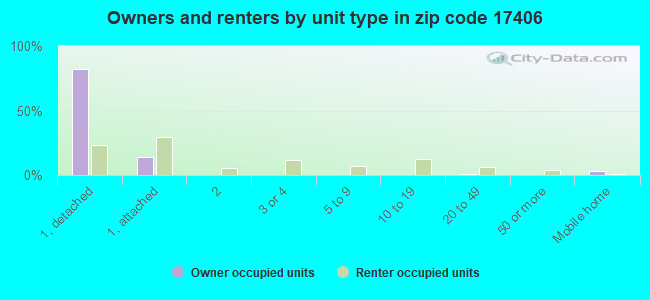
Houses and condos: 9,405 Renter-occupied apartments: 1,839
% of renters here:
20%
State:
31%
March 2022 cost of living index in zip code 17406: 94.8 (less than average, U.S. average is 100)
Land area: 49.6 sq. mi. Water area: 0.0 sq. mi.
Population density: 476 people per square mile
(low).
OSM Map
General Map
Google Map
MSN Map
OSM Map
General Map
Google Map
MSN Map
OSM Map
General Map
Google Map
MSN Map
OSM Map
General Map
Google Map
MSN Map
Please wait while loading the map...
Real estate property taxes paid for housing units in 2022:
This zip code:
1.6% ($3,611)
Pennsylvania:
1.3% ($3,094)
Median real estate property taxes paid for housing units with mortgages in 2022: $3,654 (1.6%) Median real estate property taxes paid for housing units with no mortgage in 2022: $3,546 (1.7%)
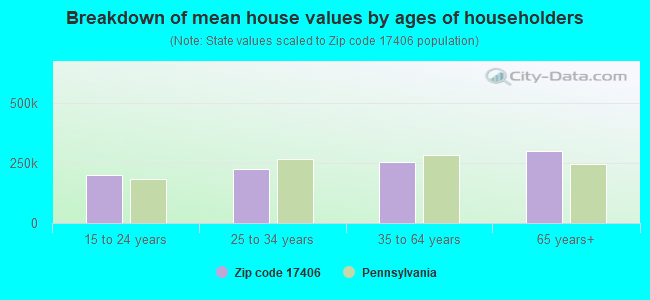
Estimated median house/condo value in 2022: $219,018
17406:
$219,018
Pennsylvania:
$245,500
According to our research of Pennsylvania and other state lists, there were 31 registered sex offenders living in 17406 zip code as of April 16, 2024. The ratio of all residents to sex offenders in zip code 17406 is 763 to 1. The ratio of registered sex offenders to all residents in this zip code is lower than the state average.
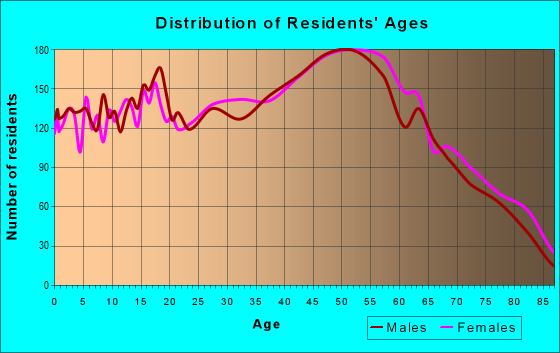
Median resident age:
This zip code:
40.0 years
Pennsylvania median age:
40.9 years
Average household size:
This zip code:
2.5 people
Pennsylvania:
2.4 people
Averages for the 2020 tax year for zip code 17406, filed in 2021:
Average Adjusted Gross Income (AGI) in 2020: $65,755 (Individual Income Tax Returns)
Here:
$65,755
State:
$75,707
Salary/wage: $58,091 (reported on 81.8% of returns)
Here:
$58,091
State:
$62,806
(% of AGI for various income ranges: 996.5% for AGIs below $25k, 3456.4% for AGIs $25k-50k, 6152.5% for AGIs $50k-75k, 9534.2% for AGIs $75k-100k, 16811.6% for AGIs $100k-200k, 80783.6% for AGIs over 200k)
Taxable interest for individuals: $1,311 (reported on 30.6% of returns)
This zip code:
$1,311
Pennsylvania:
$1,633
(% of AGI for various income ranges: 18.2% for AGIs below $25k, 25.8% for AGIs $25k-50k, 33.0% for AGIs $50k-75k, 63.7% for AGIs $75k-100k, 102.7% for AGIs $100k-200k, 1398.2% for AGIs over 200k)
Ordinary dividends: $4,190 (reported on 21.4% of returns)
Here:
$4,190
State:
$7,382
(% of AGI for various income ranges: 31.0% for AGIs below $25k, 44.3% for AGIs $25k-50k, 68.3% for AGIs $50k-75k, 87.5% for AGIs $75k-100k, 242.4% for AGIs $100k-200k, 4080.9% for AGIs over 200k)
Net capital gain/loss in AGI: +$11,452 (reported on 17.6% of returns)
Here:
+$11,452
State:
+$23,522
(% of AGI for various income ranges: 12.2% for AGIs below $25k, 39.0% for AGIs $25k-50k, 50.1% for AGIs $50k-75k, 126.4% for AGIs $75k-100k, 456.6% for AGIs $100k-200k, 14857.3% for AGIs over 200k)
Profit/loss from business: +$14,111 (reported on 12.1% of returns)
Here:
+$14,111
State:
+$16,274
(% of AGI for various income ranges: 80.1% for AGIs below $25k, 93.5% for AGIs $25k-50k, 115.6% for AGIs $50k-75k, 170.2% for AGIs $75k-100k, 534.7% for AGIs $100k-200k, 6501.8% for AGIs over 200k)
Taxable individual retirement arrangement distribution: $15,326 (reported on 13.1% of returns)
17406:
$15,326
Pennsylvania:
$18,583
(% of AGI for various income ranges: 119.5% for AGIs below $25k, 130.5% for AGIs $25k-50k, 219.3% for AGIs $50k-75k, 363.3% for AGIs $75k-100k, 661.7% for AGIs $100k-200k, 3530.0% for AGIs over 200k)
Self-employed (Keogh) retirement plans: $20,675 (reported on 0.3% of returns)
17406:
$20,675
Pennsylvania:
$25,407
(% of AGI for various income ranges: 751.8% for AGIs over 200k)
Total itemized deductions: $29,690 (reported on 6.6% of returns)
Here:
$29,690
State:
$34,850
(% of AGI for various income ranges: 42.0% for AGIs below $25k, 98.4% for AGIs $25k-50k, 177.6% for AGIs $50k-75k, 357.9% for AGIs $75k-100k, 673.4% for AGIs $100k-200k, 5918.2% for AGIs over 200k)
Charity contributions: $10,141 (reported on 4.7% of returns)
Here:
$10,141
State:
$12,392
(% of AGI for various income ranges: 2.3% for AGIs below $25k, 7.5% for AGIs $25k-50k, 28.7% for AGIs $50k-75k, 60.8% for AGIs $75k-100k, 170.3% for AGIs $100k-200k, 2415.5% for AGIs over 200k)
Taxes paid: $8,112 (reported on 6.5% of returns)
17406:
$8,112
State:
$8,200
(% of AGI for various income ranges: 6.2% for AGIs below $25k, 18.9% for AGIs $25k-50k, 61.6% for AGIs $50k-75k, 123.0% for AGIs $75k-100k, 193.7% for AGIs $100k-200k, 1319.1% for AGIs over 200k)
Earned income credit: $2,096 (reported on 10.7% of returns)
Here:
$2,096
State:
$2,100
(% of AGI for various income ranges: 60.7% for AGIs below $25k, 52.9% for AGIs $25k-50k, 0.8% for AGIs $50k-75k)
Percentage of individuals using paid preparers for their 2020 taxes: 93.0%
Here:
93%
State:
92%
(% for various income ranges: 91.1% for AGIs below $25k, 94.2% for AGIs $25k-50k, 93.1% for AGIs $50k-75k, 94.2% for AGIs $75k-100k, 93.3% for AGIs $100k-200k, 95.0% for AGIs over 200k)
Averages for the 2012 tax year for zip code 17406, filed in 2013:
Average Adjusted Gross Income (AGI) in 2012: $54,516 (Individual Income Tax Returns)
Here:
$54,516
State:
$61,346
Salary/wage: $48,213 (reported on 83.8% of returns)
Here:
$48,213
State:
$51,902
(% of AGI for various income ranges: 67.7% for AGIs below $25k, 78.9% for AGIs $25k-50k, 79.6% for AGIs $50k-75k, 82.1% for AGIs $75k-100k, 78.7% for AGIs $100k-200k, 49.3% for AGIs over 200k)
Taxable interest for individuals: $1,241 (reported on 37.0% of returns)
This zip code:
$1,241
Pennsylvania:
$1,588
(% of AGI for various income ranges: 1.5% for AGIs below $25k, 0.8% for AGIs $25k-50k, 0.6% for AGIs $50k-75k, 0.6% for AGIs $75k-100k, 0.6% for AGIs $100k-200k, 1.5% for AGIs over 200k)
Ordinary dividends: $3,305 (reported on 22.8% of returns)
Here:
$3,305
State:
$5,827
(% of AGI for various income ranges: 1.9% for AGIs below $25k, 0.9% for AGIs $25k-50k, 0.9% for AGIs $50k-75k, 0.7% for AGIs $75k-100k, 1.3% for AGIs $100k-200k, 3.1% for AGIs over 200k)
Net capital gain/loss in AGI: +$8,137 (reported on 15.4% of returns)
Here:
+$8,137
State:
+$14,495
(% of AGI for various income ranges: 0.4% for AGIs $25k-50k, 0.2% for AGIs $50k-75k, 0.5% for AGIs $75k-100k, 1.4% for AGIs $100k-200k, 11.5% for AGIs over 200k)
Profit/loss from business: +$13,551 (reported on 11.8% of returns)
Here:
+$13,551
State:
+$16,268
(% of AGI for various income ranges: 4.5% for AGIs below $25k, 3.4% for AGIs $25k-50k, 1.6% for AGIs $50k-75k, 1.6% for AGIs $75k-100k, 2.9% for AGIs $100k-200k, 4.7% for AGIs over 200k)
Taxable individual retirement arrangement distribution: $12,892 (reported on 13.6% of returns)
17406:
$12,892
Pennsylvania:
$14,550
(% of AGI for various income ranges: 6.5% for AGIs below $25k, 3.0% for AGIs $25k-50k, 2.3% for AGIs $50k-75k, 2.7% for AGIs $75k-100k, 3.6% for AGIs $100k-200k, 3.0% for AGIs over 200k)
Self-employment retirement plans: $12,700 (reported on 0.4% of returns)
17406:
$12,700
Pennsylvania:
$20,922
Total itemized deductions: $19,581 (21% of AGI, reported on 34.6% of returns)
Here:
$19,581
State:
$23,538
Here:
20.7% of AGI
State:
18.4% of AGI
(% of AGI for various income ranges: 11.4% for AGIs below $25k, 10.4% for AGIs $25k-50k, 12.2% for AGIs $50k-75k, 13.0% for AGIs $75k-100k, 14.6% for AGIs $100k-200k, 11.5% for AGIs over 200k)
Charity contributions: $3,364 (reported on 25.0% of returns)
Here:
$3,364
State:
$4,025
(% of AGI for various income ranges: 0.7% for AGIs below $25k, 0.8% for AGIs $25k-50k, 1.3% for AGIs $50k-75k, 1.4% for AGIs $75k-100k, 1.9% for AGIs $100k-200k, 2.5% for AGIs over 200k)
Taxes paid: $7,807 (reported on 34.4% of returns)
17406:
$7,807
State:
$9,982
(% of AGI for various income ranges: 2.7% for AGIs below $25k, 3.4% for AGIs $25k-50k, 4.4% for AGIs $50k-75k, 5.2% for AGIs $75k-100k, 6.5% for AGIs $100k-200k, 5.7% for AGIs over 200k)
Earned income credit: $1,976 (reported on 13.3% of returns)
Here:
$1,976
State:
$2,106
(% of AGI for various income ranges: 4.4% for AGIs below $25k, 0.8% for AGIs $25k-50k)
Percentage of individuals using paid preparers for their 2012 taxes: 48.4%
Here:
48%
State:
53%
(% for various income ranges: 42.9% for AGIs below $25k, 46.4% for AGIs $25k-50k, 50.5% for AGIs $50k-75k, 53.7% for AGIs $75k-100k, 57.1% for AGIs $100k-200k, 82.6% for AGIs over 200k)
Averages for the 2004 tax year for zip code 17406, filed in 2005:
Average Adjusted Gross Income (AGI) in 2004: $44,286 (Individual Income Tax Returns)
Here:
$44,286
State:
$48,049
Salary/wage: $40,722 (reported on 86.8% of returns)
Here:
$40,722
State:
$42,646
(% of AGI for various income ranges: 96.4% for AGIs below $10k, 76.4% for AGIs $10k-25k, 84.5% for AGIs $25k-50k, 86.5% for AGIs $50k-75k, 87.4% for AGIs $75k-100k, 62.6% for AGIs over 100k)
Taxable interest for individuals: $1,309 (reported on 51.2% of returns)
This zip code:
$1,309
Pennsylvania:
$1,657
(% of AGI for various income ranges: 8.2% for AGIs below $10k, 2.6% for AGIs $10k-25k, 1.5% for AGIs $25k-50k, 0.9% for AGIs $50k-75k, 1.0% for AGIs $75k-100k, 1.7% for AGIs over 100k)
Taxable dividends: $1,986 (reported on 28.0% of returns)
Here:
$1,986
State:
$3,566
(% of AGI for various income ranges: 3.4% for AGIs below $10k, 1.5% for AGIs $10k-25k, 0.8% for AGIs $25k-50k, 0.8% for AGIs $50k-75k, 0.9% for AGIs $75k-100k, 2.2% for AGIs over 100k)
Net capital gain/loss: +$4,124 (reported on 19.0% of returns)
Here:
+$4,124
State:
+$9,716
(% of AGI for various income ranges: -2.7% for AGIs below $10k, -0.3% for AGIs $10k-25k, 0.1% for AGIs $25k-50k, 0.5% for AGIs $50k-75k, 0.5% for AGIs $75k-100k, 6.7% for AGIs over 100k)
Profit/loss from business: +$11,806 (reported on 14.0% of returns)
Here:
+$11,806
State:
+$14,267
(% of AGI for various income ranges: 1.8% for AGIs below $10k, 3.7% for AGIs $10k-25k, 3.8% for AGIs $25k-50k, 2.2% for AGIs $50k-75k, 3.8% for AGIs $75k-100k, 5.4% for AGIs over 100k)
IRA payment deduction: $2,412 (reported on 2.6% of returns)
17406:
$2,412
Pennsylvania:
$2,903
(% of AGI for various income ranges: 0.2% for AGIs $10k-25k, 0.2% for AGIs $25k-50k, 0.2% for AGIs $50k-75k, 0.2% for AGIs $75k-100k)
Self-employed pension: $10,167 (reported on 0.7% of returns)
Here:
$10,167
Pennsylvania:
$14,674
Total itemized deductions: $15,079 (20% of AGI, reported on 33.9% of returns)
Here:
$15,079
State:
$18,804
Here:
20.5% of AGI
State:
19.5% of AGI
(% of AGI for various income ranges: 10.6% for AGIs below $10k, 8.3% for AGIs $10k-25k, 10.0% for AGIs $25k-50k, 12.2% for AGIs $50k-75k, 12.8% for AGIs $75k-100k, 12.7% for AGIs over 100k)
Charity contributions deductions: $2,596 (3% of AGI, reported on 26.7% of returns)
Here:
$2,596
State:
$3,337
Here:
3.3% of AGI
State:
3.3% of AGI
(% of AGI for various income ranges: 0.3% for AGIs below $10k, 0.7% for AGIs $10k-25k, 1.1% for AGIs $25k-50k, 1.3% for AGIs $50k-75k, 1.7% for AGIs $75k-100k, 2.6% for AGIs over 100k)
Total tax: $5,986 (reported on 80.3% of returns)
17406:
$5,986
State:
$8,008
(% of AGI for various income ranges: 3.7% for AGIs below $10k, 4.3% for AGIs $10k-25k, 7.6% for AGIs $25k-50k, 8.9% for AGIs $50k-75k, 11.0% for AGIs $75k-100k, 18.7% for AGIs over 100k)
Earned income credit: $1,519 (reported on 10.2% of returns)
Here:
$1,519
State:
$1,643
Percentage of individuals using paid preparers for their 2004 taxes: 52.2%
Here:
52%
State:
56%
(% for various income ranges: 44.9% for AGIs below $10k, 52.6% for AGIs $10k-25k, 52.6% for AGIs $25k-50k, 52.5% for AGIs $50k-75k, 54.1% for AGIs $75k-100k, 65.8% for AGIs over 100k)
Likely homosexual households (counted as self-reported same-sex unmarried-partner households)
Lesbian couples: 0.5% of all households
Gay men: 0.0% of all households
Household received Food Stamps/SNAP in the past 12 months: 914 Household did not receive Food Stamps/SNAP in the past 12 months: 8,395
Women who had a birth in the past 12 months: 335 (269 now married, 71 unmarried) Women who did not have a birth in the past 12 months: 5,147 (2,383 now married, 2,753 unmarried)
Housing units in zip code 17406 with a mortgage: 4,560 (518 second mortgage, 468 both second mortgage and home equity loan) Houses without a mortgage: 462
Median monthly owner costs for units with a mortgage: $1,509 Median monthly owner costs for units without a mortgage: $641
Residents with income below the poverty level in 2022:
This zip code:
7.2%
Whole state:
11.8%
Residents with income below 50% of the poverty level in 2022:
This zip code:
5.4%
Whole state:
6.1%
Median number of rooms in houses and condos:
Here:
6.5
State:
6.8
Median number of rooms in apartments:
Here:
4.6
State:
4.3
Notable locations in this zip code not listed on our city pages
Notable locations in zip code 17406: Codorus Mills Station (A), Cann-Edi-On Camp (B), Margereta Furnace Farms (C), Valley View Park (D), Yorkana Community Fire Company Station 38 (E), York United Fire and Rescue Company Station 89 - 3 (F), Manchester Township Library (G), Martin Library at Bradley Academy in Springettsbury Township (H), Kreutz Creek Valley Library Center (I), Alert Fire Company 1 Station 24 (J), Hellam Fire Company Station 21 (K), Hallam Station (L). Display/hide their locations on the map
Churches in zip code 17406 include: Grace Church (A), Kreutz Creek Presbyterian Church (B), Mount Zion Lutheran Church (C), Hayshire United Church of Christ (D), Mount Zion United Church of Christ (E), Aughenbaugh Church (F), Druck Valley Church (G), Mount Pisgah Church (H), Fairmount Church (I). Display/hide their locations on the map
3,144 married couples with children.
1,312 single-parent households (280 men, 1,032 women).
95.1% of residents of 17406 zip code speak English at home.
1.7% of residents speak Spanish at home (92% very well, 7% well).
1.2% of residents speak other Indo-European language at home (62% very well, 25% well, 12% not well).
0.5% of residents speak Asian or Pacific Island language at home (41% very well, 27% well, 32% not well).
0.9% of residents speak other language at home (100% very well).
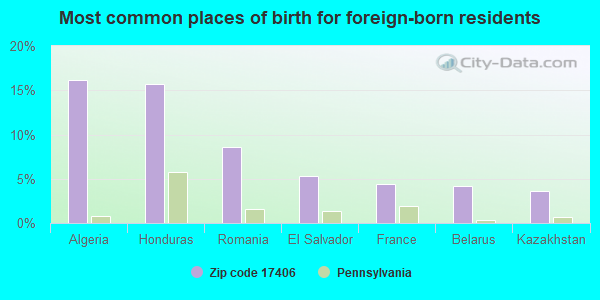
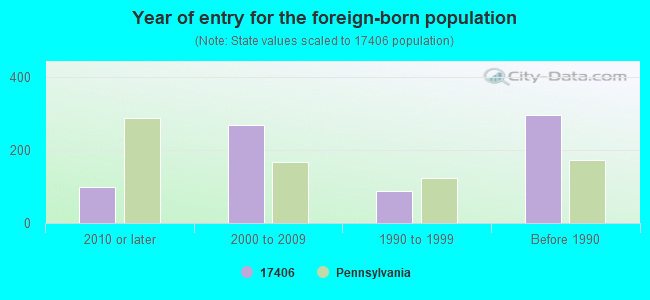
Foreign born population: 667 (2.8%) (73.2% of them are naturalized citizens)
Facilities with environmental interests located in this zip code:
ADVANCED RECYCLING SLUDGE DRYING PLT (340 SOUTH BROAD STREET - HELLMAN PLANT in HELLAM, PA)
AIR MINOR (AIRS/AFS) STATE MASTER (Pennsylvania database) - RCRIS-PAR000038901, HAZARDOUS WASTE PROGRAM Large Quantity Generators, more that 1000 kg of hazardous waste/month (Resource Conservation and Recovery Act (tracking hazardous waste)) - notification USED OIL PROGRAM (Resource Conservation and Recovery Act (tracking hazardous waste)) Business SIC classification: ELECTROMETALLURGICAL PRODUCTS, EXCEPT STEEL Organizations: ADVANCED RECYCLING TECHNOLOGY (CONTACT/OWNER)
, ADVANCED RECYCLING TECHNOLOGY INC (OWNER/OPERATOR)
Alternative names: ADVANCED RECYCLING T/HELLAM, ADVANCED RECYCLING TECHNOLOGY
AT & T LONG LINES EQUIP ENGR (2.5 MI N OF HALLAM in HALLAM, PA)
Housing units lacking complete plumbing facilities: 0.2% Housing units lacking complete kitchen facilities: 0.2%
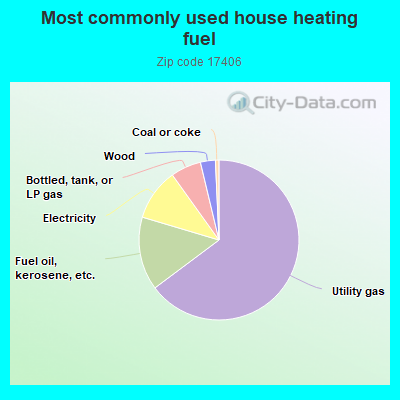
64.2%Utility gas
14.7%Fuel oil, kerosene, etc.
10.4%Electricity
6.1%Bottled, tank, or LP gas
3.0%Wood
0.7%Coal or coke
Population in 1990: 6,095. Population change in the 1990s: +137 (+2.2%).
Place of birth for U.S.-born residents:
This state: 17,833
Northeast: 1,358
Midwest: 622
South: 2,596
West: 355
66% of the 17406 zip code residents lived in the same house 5 years ago. Out of people who lived in different houses, 67% lived in this county. Out of people who lived in different counties, 50% lived in Pennsylvania.
92% of the 17406 zip code residents lived in the same house 1 year ago. Out of people who lived in different houses, 55% moved from this county. Out of people who lived in different houses, 34% moved from different county within same state. Out of people who lived in different houses, 9% moved from different state. Out of people who lived in different houses, 1% moved from abroad.
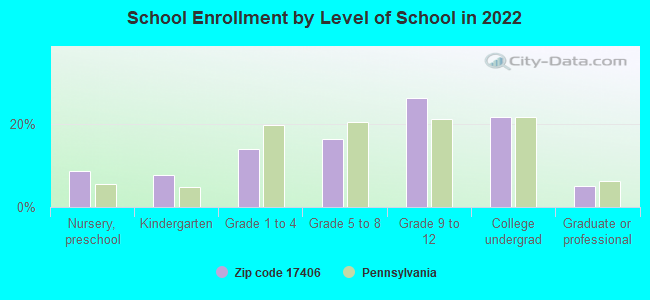
Private vs. public school enrollment:
Students in private schools in grades 1 to 8 (elementary and middle school): 211
Here:
14.2%
Pennsylvania:
15.7%
Students in private schools in grades 9 to 12 (high school): 123
Here:
9.6%
Pennsylvania:
13.4%
Students in private undergraduate colleges: 622
Here:
58.0%
Pennsylvania:
39.8%
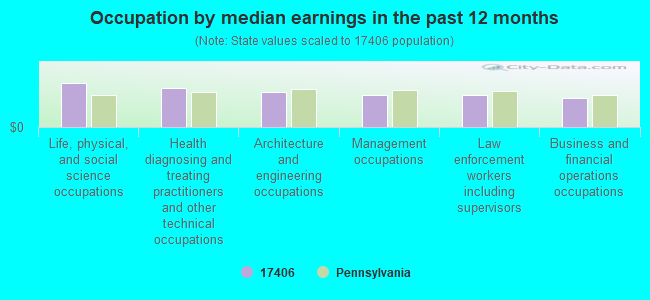
Occupation by median earnings in the past 12 months ($)
100,681Life, physical, and social science occupations
89,519Health diagnosing and treating practitioners and other technical occupations
79,611Architecture and engineering occupations
73,575Management occupations
72,198Law enforcement workers including supervisors
66,181Business and financial operations occupations
Companies with federal contracts located in this zip code:
PRE-MACH INC (4365 RUN WAY in YORK, PA; small business) : $2,151,039 in 22 contractsfrom 2002 to 2006
Contracts for Aircraft Launching Equipment, Hardware, Commercial, Bolts, Vehicular Cab, Body, and Frame Structural Components, and moreby Navy, Defense Logistics Agency, Army Signed by year:2000: $0; 2001: $0; 2002: $82,058; 2003: $59,057; 2004: $315,628; 2005: $1,685,354; 2006: $8,942.
Biggest contracts:
$1,450,377 with Navy for Aircraft Launching Equipment. Signed on 2005-08-26. Completion date: 2006-01-19.
$95,360 with Navy for Hardware, Commercial. Signed on 2005-02-02. Completion date: 2005-05-03.
$95,360 with Navy for Aircraft Launching Equipment. Signed on 2004-02-11. Completion date: 2004-06-09.
$90,667 with Navy for Bolts. Taking place in OH. Signed on 2004-01-31. Completion date: 2004-09-17.
DELTA PACKAGING INC (100 SHOE HOUSE RD in YORK, PA; small business) : $200,485 in 24 contractsfrom 2004 to 2005
Contracts for Boxes, Cartons, and Crates by Defense Logistics Agency Signed by year:2000: $0; 2001: $0; 2002: $0; 2003: $0; 2004: $121,269; 2005: $79,216; 2006: $0.
Biggest contracts:
$26,250 with Defense Logistics Agency for Boxes, Cartons, and Crates. Signed on 2004-09-29. Completion date: 2004-10-12.
$25,111, same as above.Signed on 2004-11-09. Completion date: 2004-11-29.
$20,621, same as above.Signed on 2004-10-21. Completion date: 2004-11-08.
$12,095, same as above.Signed on 2005-02-02. Completion date: 2005-02-10.
AKW SYSTEMS INC (268 W BEAVER ST in HELLAM, PA; small business)
$107,500 with Air Force for Maintenance, Repair or Alteration of Real Property -- Office Buildings. Signed on 2004-08-31. Completion date: 2004-07-24.
SHELLY MOVING & STORAGE (4451 LINCOLN HWY in YORK, PA; small business)
$7,500 with Army for Packing/Crating Services. Signed on 2004-12-13. Completion date: 2005-01-06.
Top industries in this zip code by the number of employees in 2005:
Construction: Highway, Street, and Bridge Construction (100-249 employees: 1 establishment)
Information: Radio Stations (50-99: 1, 10-19: 1)
Management of Companies and Enterprises: Corporate, Subsidiary, and Regional Managing Offices (50-99: 1)
Wholesale Trade: Metal Service Centers and Other Metal Merchant Wholesalers (50-99: 1)
Construction: Commercial and Institutional Building Construction (50-99: 1)
People in group quarters in 2010:
143 people in college/university student housing
15 people in group homes for juveniles (non-correctional)
9 people in group homes intended for adults
People in group quarters in 2000:
32 people in other noninstitutional group quarters
6 people in other nonhousehold living situations
Fatal accident statistics in 2014:
Fatal accident count: 2
Vehicles involved in fatal accidents: 3
Fatal accidents caused by drunken drivers: 0
Fatalities: 3
Persons involved in fatal accidents: 6
Pedestrians involved in fatal accidents: 1
Fatal accident statistics in 2013:
Fatal accident count: 1
Vehicles involved in fatal accidents: 2
Fatal accidents caused by drunken drivers: 0
Fatalities: 1
Persons involved in fatal accidents: 2
Pedestrians involved in fatal accidents: 0
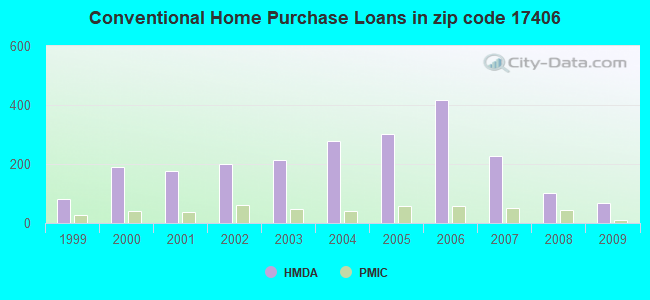
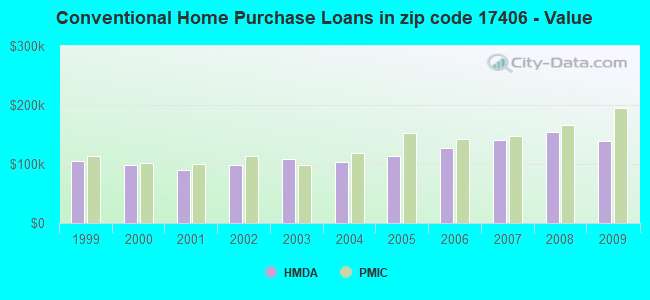
Home Mortgage Disclosure Act Aggregated Statistics For Year 2009 (Based on 6 partial tracts)
A) FHA, FSA/RHS & VA Home Purchase Loans
B) Conventional Home Purchase Loans
C) Refinancings
D) Home Improvement Loans
E) Loans on Dwellings For 5+ Families
F) Non-occupant Loans on < 5 Family Dwellings (A B C & D)
G) Loans On Manufactured Home Dwelling (A B C & D)
Number
Average Value
Number
Average Value
Number
Average Value
Number
Average Value
Number
Average Value
Number
Average Value
Number
Average Value
LOANS ORIGINATED
75
$144,407
68
$138,481
363
$146,665
58
$42,636
1
$230,520
13
$103,348
8
$55,112
APPLICATIONS APPROVED, NOT ACCEPTED
6
$135,415
4
$144,982
27
$175,690
5
$40,936
0
$0
0
$0
1
$69,490
APPLICATIONS DENIED
12
$139,039
19
$83,602
124
$163,856
32
$43,262
1
$286,660
8
$58,995
13
$38,896
APPLICATIONS WITHDRAWN
2
$120,540
6
$123,265
87
$153,590
4
$40,860
1
$286,660
2
$86,595
1
$74,300
FILES CLOSED FOR INCOMPLETENESS
2
$124,215
2
$123,435
27
$152,103
5
$130,520
0
$0
1
$86,000
1
$88,100
Aggregated Statistics For Year 2008 (Based on 6 partial tracts)
A) FHA, FSA/RHS & VA Home Purchase Loans
B) Conventional Home Purchase Loans
C) Refinancings
D) Home Improvement Loans
E) Loans on Dwellings For 5+ Families
F) Non-occupant Loans on < 5 Family Dwellings (A B C & D)
G) Loans On Manufactured Home Dwelling (A B C & D)
Number
Average Value
Number
Average Value
Number
Average Value
Number
Average Value
Number
Average Value
Number
Average Value
Number
Average Value
LOANS ORIGINATED
48
$144,026
101
$154,567
253
$130,112
90
$35,924
1
$29,860
18
$133,170
12
$49,219
APPLICATIONS APPROVED, NOT ACCEPTED
2
$120,485
13
$176,923
40
$123,342
11
$27,825
0
$0
2
$65,500
4
$38,345
APPLICATIONS DENIED
11
$176,647
15
$86,115
210
$149,721
55
$42,535
1
$280,680
13
$96,176
10
$40,495
APPLICATIONS WITHDRAWN
5
$112,584
5
$138,878
78
$156,325
6
$70,822
0
$0
0
$0
3
$40,617
FILES CLOSED FOR INCOMPLETENESS
2
$99,840
1
$55,040
17
$153,467
2
$49,085
0
$0
0
$0
1
$45,750
Aggregated Statistics For Year 2007 (Based on 6 partial tracts)
A) FHA, FSA/RHS & VA Home Purchase Loans
B) Conventional Home Purchase Loans
C) Refinancings
D) Home Improvement Loans
E) Loans on Dwellings For 5+ Families
F) Non-occupant Loans on < 5 Family Dwellings (A B C & D)
G) Loans On Manufactured Home Dwelling (A B C & D)
Number
Average Value
Number
Average Value
Number
Average Value
Number
Average Value
Number
Average Value
Number
Average Value
Number
Average Value
LOANS ORIGINATED
48
$148,134
226
$140,706
302
$117,176
107
$44,465
2
$3,217,455
28
$129,596
14
$60,816
APPLICATIONS APPROVED, NOT ACCEPTED
0
$0
21
$128,698
53
$138,226
12
$64,482
0
$0
5
$141,718
4
$82,700
APPLICATIONS DENIED
4
$158,178
48
$117,882
239
$128,543
57
$49,029
0
$0
7
$109,487
18
$34,117
APPLICATIONS WITHDRAWN
3
$170,263
22
$118,515
91
$134,547
12
$47,434
0
$0
5
$88,058
0
$0
FILES CLOSED FOR INCOMPLETENESS
0
$0
9
$150,958
21
$132,718
1
$38,300
0
$0
0
$0
0
$0
Aggregated Statistics For Year 2006 (Based on 6 partial tracts)
A) FHA, FSA/RHS & VA Home Purchase Loans
B) Conventional Home Purchase Loans
C) Refinancings
D) Home Improvement Loans
E) Loans on Dwellings For 5+ Families
F) Non-occupant Loans on < 5 Family Dwellings (A B C & D)
G) Loans On Manufactured Home Dwelling (A B C & D)
Number
Average Value
Number
Average Value
Number
Average Value
Number
Average Value
Number
Average Value
Number
Average Value
Number
Average Value
LOANS ORIGINATED
51
$148,264
416
$126,311
368
$106,124
106
$40,806
3
$3,396,123
34
$151,030
17
$44,652
APPLICATIONS APPROVED, NOT ACCEPTED
3
$175,680
41
$90,527
62
$101,896
15
$56,169
0
$0
4
$123,182
6
$42,992
APPLICATIONS DENIED
11
$153,972
100
$105,984
249
$109,475
65
$40,119
0
$0
15
$54,079
10
$54,556
APPLICATIONS WITHDRAWN
8
$143,196
56
$115,079
143
$122,336
6
$62,395
0
$0
2
$179,900
1
$105,970
FILES CLOSED FOR INCOMPLETENESS
0
$0
7
$108,964
27
$122,731
1
$175,440
0
$0
0
$0
0
$0
Aggregated Statistics For Year 2005 (Based on 6 partial tracts)
A) FHA, FSA/RHS & VA Home Purchase Loans
B) Conventional Home Purchase Loans
C) Refinancings
D) Home Improvement Loans
E) Loans on Dwellings For 5+ Families
F) Non-occupant Loans on < 5 Family Dwellings (A B C & D)
G) Loans On Manufactured Home Dwelling (A B C & D)
Number
Average Value
Number
Average Value
Number
Average Value
Number
Average Value
Number
Average Value
Number
Average Value
Number
Average Value
LOANS ORIGINATED
31
$115,470
303
$114,239
383
$102,355
80
$44,396
4
$6,466,035
44
$124,581
17
$74,592
APPLICATIONS APPROVED, NOT ACCEPTED
2
$149,830
28
$115,224
55
$117,960
10
$59,975
0
$0
5
$238,380
1
$77,400
APPLICATIONS DENIED
3
$118,277
69
$81,807
248
$108,856
55
$60,806
0
$0
9
$94,058
27
$44,262
APPLICATIONS WITHDRAWN
4
$173,038
27
$104,151
184
$123,465
24
$108,338
0
$0
9
$60,299
2
$57,880
FILES CLOSED FOR INCOMPLETENESS
0
$0
6
$142,610
33
$137,520
1
$13,420
0
$0
0
$0
0
$0
Aggregated Statistics For Year 2004 (Based on 6 partial tracts)
A) FHA, FSA/RHS & VA Home Purchase Loans
B) Conventional Home Purchase Loans
C) Refinancings
D) Home Improvement Loans
F) Non-occupant Loans on < 5 Family Dwellings (A B C & D)
G) Loans On Manufactured Home Dwelling (A B C & D)
Number
Average Value
Number
Average Value
Number
Average Value
Number
Average Value
Number
Average Value
Number
Average Value
LOANS ORIGINATED
57
$109,421
277
$103,536
395
$99,961
84
$46,034
35
$81,770
20
$63,886
APPLICATIONS APPROVED, NOT ACCEPTED
1
$146,540
29
$95,292
81
$96,700
9
$23,758
2
$106,130
5
$54,746
APPLICATIONS DENIED
5
$100,152
35
$82,373
254
$111,318
45
$32,284
11
$84,772
19
$48,881
APPLICATIONS WITHDRAWN
1
$131,410
15
$147,871
138
$105,679
21
$31,263
8
$87,138
3
$34,730
FILES CLOSED FOR INCOMPLETENESS
0
$0
3
$158,527
52
$112,223
3
$23,667
1
$89,580
0
$0
Aggregated Statistics For Year 2003 (Based on 6 partial tracts)
A) FHA, FSA/RHS & VA Home Purchase Loans
B) Conventional Home Purchase Loans
C) Refinancings
D) Home Improvement Loans
E) Loans on Dwellings For 5+ Families
F) Non-occupant Loans on < 5 Family Dwellings (A B C & D)
Number
Average Value
Number
Average Value
Number
Average Value
Number
Average Value
Number
Average Value
Number
Average Value
LOANS ORIGINATED
59
$91,052
214
$107,757
772
$102,624
75
$25,790
0
$0
40
$100,122
APPLICATIONS APPROVED, NOT ACCEPTED
3
$93,727
20
$65,147
117
$98,791
11
$23,569
0
$0
10
$59,040
APPLICATIONS DENIED
10
$74,002
29
$93,452
238
$104,899
36
$20,044
1
$237,690
13
$83,205
APPLICATIONS WITHDRAWN
2
$67,875
16
$112,853
121
$103,572
12
$22,808
0
$0
5
$76,864
FILES CLOSED FOR INCOMPLETENESS
2
$82,190
1
$41,280
22
$103,868
1
$50,160
0
$0
0
$0
Aggregated Statistics For Year 2002 (Based on 6 partial tracts)
A) FHA, FSA/RHS & VA Home Purchase Loans
B) Conventional Home Purchase Loans
C) Refinancings
D) Home Improvement Loans
E) Loans on Dwellings For 5+ Families
F) Non-occupant Loans on < 5 Family Dwellings (A B C & D)
Number
Average Value
Number
Average Value
Number
Average Value
Number
Average Value
Number
Average Value
Number
Average Value
LOANS ORIGINATED
56
$94,380
201
$98,357
510
$97,060
88
$21,128
3
$76,877
34
$68,816
APPLICATIONS APPROVED, NOT ACCEPTED
4
$85,345
20
$84,608
86
$91,711
16
$30,038
0
$0
4
$62,445
APPLICATIONS DENIED
6
$90,507
37
$48,738
183
$82,404
22
$12,265
0
$0
5
$64,166
APPLICATIONS WITHDRAWN
5
$74,308
9
$146,791
103
$96,356
11
$29,377
0
$0
1
$48,970
FILES CLOSED FOR INCOMPLETENESS
0
$0
2
$85,465
24
$104,447
0
$0
0
$0
0
$0
Aggregated Statistics For Year 2001 (Based on 6 partial tracts)
A) FHA, FSA/RHS & VA Home Purchase Loans
B) Conventional Home Purchase Loans
C) Refinancings
D) Home Improvement Loans
E) Loans on Dwellings For 5+ Families
F) Non-occupant Loans on < 5 Family Dwellings (A B C & D)
Number
Average Value
Number
Average Value
Number
Average Value
Number
Average Value
Number
Average Value
Number
Average Value
LOANS ORIGINATED
57
$96,028
177
$89,073
395
$90,754
72
$17,801
1
$10,869,040
25
$70,534
APPLICATIONS APPROVED, NOT ACCEPTED
5
$83,576
27
$38,643
50
$78,537
12
$21,617
0
$0
3
$21,977
APPLICATIONS DENIED
4
$92,205
51
$59,457
172
$74,329
34
$13,599
0
$0
3
$107,110
APPLICATIONS WITHDRAWN
5
$89,580
13
$87,090
80
$93,739
12
$13,259
0
$0
6
$141,503
FILES CLOSED FOR INCOMPLETENESS
2
$79,670
2
$35,190
16
$102,024
3
$8,513
0
$0
0
$0
Aggregated Statistics For Year 2000 (Based on 6 partial tracts)
A) FHA, FSA/RHS & VA Home Purchase Loans
B) Conventional Home Purchase Loans
C) Refinancings
D) Home Improvement Loans
E) Loans on Dwellings For 5+ Families
F) Non-occupant Loans on < 5 Family Dwellings (A B C & D)
Number
Average Value
Number
Average Value
Number
Average Value
Number
Average Value
Number
Average Value
Number
Average Value
LOANS ORIGINATED
69
$90,372
191
$98,603
130
$68,037
97
$18,848
1
$95,760
17
$98,934
APPLICATIONS APPROVED, NOT ACCEPTED
3
$73,850
14
$61,112
49
$60,633
21
$28,337
0
$0
0
$0
APPLICATIONS DENIED
4
$98,842
46
$49,338
133
$70,101
36
$20,199
0
$0
1
$26,490
APPLICATIONS WITHDRAWN
0
$0
16
$85,196
70
$64,127
6
$51,087
0
$0
4
$56,425
FILES CLOSED FOR INCOMPLETENESS
0
$0
1
$63,840
18
$100,906
0
$0
0
$0
0
$0
Aggregated Statistics For Year 1999 (Based on 3 partial tracts)
A) FHA, FSA/RHS & VA Home Purchase Loans
B) Conventional Home Purchase Loans
C) Refinancings
D) Home Improvement Loans
E) Loans on Dwellings For 5+ Families
F) Non-occupant Loans on < 5 Family Dwellings (A B C & D)
2002 - 2018 National Fire Incident Reporting System (NFIRS) incidents
According to the data from the years 2002 - 2018 the average number of fire incidents per year is 67. The highest number of reported fire incidents - 123 took place in 2010, and the least - 13 in 2002. The data has an increasing trend.
When looking into fire subcategories, the most reports belonged to: Structure Fires (51.3%), and Outside Fires (28.7%).
Fire incident types reported to NFIRS in Zip Code 17406


 Nearest zip codes: 17402, 17347, 17547, 17318, 17550, 17502.


 According to the data from the years 2002 - 2018 the average number of fire incidents per year is 67. The highest number of reported fire incidents - 123 took place in 2010, and the least - 13 in 2002. The data has an increasing trend.
 When looking into fire subcategories, the most reports belonged to: Structure Fires (51.3%), and Outside Fires (28.7%).