Estimated zip code population in 2022: 12,821 Zip code population in 2010: 13,853 Zip code population in 2000: 12,113
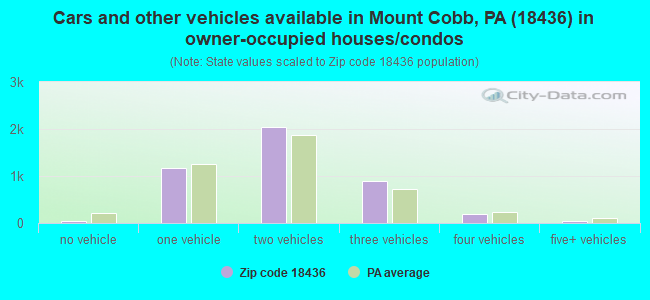
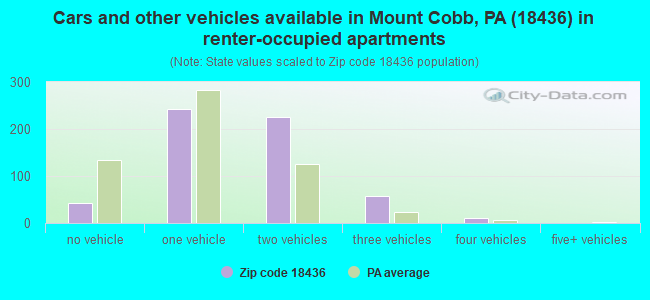
Houses and condos: 9,751 Renter-occupied apartments: 576
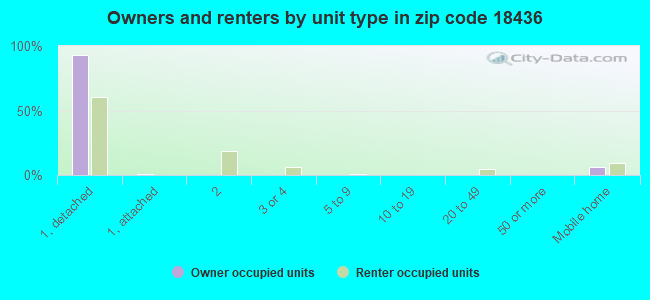
% of renters here:
12%
State:
31%
March 2022 cost of living index in zip code 18436: 92.2 (less than average, U.S. average is 100)
Land area: 90.9 sq. mi. Water area: 3.6 sq. mi.
Population density: 141 people per square mile
(very low).
OSM Map
General Map
Google Map
MSN Map
OSM Map
General Map
Google Map
MSN Map
OSM Map
General Map
Google Map
MSN Map
OSM Map
General Map
Google Map
MSN Map
Please wait while loading the map...
Real estate property taxes paid for housing units in 2022:
This zip code:
1.3% ($2,882)
Pennsylvania:
1.3% ($3,094)
Median real estate property taxes paid for housing units with mortgages in 2022: $3,046 (1.2%) Median real estate property taxes paid for housing units with no mortgage in 2022: $2,747 (1.4%)
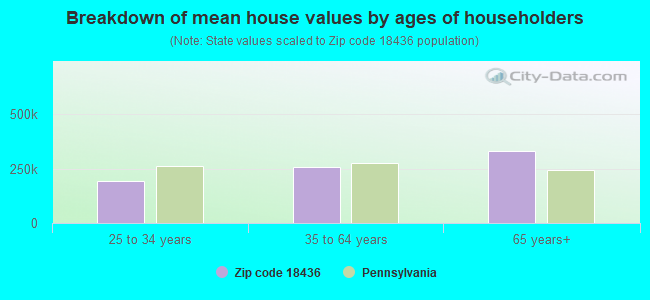
Estimated median house/condo value in 2022: $228,895
18436:
$228,895
Pennsylvania:
$245,500
According to our research of Pennsylvania and other state lists, there were 13 registered sex offenders living in 18436 zip code as of April 20, 2024. The ratio of all residents to sex offenders in zip code 18436 is 1,012 to 1. The ratio of registered sex offenders to all residents in this zip code is lower than the state average.
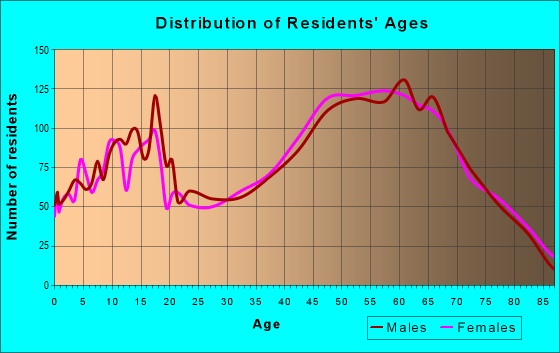
Median resident age:
This zip code:
50.6 years
Pennsylvania median age:
40.9 years
Average household size:
This zip code:
2.5 people
Pennsylvania:
2.4 people
Averages for the 2020 tax year for zip code 18436, filed in 2021:
Average Adjusted Gross Income (AGI) in 2020: $70,939 (Individual Income Tax Returns)
Here:
$70,939
State:
$75,707
Salary/wage: $56,806 (reported on 73.7% of returns)
Here:
$56,806
State:
$62,806
(% of AGI for various income ranges: 1037.0% for AGIs below $25k, 3241.1% for AGIs $25k-50k, 5703.1% for AGIs $50k-75k, 7479.6% for AGIs $75k-100k, 15486.4% for AGIs $100k-200k, 54049.1% for AGIs over 200k)
Taxable interest for individuals: $1,520 (reported on 35.4% of returns)
This zip code:
$1,520
Pennsylvania:
$1,633
(% of AGI for various income ranges: 32.3% for AGIs below $25k, 35.5% for AGIs $25k-50k, 66.8% for AGIs $50k-75k, 102.7% for AGIs $75k-100k, 130.5% for AGIs $100k-200k, 930.9% for AGIs over 200k)
Ordinary dividends: $4,755 (reported on 24.9% of returns)
Here:
$4,755
State:
$7,382
(% of AGI for various income ranges: 44.6% for AGIs below $25k, 58.8% for AGIs $25k-50k, 126.8% for AGIs $50k-75k, 169.2% for AGIs $75k-100k, 337.7% for AGIs $100k-200k, 2660.9% for AGIs over 200k)
Net capital gain/loss in AGI: +$11,507 (reported on 19.5% of returns)
Here:
+$11,507
State:
+$23,522
(% of AGI for various income ranges: 3.7% for AGIs below $25k, 41.0% for AGIs $25k-50k, 89.6% for AGIs $50k-75k, 203.3% for AGIs $75k-100k, 541.3% for AGIs $100k-200k, 8804.5% for AGIs over 200k)
Profit/loss from business: +$15,071 (reported on 14.1% of returns)
Here:
+$15,071
State:
+$16,274
(% of AGI for various income ranges: 140.8% for AGIs below $25k, 248.6% for AGIs $25k-50k, 319.0% for AGIs $50k-75k, 281.2% for AGIs $75k-100k, 709.0% for AGIs $100k-200k, 1541.8% for AGIs over 200k)
Taxable individual retirement arrangement distribution: $17,997 (reported on 13.9% of returns)
18436:
$17,997
Pennsylvania:
$18,583
(% of AGI for various income ranges: 125.1% for AGIs below $25k, 176.3% for AGIs $25k-50k, 331.4% for AGIs $50k-75k, 465.0% for AGIs $75k-100k, 839.0% for AGIs $100k-200k, 3156.4% for AGIs over 200k)
Self-employed (Keogh) retirement plans: $16,000 (reported on 0.4% of returns)
18436:
$16,000
Pennsylvania:
$25,407
(% of AGI for various income ranges: 78.7% for AGIs $100k-200k)
Total itemized deductions: $27,028 (reported on 6.4% of returns)
Here:
$27,028
State:
$34,850
(% of AGI for various income ranges: 108.8% for AGIs $25k-50k, 261.4% for AGIs $50k-75k, 384.2% for AGIs $75k-100k, 563.4% for AGIs $100k-200k, 2820.0% for AGIs over 200k)
Charity contributions: $5,771 (reported on 5.0% of returns)
Here:
$5,771
State:
$12,392
(% of AGI for various income ranges: 10.9% for AGIs $25k-50k, 23.5% for AGIs $50k-75k, 50.2% for AGIs $75k-100k, 78.2% for AGIs $100k-200k, 849.1% for AGIs over 200k)
Taxes paid: $7,933 (reported on 6.4% of returns)
18436:
$7,933
State:
$8,200
(% of AGI for various income ranges: 28.2% for AGIs $25k-50k, 56.9% for AGIs $50k-75k, 120.6% for AGIs $75k-100k, 187.5% for AGIs $100k-200k, 833.6% for AGIs over 200k)
Earned income credit: $2,003 (reported on 10.9% of returns)
Here:
$2,003
State:
$2,100
(% of AGI for various income ranges: 66.9% for AGIs below $25k, 57.2% for AGIs $25k-50k)
Percentage of individuals using paid preparers for their 2020 taxes: 92.2%
Here:
92%
State:
92%
(% for various income ranges: 91.6% for AGIs below $25k, 92.9% for AGIs $25k-50k, 91.5% for AGIs $50k-75k, 92.1% for AGIs $75k-100k, 91.7% for AGIs $100k-200k, 96.6% for AGIs over 200k)
Averages for the 2012 tax year for zip code 18436, filed in 2013:
Average Adjusted Gross Income (AGI) in 2012: $53,431 (Individual Income Tax Returns)
Here:
$53,431
State:
$61,346
Salary/wage: $43,641 (reported on 76.5% of returns)
Here:
$43,641
State:
$51,902
(% of AGI for various income ranges: 64.4% for AGIs below $25k, 67.4% for AGIs $25k-50k, 66.6% for AGIs $50k-75k, 63.8% for AGIs $75k-100k, 67.1% for AGIs $100k-200k, 43.2% for AGIs over 200k)
Taxable interest for individuals: $1,359 (reported on 37.3% of returns)
This zip code:
$1,359
Pennsylvania:
$1,588
(% of AGI for various income ranges: 2.1% for AGIs below $25k, 0.8% for AGIs $25k-50k, 0.8% for AGIs $50k-75k, 1.0% for AGIs $75k-100k, 0.7% for AGIs $100k-200k, 1.0% for AGIs over 200k)
Ordinary dividends: $3,467 (reported on 25.6% of returns)
Here:
$3,467
State:
$5,827
(% of AGI for various income ranges: 2.0% for AGIs below $25k, 1.3% for AGIs $25k-50k, 1.0% for AGIs $50k-75k, 1.5% for AGIs $75k-100k, 1.5% for AGIs $100k-200k, 3.1% for AGIs over 200k)
Net capital gain/loss in AGI: +$3,705 (reported on 16.0% of returns)
Here:
+$3,705
State:
+$14,495
(% of AGI for various income ranges: 0.5% for AGIs $25k-50k, 0.5% for AGIs $50k-75k, 0.5% for AGIs $75k-100k, 0.7% for AGIs $100k-200k, 4.3% for AGIs over 200k)
Profit/loss from business: +$14,370 (reported on 14.4% of returns)
Here:
+$14,370
State:
+$16,268
(% of AGI for various income ranges: 7.6% for AGIs below $25k, 5.2% for AGIs $25k-50k, 3.1% for AGIs $50k-75k, 2.1% for AGIs $75k-100k, 2.4% for AGIs $100k-200k, 5.5% for AGIs over 200k)
Taxable individual retirement arrangement distribution: $15,000 (reported on 14.4% of returns)
18436:
$15,000
Pennsylvania:
$14,550
(% of AGI for various income ranges: 5.0% for AGIs below $25k, 3.9% for AGIs $25k-50k, 3.3% for AGIs $50k-75k, 4.2% for AGIs $75k-100k, 4.3% for AGIs $100k-200k, 3.8% for AGIs over 200k)
Self-employment retirement plans: $13,900 (reported on 0.5% of returns)
18436:
$13,900
Pennsylvania:
$20,922
Total itemized deductions: $19,941 (21% of AGI, reported on 31.1% of returns)
Here:
$19,941
State:
$23,538
Here:
20.6% of AGI
State:
18.4% of AGI
(% of AGI for various income ranges: 10.7% for AGIs below $25k, 10.9% for AGIs $25k-50k, 10.8% for AGIs $50k-75k, 12.5% for AGIs $75k-100k, 12.9% for AGIs $100k-200k, 10.8% for AGIs over 200k)
Charity contributions: $2,390 (reported on 24.0% of returns)
Here:
$2,390
State:
$4,025
(% of AGI for various income ranges: 0.6% for AGIs below $25k, 0.8% for AGIs $25k-50k, 0.9% for AGIs $50k-75k, 1.3% for AGIs $75k-100k, 1.3% for AGIs $100k-200k, 1.2% for AGIs over 200k)
Taxes paid: $7,662 (reported on 31.0% of returns)
18436:
$7,662
State:
$9,982
(% of AGI for various income ranges: 2.8% for AGIs below $25k, 3.2% for AGIs $25k-50k, 3.7% for AGIs $50k-75k, 4.7% for AGIs $75k-100k, 5.6% for AGIs $100k-200k, 5.2% for AGIs over 200k)
Earned income credit: $2,056 (reported on 14.0% of returns)
Here:
$2,056
State:
$2,106
(% of AGI for various income ranges: 4.6% for AGIs below $25k, 1.0% for AGIs $25k-50k)
Percentage of individuals using paid preparers for their 2012 taxes: 58.2%
Here:
58%
State:
53%
(% for various income ranges: 50.8% for AGIs below $25k, 58.5% for AGIs $25k-50k, 60.8% for AGIs $50k-75k, 65.6% for AGIs $75k-100k, 69.2% for AGIs $100k-200k, 83.3% for AGIs over 200k)
Averages for the 2004 tax year for zip code 18436, filed in 2005:
Average Adjusted Gross Income (AGI) in 2004: $41,965 (Individual Income Tax Returns)
Here:
$41,965
State:
$48,049
Salary/wage: $36,521 (reported on 79.2% of returns)
Here:
$36,521
State:
$42,646
(% of AGI for various income ranges: 87.0% for AGIs below $10k, 66.2% for AGIs $10k-25k, 70.6% for AGIs $25k-50k, 72.1% for AGIs $50k-75k, 72.2% for AGIs $75k-100k, 62.4% for AGIs over 100k)
Taxable interest for individuals: $1,311 (reported on 53.0% of returns)
This zip code:
$1,311
Pennsylvania:
$1,657
(% of AGI for various income ranges: 8.3% for AGIs below $10k, 2.8% for AGIs $10k-25k, 1.4% for AGIs $25k-50k, 1.5% for AGIs $50k-75k, 1.2% for AGIs $75k-100k, 1.4% for AGIs over 100k)
Taxable dividends: $2,452 (reported on 30.1% of returns)
Here:
$2,452
State:
$3,566
(% of AGI for various income ranges: 6.1% for AGIs below $10k, 1.7% for AGIs $10k-25k, 1.2% for AGIs $25k-50k, 1.6% for AGIs $50k-75k, 1.1% for AGIs $75k-100k, 2.5% for AGIs over 100k)
Net capital gain/loss: +$6,394 (reported on 22.6% of returns)
Here:
+$6,394
State:
+$9,716
(% of AGI for various income ranges: -2.6% for AGIs below $10k, 0.1% for AGIs $10k-25k, 0.9% for AGIs $25k-50k, 0.8% for AGIs $50k-75k, 2.0% for AGIs $75k-100k, 10.3% for AGIs over 100k)
Profit/loss from business: +$13,384 (reported on 16.4% of returns)
Here:
+$13,384
State:
+$14,267
(% of AGI for various income ranges: 4.2% for AGIs below $10k, 8.9% for AGIs $10k-25k, 5.8% for AGIs $25k-50k, 4.7% for AGIs $50k-75k, 4.1% for AGIs $75k-100k, 4.7% for AGIs over 100k)
IRA payment deduction: $3,198 (reported on 3.4% of returns)
18436:
$3,198
Pennsylvania:
$2,903
(% of AGI for various income ranges: 0.4% for AGIs $10k-25k, 0.4% for AGIs $25k-50k, 0.3% for AGIs $50k-75k, 0.2% for AGIs $75k-100k, 0.1% for AGIs over 100k)
Self-employed pension: $8,629 (reported on 0.6% of returns)
Here:
$8,629
Pennsylvania:
$14,674
Total itemized deductions: $16,315 (22% of AGI, reported on 30.2% of returns)
Here:
$16,315
State:
$18,804
Here:
21.8% of AGI
State:
19.5% of AGI
(% of AGI for various income ranges: 12.5% for AGIs below $10k, 9.8% for AGIs $10k-25k, 10.9% for AGIs $25k-50k, 11.8% for AGIs $50k-75k, 13.5% for AGIs $75k-100k, 11.8% for AGIs over 100k)
Charity contributions deductions: $2,247 (3% of AGI, reported on 26.6% of returns)
Here:
$2,247
State:
$3,337
Here:
2.9% of AGI
State:
3.3% of AGI
(% of AGI for various income ranges: 0.6% for AGIs below $10k, 0.7% for AGIs $10k-25k, 1.1% for AGIs $25k-50k, 1.4% for AGIs $50k-75k, 1.6% for AGIs $75k-100k, 1.9% for AGIs over 100k)
Total tax: $5,918 (reported on 75.2% of returns)
18436:
$5,918
State:
$8,008
(% of AGI for various income ranges: 2.8% for AGIs below $10k, 4.5% for AGIs $10k-25k, 6.8% for AGIs $25k-50k, 9.1% for AGIs $50k-75k, 10.8% for AGIs $75k-100k, 17.6% for AGIs over 100k)
Earned income credit: $1,574 (reported on 12.4% of returns)
Here:
$1,574
State:
$1,643
Percentage of individuals using paid preparers for their 2004 taxes: 59.2%
Here:
59%
State:
56%
(% for various income ranges: 50.7% for AGIs below $10k, 57.5% for AGIs $10k-25k, 59.2% for AGIs $25k-50k, 64.4% for AGIs $50k-75k, 65.9% for AGIs $75k-100k, 70.6% for AGIs over 100k)
Household received Food Stamps/SNAP in the past 12 months: 626 Household did not receive Food Stamps/SNAP in the past 12 months: 4,343
Women who had a birth in the past 12 months: 63 (67 now married, 0 unmarried) Women who did not have a birth in the past 12 months: 2,295 (813 now married, 1,485 unmarried)
Housing units in zip code 18436 with a mortgage: 1,985 (242 second mortgage, 226 both second mortgage and home equity loan) Houses without a mortgage: 115
Median monthly owner costs for units with a mortgage: $1,496 Median monthly owner costs for units without a mortgage: $636
Residents with income below the poverty level in 2022:
This zip code:
8.1%
Whole state:
11.8%
Residents with income below 50% of the poverty level in 2022:
This zip code:
5.7%
Whole state:
6.1%
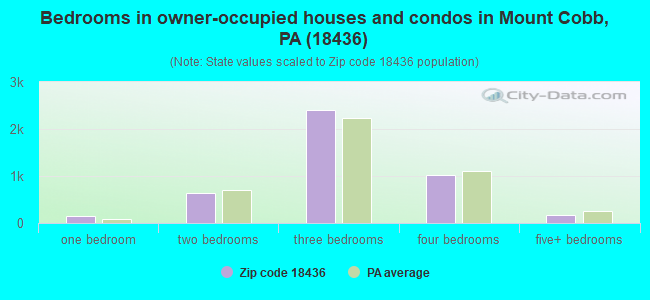
Median number of rooms in houses and condos:
Here:
6.4
State:
6.8
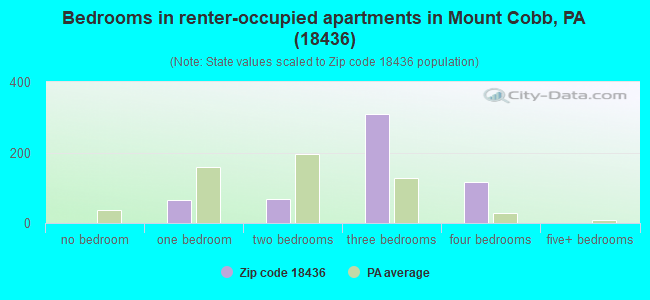
Median number of rooms in apartments:
Here:
5.9
State:
4.3
Notable locations in this zip code not listed on our city pages
Notable locations in zip code 18436: Five Mile Point (A), Jefferson Heights (B), Manning Junction (C), Ledgedale Volunteer Hose Company Station 36 (D), Wayne House (E), Maplewood Fire and Rescue Company Station 68 (F), Jefferson Township Volunteer Fire Company (G), Lake Ariel Volunteer Fire Company Station 1 (H). Display/hide their locations on the map
Lakes, reservoirs, and swamps: Big Spring Pond (A), Lake Ariel (B), Kuehners Pond (C), Hidden Lake (D), Marsh Pond (E), Cobb Pond (F), Goose Pond (G), Butler Pond (H). Display/hide their locations on the map
Creeks: Moss Hollow Creek (A), Uban Creek (B), West Branch Wallenpaupack Creek (C), Butternut Creek (D), Ariel Creek (E). Display/hide their locations on the map
Tourist attraction (not listed on the city page) : Claws 'n' Paws Wild Animal Park (Cultural Attractions- Events- & Facilities; Ledgedale Road) (1). Display/hide its approximate location on the map
In group quarters: 136 (-1 institutionalized population)
Size of family households: 2,063 2-persons, 663 3-persons, 426 4-persons, 290 5-persons, 46 6-persons, 100 7-or-more-persons
Size of nonfamily households: 1,134 1-person, 181 2-persons, 64 4-persons
1,131 married couples with children.
515 single-parent households (129 men, 386 women).
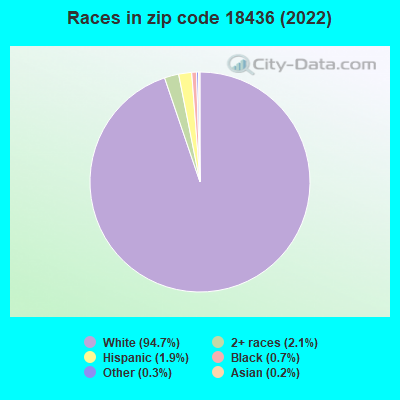
94.6% of residents of 18436 zip code speak English at home.
0.7% of residents speak Spanish at home (67% very well, 33% not well).
4.2% of residents speak other Indo-European language at home (70% very well, 29% well, 1% not well).
0.3% of residents speak Asian or Pacific Island language at home (94% very well, 6% well).
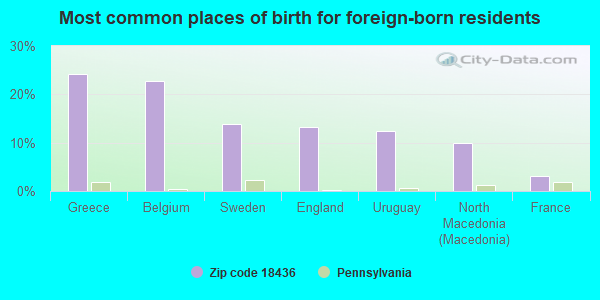
Foreign born population: 501 (3.9%) (57.9% of them are naturalized citizens)
This zip code:
3.9%
Whole state:
7.5%
24%Greece
23%Belgium
14%Sweden
13%England
12%Uruguay
10%North Macedonia (Macedonia)
3%France
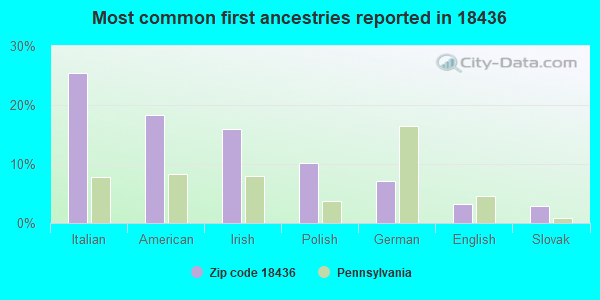
25%Italian
18%American
16%Irish
10%Polish
7%German
3%English
3%Slovak
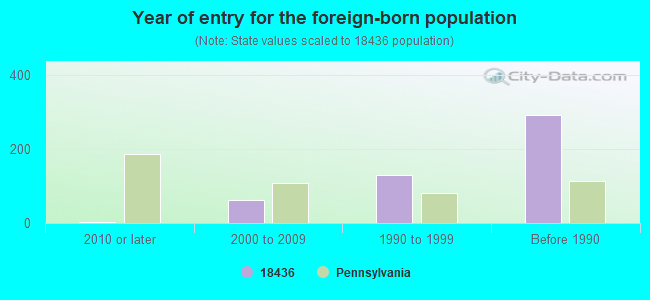
Year of entry for the foreign-born population
42010 or later
632000 to 2009
1301990 to 1999
291Before 1990
Facilities with environmental interests located in this zip code:
BELLE AIRE WATER SYS (1184 FERNWOOD RD in LAKE ARIEL, PA)
(Integrated Compliance Information System) - ICIS-03-2001-0036, FORMAL ENFORCEMENT ACTION Business SIC classification: WATER SUPPLY
Housing units lacking complete plumbing facilities: 0.8% Housing units lacking complete kitchen facilities: 0.7%
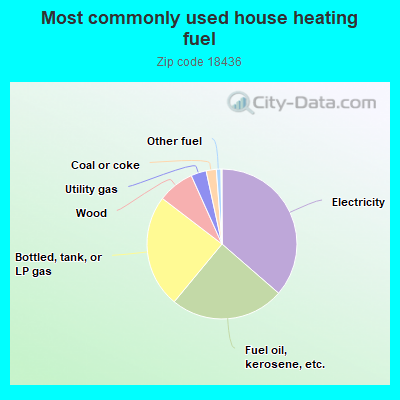
36.4%Electricity
24.6%Fuel oil, kerosene, etc.
24.4%Bottled, tank, or LP gas
7.9%Wood
3.3%Utility gas
2.2%Coal or coke
1.0%Other fuel
Population in 1990: 7,939. Population change in the 1990s: +4,174 (+52.6%).
Place of birth for U.S.-born residents:
This state: 8,094
Northeast: 3,611
Midwest: 200
South: 340
West: 65
69% of the 18436 zip code residents lived in the same house 5 years ago. Out of people who lived in different houses, 37% lived in this county. Out of people who lived in different counties, 50% lived in Pennsylvania.
94% of the 18436 zip code residents lived in the same house 1 year ago. Out of people who lived in different houses, 21% moved from this county. Out of people who lived in different houses, 48% moved from different county within same state. Out of people who lived in different houses, 30% moved from different state. Out of people who lived in different houses, 3% moved from abroad.
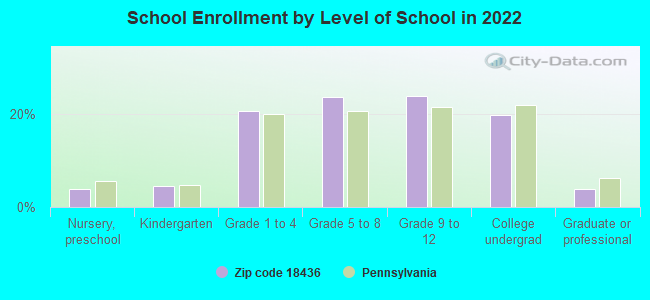
Private vs. public school enrollment:
Students in private schools in grades 1 to 8 (elementary and middle school): 85
Here:
9.4%
Pennsylvania:
15.7%
Students in private schools in grades 9 to 12 (high school): 27
Here:
5.5%
Pennsylvania:
13.4%
Students in private undergraduate colleges: 361
Here:
88.9%
Pennsylvania:
39.8%
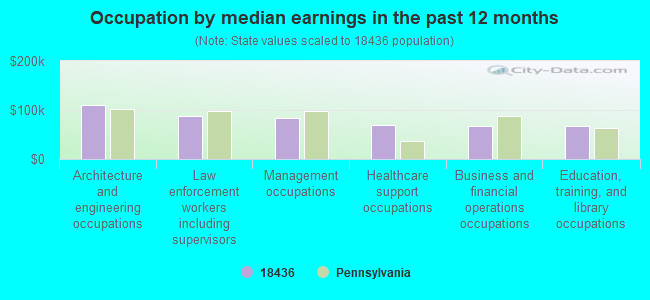
Occupation by median earnings in the past 12 months ($)
110,089Architecture and engineering occupations
88,679Law enforcement workers including supervisors
83,646Management occupations
69,108Healthcare support occupations
67,361Business and financial operations occupations
66,373Education, training, and library occupations
Companies with federal contracts located in this zip code:
BECK & BECK SERVICE, INC (80 LEDGEDALE ROAD in LAKE ARIEL, PA; small business) : $138,867 in 28 contractsfrom 2002 to 2006
Contracts for Maintenance, Repair or Alteration of Real Property -- Office Buildings, Maintenance, Repair or Alteration of Real Property -- Maintenance Buildings, Maintenance, Repair and Rebuilding of Equipment -- Refrigeration, Air Conditioning, and Air Circulating Equipment, Maintenance, Repair or Alteration of Real Property -- Heating and Cooling Plants, and moreby Public Buildings Service, Army Signed by year:2000: $0; 2001: $0; 2002: $76,900; 2003: $7,908; 2004: $28,738; 2005: $23,435; 2006: $1,886.
Biggest contracts:
$34,000 with Public Buildings Service for Maintenance, Repair or Alteration of Real Property -- Office Buildings. Signed on 2002-04-15. Completion date: 2002-06-15.
$32,000 with Army for Maintenance, Repair or Alteration of Real Property -- Maintenance Buildings. Signed on 2002-05-01. Completion date: 2002-09-03.
$12,340 with Army for Maintenance, Repair and Rebuilding of Equipment -- Refrigeration, Air Conditioning, and Air Circulating Equipment. Signed on 2005-01-28. Completion date: 2004-07-16.
$10,900 with Army for Maintenance, Repair or Alteration of Real Property -- Heating and Cooling Plants. Signed on 2002-12-13. Completion date: 2003-04-18.
RICHARD BISHOP CONSULTING (924 CORTEZ ROAD in LAKE ARIEL, PA; small business) : $70,880 in 3 contractsfrom 2002 to 2004
$44,880 with Army for Other Special Studies and Analyses. Signed on 2004-02-18. Completion date: 2005-02-28.
$20,000 with Army for Chemical/Biological Studies and Analyses. Taking place in MD. Signed on 2002-12-13. Completion date: 2003-10-31.
$6,000, same as above.Signed on 2003-07-01. Completion date: 2003-10-31.
NATURE WORKS CLEAR WATER ASSOC (1367 MOUNT COBB RD in LAKE ARIEL, PA; small business) : $0 in 2 contractsin 2004
$24,003 with Army for Landscaping/Groundskeeping Services. Taking place in NJ. Signed on 2004-04-20. Completion date: 2004-09-30.
-$24,003, same as above.Signed on 2004-04-07. Completion date: 2004-09-01.
Top industries in this zip code by the number of employees in 2005:
Other Services (except Public Administration): Other Similar Organizations (except Business, Professional, Labor, and Political Organizations) (100-249 employees: 1 establishment, 20-49 employees: 1 establishment, 5-9 employees: 1 establishment, 1-4 employees: 1 establishment)
Finance and Insurance: Real Estate Credit (50-99: 1, 10-19: 1)
Other Services (except Public Administration): Religious Organizations (20-49: 1, 10-19: 1, 1-4: 4)
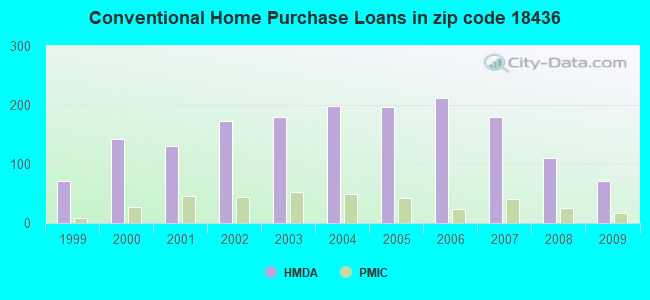
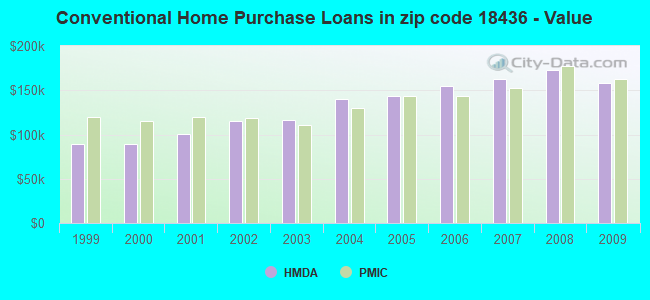
Detailed PMIC statistics for the following Tracts:1113.00
, 1118.00
2004 - 2018 National Fire Incident Reporting System (NFIRS) incidents
According to the data from the years 2004 - 2018 the average number of fires per year is 19. The highest number of fires - 76 took place in 2016, and the least - 0 in 2006. The data has a growing trend.
When looking into fire subcategories, the most incidents belonged to: Structure Fires (48.5%), and Outside Fires (27.5%).
Fire incident types reported to NFIRS in Zip Code 18436


 Nearest zip codes: 18427, 18459, 18463, 18438, 18472, 18445.


 According to the data from the years 2004 - 2018 the average number of fires per year is 19. The highest number of fires - 76 took place in 2016, and the least - 0 in 2006. The data has a growing trend.
 When looking into fire subcategories, the most incidents belonged to: Structure Fires (48.5%), and Outside Fires (27.5%).