Estimated zip code population in 2022: 3,598 Zip code population in 2010: 3,017 Zip code population in 2000: 2,240
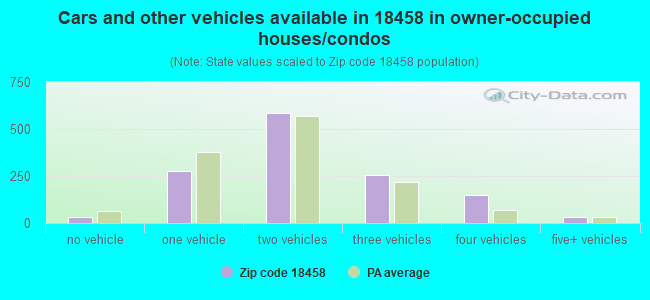
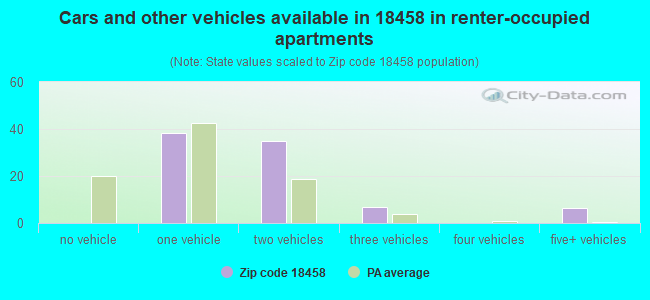
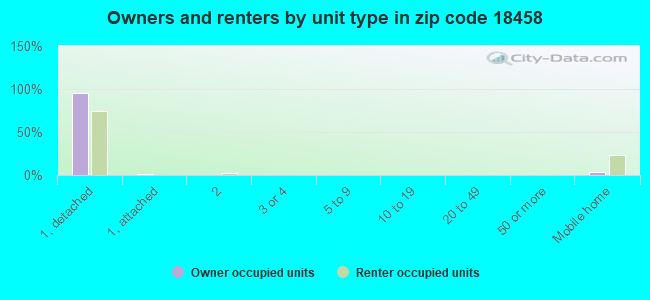
Houses and condos: 2,834 Renter-occupied apartments: 84
% of renters here:
6%
State:
31%
March 2022 cost of living index in zip code 18458: 106.0 (more than average, U.S. average is 100)
Land area: 54.5 sq. mi. Water area: 2.0 sq. mi.
Population density: 66 people per square mile
(very low).
OSM Map
General Map
Google Map
MSN Map
OSM Map
General Map
Google Map
MSN Map
OSM Map
General Map
Google Map
MSN Map
OSM Map
General Map
Google Map
MSN Map
Please wait while loading the map...
Real estate property taxes paid for housing units in 2022:
This zip code:
1.4% ($3,791)
Pennsylvania:
1.3% ($3,094)
Median real estate property taxes paid for housing units with mortgages in 2022: $3,913 (1.4%) Median real estate property taxes paid for housing units with no mortgage in 2022: $3,419 (1.5%)
Business Search- 14 Million verified businesses
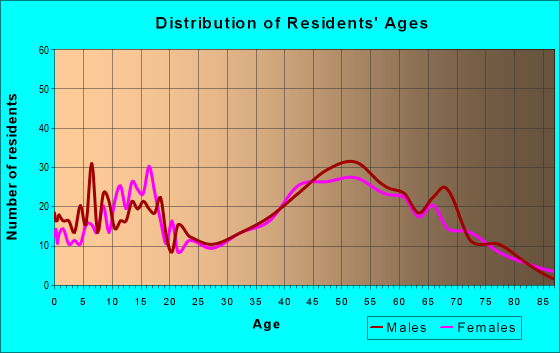
Males: 1,690
(47.0%)
Females: 1,908
(53.0%)
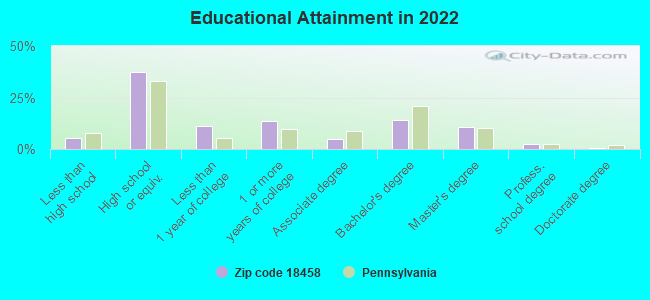
For population 25 years and over in 18458:
High school or higher: 94.2%
Bachelor's degree or higher: 27.7%
Graduate or professional degree: 13.5%
Unemployed: 8.2%
Mean travel time to work (commute): 44.6 minutes
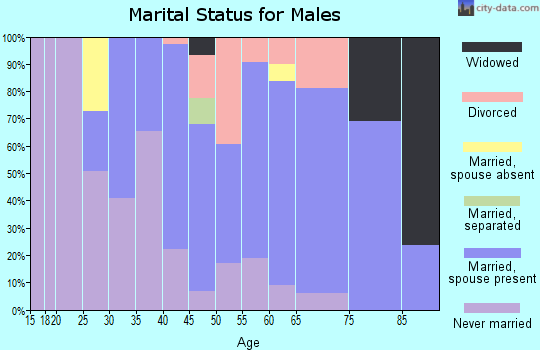
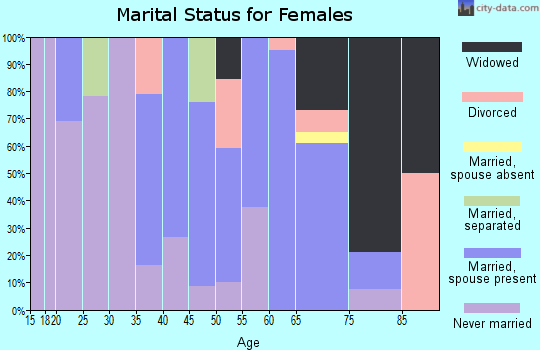
For population 15 years and over in 18458:
Never married: 28.3%
Now married: 60.5%
Separated: 0.1%
Widowed: 3.2%
Divorced: 7.8%
Zip code 18458 compared to state average:
Unemployed percentage above state average.
Black race population percentage significantly below state average.
Hispanic race population percentage below state average.
Median age significantly above state average.
Foreign-born population percentage below state average.
Renting percentage significantly below state average.
Length of stay since moving in significantly above state average.
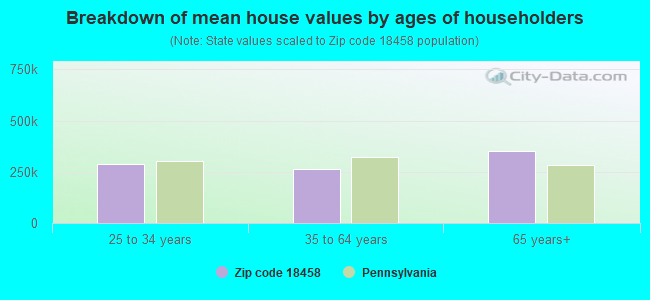
Estimated median house/condo value in 2022: $275,129
18458:
$275,129
Pennsylvania:
$245,500
According to our research of Pennsylvania and other state lists, there was 1 registered sex offender living in 18458 zip code as of April 24, 2024. The ratio of all residents to sex offenders in zip code 18458 is 2,916 to 1. The ratio of registered sex offenders to all residents in this zip code is much lower than the state average.
Median resident age:
This zip code:
49.7 years
Pennsylvania median age:
40.9 years
Average household size:
This zip code:
2.5 people
Pennsylvania:
2.4 people
Averages for the 2020 tax year for zip code 18458, filed in 2021:
Average Adjusted Gross Income (AGI) in 2020: $78,379 (Individual Income Tax Returns)
Here:
$78,379
State:
$75,707
Salary/wage: $66,646 (reported on 74.8% of returns)
Here:
$66,646
State:
$62,806
(% of AGI for various income ranges: 1116.9% for AGIs below $25k, 3274.5% for AGIs $25k-50k, 5871.8% for AGIs $50k-75k, 8936.7% for AGIs $75k-100k, 17028.1% for AGIs $100k-200k, 97850.0% for AGIs over 200k)
Taxable interest for individuals: $1,387 (reported on 34.8% of returns)
This zip code:
$1,387
Pennsylvania:
$1,633
(% of AGI for various income ranges: 41.7% for AGIs below $25k, 42.5% for AGIs $25k-50k, 45.9% for AGIs $50k-75k, 159.2% for AGIs $75k-100k, 93.1% for AGIs $100k-200k, 625.0% for AGIs over 200k)
Ordinary dividends: $6,562 (reported on 25.8% of returns)
Here:
$6,562
State:
$7,382
(% of AGI for various income ranges: 45.9% for AGIs below $25k, 46.5% for AGIs $25k-50k, 118.2% for AGIs $50k-75k, 151.7% for AGIs $75k-100k, 391.9% for AGIs $100k-200k, 6945.0% for AGIs over 200k)
Net capital gain/loss in AGI: +$14,468 (reported on 23.9% of returns)
Here:
+$14,468
State:
+$23,522
(% of AGI for various income ranges: 14.8% for AGIs below $25k, 18.5% for AGIs $25k-50k, 101.2% for AGIs $50k-75k, 269.2% for AGIs $75k-100k, 768.1% for AGIs $100k-200k, 17745.0% for AGIs over 200k)
Profit/loss from business: +$18,116 (reported on 16.1% of returns)
Here:
+$18,116
State:
+$16,274
(% of AGI for various income ranges: 179.0% for AGIs below $25k, 259.5% for AGIs $25k-50k, 240.0% for AGIs $50k-75k, 285.0% for AGIs $75k-100k, 1713.1% for AGIs $100k-200k)
Taxable individual retirement arrangement distribution: $18,016 (reported on 12.3% of returns)
18458:
$18,016
Pennsylvania:
$18,583
(% of AGI for various income ranges: 69.7% for AGIs below $25k, 92.5% for AGIs $25k-50k, 279.4% for AGIs $50k-75k, 327.5% for AGIs $75k-100k, 1355.0% for AGIs $100k-200k)
Total itemized deductions: $30,943 (reported on 9.0% of returns)
Here:
$30,943
State:
$34,850
(% of AGI for various income ranges: 701.8% for AGIs $50k-75k, 451.7% for AGIs $75k-100k, 698.1% for AGIs $100k-200k, 7400.0% for AGIs over 200k)
Charity contributions: $5,100 (reported on 7.1% of returns)
Here:
$5,100
State:
$12,392
(% of AGI for various income ranges: 78.8% for AGIs $50k-75k, 115.0% for AGIs $100k-200k, 1215.0% for AGIs over 200k)
Taxes paid: $8,536 (reported on 9.0% of returns)
18458:
$8,536
State:
$8,200
(% of AGI for various income ranges: 181.2% for AGIs $50k-75k, 147.5% for AGIs $75k-100k, 229.4% for AGIs $100k-200k, 1715.0% for AGIs over 200k)
Earned income credit: $1,987 (reported on 9.7% of returns)
Here:
$1,987
State:
$2,100
(% of AGI for various income ranges: 64.8% for AGIs below $25k, 55.0% for AGIs $25k-50k)
Percentage of individuals using paid preparers for their 2020 taxes: 92.9%
Here:
93%
State:
92%
(% for various income ranges: 93.3% for AGIs below $25k, 92.6% for AGIs $25k-50k, 92.0% for AGIs $50k-75k, 94.7% for AGIs $75k-100k, 93.3% for AGIs $100k-200k, 88.9% for AGIs over 200k)
Averages for the 2012 tax year for zip code 18458, filed in 2013:
Average Adjusted Gross Income (AGI) in 2012: $58,412 (Individual Income Tax Returns)
Here:
$58,412
State:
$61,346
Salary/wage: $51,225 (reported on 77.0% of returns)
Here:
$51,225
State:
$51,902
(% of AGI for various income ranges: 63.0% for AGIs below $25k, 66.1% for AGIs $25k-50k, 65.0% for AGIs $50k-75k, 73.9% for AGIs $75k-100k, 73.8% for AGIs $100k-200k, 56.0% for AGIs over 200k)
Taxable interest for individuals: $1,557 (reported on 38.1% of returns)
This zip code:
$1,557
Pennsylvania:
$1,588
(% of AGI for various income ranges: 2.0% for AGIs below $25k, 1.6% for AGIs $25k-50k, 1.6% for AGIs $50k-75k, 0.4% for AGIs $75k-100k, 0.6% for AGIs $100k-200k, 0.9% for AGIs over 200k)
Ordinary dividends: $4,035 (reported on 24.5% of returns)
Here:
$4,035
State:
$5,827
(% of AGI for various income ranges: 2.9% for AGIs below $25k, 1.5% for AGIs $25k-50k, 1.6% for AGIs $50k-75k, 0.5% for AGIs $75k-100k, 2.2% for AGIs $100k-200k, 1.8% for AGIs over 200k)
Net capital gain/loss in AGI: +$1,500 (reported on 15.1% of returns)
Here:
+$1,500
State:
+$14,495
(% of AGI for various income ranges: 0.3% for AGIs $100k-200k, 2.3% for AGIs over 200k)
Profit/loss from business: +$13,171 (reported on 17.3% of returns)
Here:
+$13,171
State:
+$16,268
(% of AGI for various income ranges: 13.5% for AGIs below $25k, 4.3% for AGIs $25k-50k, 4.1% for AGIs $50k-75k, 2.6% for AGIs $75k-100k, 4.5% for AGIs $100k-200k)
Taxable individual retirement arrangement distribution: $17,888 (reported on 12.2% of returns)
18458:
$17,888
Pennsylvania:
$14,550
(% of AGI for various income ranges: 3.8% for AGIs below $25k, 3.2% for AGIs $25k-50k, 3.9% for AGIs $50k-75k, 3.2% for AGIs $75k-100k, 6.4% for AGIs $100k-200k)
Total itemized deductions: $22,117 (23% of AGI, reported on 43.2% of returns)
Here:
$22,117
State:
$23,538
Here:
23.4% of AGI
State:
18.4% of AGI
(% of AGI for various income ranges: 14.4% for AGIs below $25k, 17.0% for AGIs $25k-50k, 18.8% for AGIs $50k-75k, 16.5% for AGIs $75k-100k, 16.7% for AGIs $100k-200k, 13.4% for AGIs over 200k)
Charity contributions: $2,746 (reported on 33.1% of returns)
Here:
$2,746
State:
$4,025
(% of AGI for various income ranges: 0.7% for AGIs below $25k, 1.5% for AGIs $25k-50k, 1.5% for AGIs $50k-75k, 1.1% for AGIs $75k-100k, 1.8% for AGIs $100k-200k, 2.0% for AGIs over 200k)
Taxes paid: $8,671 (reported on 42.4% of returns)
18458:
$8,671
State:
$9,982
(% of AGI for various income ranges: 4.8% for AGIs below $25k, 4.6% for AGIs $25k-50k, 6.5% for AGIs $50k-75k, 6.8% for AGIs $75k-100k, 6.8% for AGIs $100k-200k, 6.5% for AGIs over 200k)
Earned income credit: $1,976 (reported on 12.2% of returns)
Here:
$1,976
State:
$2,106
(% of AGI for various income ranges: 4.7% for AGIs below $25k, 0.8% for AGIs $25k-50k)
Percentage of individuals using paid preparers for their 2012 taxes: 66.2%
Here:
66%
State:
53%
(% for various income ranges: 58.0% for AGIs below $25k, 58.6% for AGIs $25k-50k, 77.3% for AGIs $50k-75k, 75.0% for AGIs $75k-100k, 77.8% for AGIs $100k-200k, 75.0% for AGIs over 200k)
Averages for the 2004 tax year for zip code 18458, filed in 2005:
Average Adjusted Gross Income (AGI) in 2004: $49,602 (Individual Income Tax Returns)
Here:
$49,602
State:
$48,049
Salary/wage: $44,943 (reported on 77.1% of returns)
Here:
$44,943
State:
$42,646
(% of AGI for various income ranges: 103.1% for AGIs below $10k, 55.7% for AGIs $10k-25k, 71.3% for AGIs $25k-50k, 76.6% for AGIs $50k-75k, 75.8% for AGIs $75k-100k, 63.0% for AGIs over 100k)
Taxable interest for individuals: $1,475 (reported on 54.7% of returns)
This zip code:
$1,475
Pennsylvania:
$1,657
(% of AGI for various income ranges: 10.6% for AGIs below $10k, 3.3% for AGIs $10k-25k, 1.5% for AGIs $25k-50k, 1.9% for AGIs $50k-75k, 1.1% for AGIs $75k-100k, 1.2% for AGIs over 100k)
Taxable dividends: $2,202 (reported on 31.1% of returns)
Here:
$2,202
State:
$3,566
(% of AGI for various income ranges: 4.5% for AGIs below $10k, 3.1% for AGIs $10k-25k, 1.7% for AGIs $25k-50k, 1.0% for AGIs $50k-75k, 1.0% for AGIs $75k-100k, 1.3% for AGIs over 100k)
Net capital gain/loss: +$8,835 (reported on 22.6% of returns)
Here:
+$8,835
State:
+$9,716
(% of AGI for various income ranges: 1.2% for AGIs below $10k, -1.2% for AGIs $10k-25k, -0.1% for AGIs $25k-50k, 1.2% for AGIs $50k-75k, 3.2% for AGIs $75k-100k, 9.4% for AGIs over 100k)
Profit/loss from business: +$15,809 (reported on 19.9% of returns)
Here:
+$15,809
State:
+$14,267
(% of AGI for various income ranges: 13.0% for AGIs below $10k, 13.9% for AGIs $10k-25k, 6.9% for AGIs $25k-50k, 3.5% for AGIs $50k-75k, 2.2% for AGIs $75k-100k, 8.6% for AGIs over 100k)
IRA payment deduction: $4,000 (reported on 3.3% of returns)
18458:
$4,000
Pennsylvania:
$2,903
Self-employed pension: $15,385 (reported on 1.1% of returns)
Here:
$15,385
Pennsylvania:
$14,674
Total itemized deductions: $18,273 (23% of AGI, reported on 46.3% of returns)
Here:
$18,273
State:
$18,804
Here:
23.4% of AGI
State:
19.5% of AGI
(% of AGI for various income ranges: 16.6% for AGIs below $10k, 16.3% for AGIs $10k-25k, 16.3% for AGIs $25k-50k, 20.4% for AGIs $50k-75k, 16.0% for AGIs $75k-100k, 15.9% for AGIs over 100k)
Charity contributions deductions: $2,215 (3% of AGI, reported on 40.7% of returns)
Here:
$2,215
State:
$3,337
Here:
2.7% of AGI
State:
3.3% of AGI
(% of AGI for various income ranges: 1.1% for AGIs $10k-25k, 1.8% for AGIs $25k-50k, 1.7% for AGIs $50k-75k, 1.7% for AGIs $75k-100k, 2.2% for AGIs over 100k)
Total tax: $7,166 (reported on 78.6% of returns)
18458:
$7,166
State:
$8,008
(% of AGI for various income ranges: 5.5% for AGIs below $10k, 5.3% for AGIs $10k-25k, 7.5% for AGIs $25k-50k, 7.8% for AGIs $50k-75k, 10.4% for AGIs $75k-100k, 17.5% for AGIs over 100k)
Earned income credit: $1,789 (reported on 9.0% of returns)
Here:
$1,789
State:
$1,643
Percentage of individuals using paid preparers for their 2004 taxes: 68.3%
Here:
68%
State:
56%
(% for various income ranges: 56.6% for AGIs below $10k, 63.8% for AGIs $10k-25k, 71.0% for AGIs $25k-50k, 72.1% for AGIs $50k-75k, 74.4% for AGIs $75k-100k, 79.8% for AGIs over 100k)
Household received Food Stamps/SNAP in the past 12 months: 149 Household did not receive Food Stamps/SNAP in the past 12 months: 1,271
Women who had a birth in the past 12 months: 39 (17 now married, 20 unmarried) Women who did not have a birth in the past 12 months: 567 (260 now married, 305 unmarried)
Housing units in zip code 18458 with a mortgage: 758 (24 second mortgage, 24 both second mortgage and home equity loan) Houses without a mortgage: 47
Median monthly owner costs for units with a mortgage: $1,446 Median monthly owner costs for units without a mortgage: $638
Residents with income below the poverty level in 2022:
This zip code:
7.5%
Whole state:
11.8%
Residents with income below 50% of the poverty level in 2022:
This zip code:
4.9%
Whole state:
6.1%
Median number of rooms in houses and condos:
Here:
5.9
State:
6.8
Median number of rooms in apartments:
Here:
4.2
State:
4.3
Notable locations in this zip code not listed on our city pages
Notable locations in zip code 18458: Shohola Falls Trails End (A), Shohola Volunteer Fire and Rescue Company 1 Main Station (B), Shohola Volunteer Fire and Rescue Company 41 (C). Display/hide their locations on the map
Lakes, reservoirs, and swamps: Verga Pond (A), Twin Lakes (B), Hirsh Pond (C), Nitche Pond (D), Little Walker Lake (E), Shohola Marsh Reservoir (F), Walker Lake (G), Crooked Swamp (H). Display/hide their locations on the map
Streams, rivers, and creeks: Rattlesnake Creek (A), Pond Eddy Creek (B), Grassy Brook (C), Panther Creek (D), Gin Brook (E), Walker Lake Creek (F), Twin Lakes Creek (G), Maple Brook (H), Sap Brook (I). Display/hide their locations on the map
In group quarters: 11 (-1 institutionalized population)
Size of family households: 672 2-persons, 174 3-persons, 92 4-persons, 67 5-persons, 91 7-or-more-persons
Size of nonfamily households: 254 1-person, 78 2-persons
470 married couples with children.
136 single-parent households (46 men, 90 women).
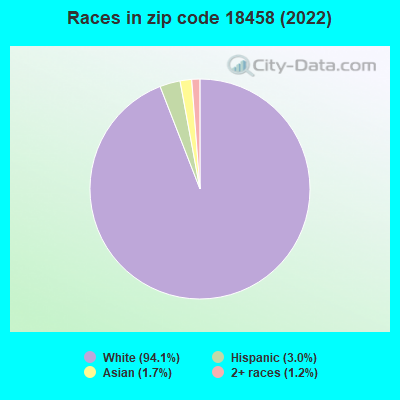
94.5% of residents of 18458 zip code speak English at home.
1.5% of residents speak Spanish at home (58% very well, 25% well, 17% not well).
3.1% of residents speak other Indo-European language at home (75% very well, 20% well, 5% not well).
0.3% of residents speak Asian or Pacific Island language at home (64% very well, 36% well).
0.1% of residents speak other language at home (100% very well).
Foreign born population: 143 (4.0%) (59.0% of them are naturalized citizens)
This zip code:
4.0%
Whole state:
7.5%
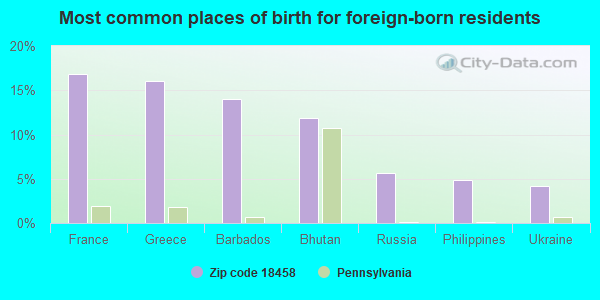
17%France
16%Greece
14%Barbados
12%Bhutan
6%Russia
5%Philippines
4%Ukraine
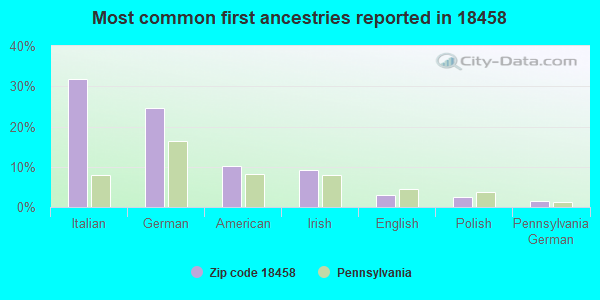
32%Italian
25%German
10%American
9%Irish
3%English
2%Polish
2%Pennsylvania German
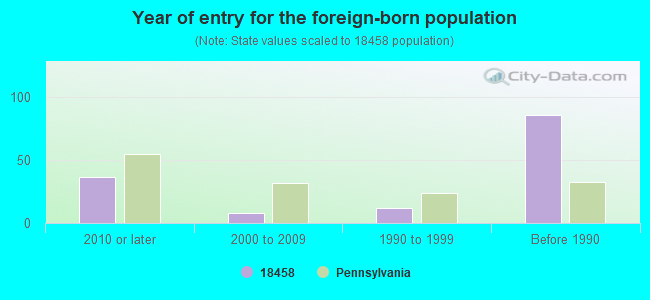
Year of entry for the foreign-born population
372010 or later
82000 to 2009
121990 to 1999
86Before 1990
Public elementary/middle school in in zip code 18458 not listed on the city page:
Facilities with environmental interests located in this zip code:
BLACKFELD, ANTHONY & SUSAN (120 LAKE SHORE DRIVE in SHOHOLA, PA)
(Integrated Compliance Information System) - ICIS-03-2005-0054, FORMAL ENFORCEMENT ACTION
Housing units lacking complete plumbing facilities: 6.2% Housing units lacking complete kitchen facilities: 0.2%
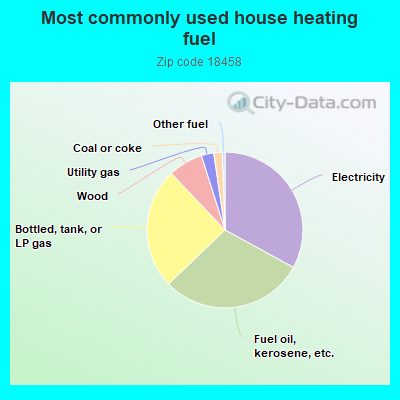
33.1%Electricity
30.0%Fuel oil, kerosene, etc.
25.2%Bottled, tank, or LP gas
7.2%Wood
2.6%Utility gas
1.8%Coal or coke
0.5%Other fuel
Population in 1990: 1,586. Population change in the 1990s: +654 (+41.2%).
Place of birth for U.S.-born residents:
This state: 1,026
Northeast: 2,065
Midwest: 55
South: 225
West: 135
67% of the 18458 zip code residents lived in the same house 5 years ago. Out of people who lived in different houses, 34% lived in this county. Out of people who lived in different counties, 50% lived in Pennsylvania.
98% of the 18458 zip code residents lived in the same house 1 year ago. Out of people who lived in different houses, 55% moved from this county. Out of people who lived in different houses, 11% moved from different county within same state. Out of people who lived in different houses, 55% moved from different state.
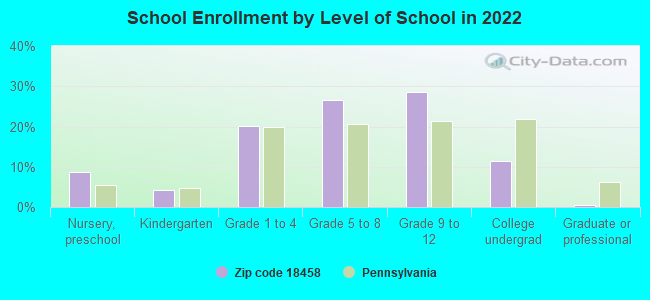
Private vs. public school enrollment:
Students in private schools in grades 1 to 8 (elementary and middle school): 146
Here:
41.4%
Pennsylvania:
15.7%
Students in private schools in grades 9 to 12 (high school): 65
Here:
30.5%
Pennsylvania:
13.4%
Students in private undergraduate colleges: 18
Here:
21.5%
Pennsylvania:
39.8%
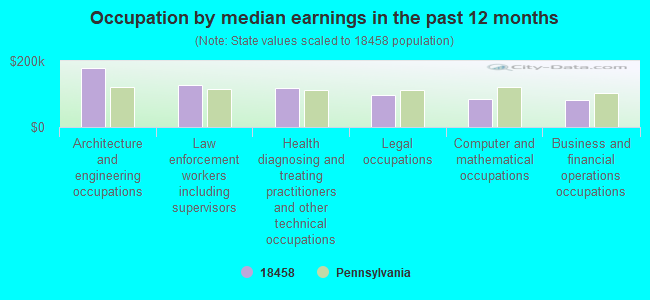
Occupation by median earnings in the past 12 months ($)
178,590Architecture and engineering occupations
128,680Law enforcement workers including supervisors
117,378Health diagnosing and treating practitioners and other technical occupations
96,388Legal occupations
85,679Computer and mathematical occupations
82,484Business and financial operations occupations
Companies with federal contracts located in this zip code:
SPIRAL TOOL CORP (761 ROUTE 6 in SHOHOLA, PA; small business) : $142,614 in 12 contractsfrom 2002 to 2006
Contracts for Degaussing and Mine Sweeping Equipment, Airframe Structural Components, Miscellaneous Power Transmission Equipment, Nuts and Washers, and moreby Defense Logistics Agency Signed by year:2000: $0; 2001: $0; 2002: $77,100; 2003: $0; 2004: $22,357; 2005: $26,857; 2006: $16,300.
Biggest contracts:
$47,200 with Defense Logistics Agency for Degaussing and Mine Sweeping Equipment. Signed on 2002-09-06. Completion date: 2002-12-05.
$29,900 with Defense Logistics Agency for Airframe Structural Components. Signed on 2002-03-26. Completion date: 2002-09-09.
$9,960 with Defense Logistics Agency for Miscellaneous Power Transmission Equipment. Signed on 2005-05-06. Completion date: 2006-01-14.
$8,988, same as above.Signed on 2005-04-21. Completion date: 2005-11-04.
Top industries in this zip code by the number of employees in 2005:
Health Care and Social Assistance: Homes for the Elderly (20-49 employees: 1 establishment)
Other Services (except Public Administration): Commercial and Industrial Machinery and Equipment (except Automotive and Electronic) Repair and Maintenance (20-49: 1)
Other Services (except Public Administration): Other Similar Organizations (except Business, Professional, Labor, and Political Organizations) (10-19: 1, 1-4: 1)
Accommodation and Food Services: Full-Service Restaurants (5-9: 1, 1-4: 2)
Construction: Residential Remodelers (5-9: 1)
Construction: Electrical Contractors (5-9: 1)
Accommodation and Food Services: Limited-Service Restaurants (5-9: 1)
Other Services (except Public Administration): Environment, Conservation and Wildlife Organizations (5-9: 1)
People in group quarters in 2010:
17 people in other noninstitutional facilities
People in group quarters in 2000:
23 people in other noninstitutional group quarters
Fatal accident statistics in 2013:
Fatal accident count: 1
Vehicles involved in fatal accidents: 1
Fatal accidents caused by drunken drivers: 0
Fatalities: 2
Persons involved in fatal accidents: 4
Pedestrians involved in fatal accidents: 0
Fatal accident statistics in 2012:
Fatal accident count: 1
Vehicles involved in fatal accidents: 1
Fatal accidents caused by drunken drivers: 0
Fatalities: 1
Persons involved in fatal accidents: 1
Pedestrians involved in fatal accidents: 0
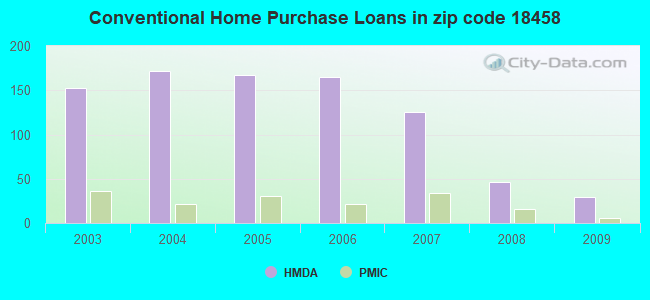
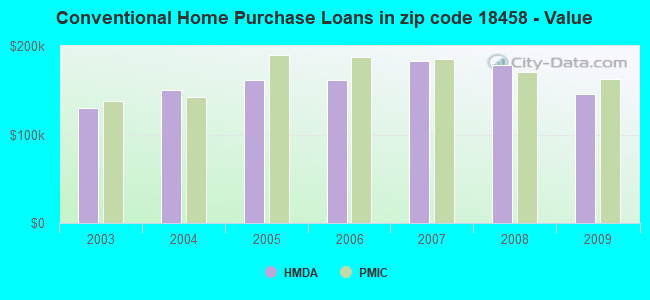
Home Mortgage Disclosure Act Aggregated Statistics For Year 2009 (Based on 2 partial tracts)
A) FHA, FSA/RHS & VA Home Purchase Loans
B) Conventional Home Purchase Loans
C) Refinancings
D) Home Improvement Loans
F) Non-occupant Loans on < 5 Family Dwellings (A B C & D)
G) Loans On Manufactured Home Dwelling (A B C & D)
Number
Average Value
Number
Average Value
Number
Average Value
Number
Average Value
Number
Average Value
Number
Average Value
LOANS ORIGINATED
27
$169,938
29
$146,327
178
$172,887
19
$92,536
43
$175,268
5
$51,670
APPLICATIONS APPROVED, NOT ACCEPTED
2
$189,380
2
$186,455
25
$164,174
2
$64,295
2
$93,520
1
$58,450
APPLICATIONS DENIED
6
$169,505
7
$187,709
91
$191,074
18
$89,558
14
$201,569
0
$0
APPLICATIONS WITHDRAWN
2
$259,520
5
$110,354
65
$188,407
4
$123,330
9
$192,236
1
$91,180
FILES CLOSED FOR INCOMPLETENESS
4
$126,838
0
$0
18
$156,646
0
$0
1
$234,970
0
$0
Aggregated Statistics For Year 2008 (Based on 2 partial tracts)
A) FHA, FSA/RHS & VA Home Purchase Loans
B) Conventional Home Purchase Loans
C) Refinancings
D) Home Improvement Loans
F) Non-occupant Loans on < 5 Family Dwellings (A B C & D)
G) Loans On Manufactured Home Dwelling (A B C & D)
Number
Average Value
Number
Average Value
Number
Average Value
Number
Average Value
Number
Average Value
Number
Average Value
LOANS ORIGINATED
32
$179,515
46
$178,755
152
$168,744
35
$58,951
36
$206,264
2
$116,900
APPLICATIONS APPROVED, NOT ACCEPTED
2
$166,585
6
$226,202
41
$206,599
6
$19,873
5
$297,394
0
$0
APPLICATIONS DENIED
9
$179,377
19
$107,856
119
$165,998
30
$98,547
14
$129,008
11
$84,168
APPLICATIONS WITHDRAWN
8
$150,509
7
$118,570
40
$205,481
4
$92,350
2
$102,870
0
$0
FILES CLOSED FOR INCOMPLETENESS
2
$204,575
1
$140,280
12
$190,742
2
$24,550
7
$163,493
0
$0
Aggregated Statistics For Year 2007 (Based on 2 partial tracts)
A) FHA, FSA/RHS & VA Home Purchase Loans
B) Conventional Home Purchase Loans
C) Refinancings
D) Home Improvement Loans
E) Loans on Dwellings For 5+ Families
F) Non-occupant Loans on < 5 Family Dwellings (A B C & D)
G) Loans On Manufactured Home Dwelling (A B C & D)
Number
Average Value
Number
Average Value
Number
Average Value
Number
Average Value
Number
Average Value
Number
Average Value
Number
Average Value
LOANS ORIGINATED
20
$187,975
125
$182,888
186
$160,379
47
$62,554
1
$467,600
44
$184,436
6
$90,987
APPLICATIONS APPROVED, NOT ACCEPTED
0
$0
16
$166,948
54
$160,846
20
$80,836
0
$0
11
$155,371
1
$58,450
APPLICATIONS DENIED
0
$0
26
$187,984
174
$170,157
60
$71,250
0
$0
30
$129,369
5
$42,084
APPLICATIONS WITHDRAWN
2
$148,465
20
$155,477
62
$170,938
7
$116,733
0
$0
4
$192,592
0
$0
FILES CLOSED FOR INCOMPLETENESS
0
$0
2
$238,475
33
$184,277
2
$84,755
0
$0
1
$201,070
0
$0
Aggregated Statistics For Year 2006 (Based on 2 partial tracts)
A) FHA, FSA/RHS & VA Home Purchase Loans
B) Conventional Home Purchase Loans
C) Refinancings
D) Home Improvement Loans
F) Non-occupant Loans on < 5 Family Dwellings (A B C & D)
G) Loans On Manufactured Home Dwelling (A B C & D)
Number
Average Value
Number
Average Value
Number
Average Value
Number
Average Value
Number
Average Value
Number
Average Value
LOANS ORIGINATED
12
$173,499
165
$161,563
253
$140,132
57
$40,402
39
$162,281
2
$104,040
APPLICATIONS APPROVED, NOT ACCEPTED
2
$137,360
28
$190,296
48
$176,592
15
$98,118
8
$135,750
0
$0
APPLICATIONS DENIED
4
$165,122
43
$136,528
159
$156,403
51
$55,906
21
$89,011
5
$156,178
APPLICATIONS WITHDRAWN
1
$85,340
13
$128,230
123
$167,557
14
$78,741
7
$118,737
2
$68,385
FILES CLOSED FOR INCOMPLETENESS
0
$0
7
$99,031
19
$149,078
0
$0
0
$0
0
$0
Aggregated Statistics For Year 2005 (Based on 2 partial tracts)
A) FHA, FSA/RHS & VA Home Purchase Loans
B) Conventional Home Purchase Loans
C) Refinancings
D) Home Improvement Loans
F) Non-occupant Loans on < 5 Family Dwellings (A B C & D)
G) Loans On Manufactured Home Dwelling (A B C & D)
Number
Average Value
Number
Average Value
Number
Average Value
Number
Average Value
Number
Average Value
Number
Average Value
LOANS ORIGINATED
12
$166,777
167
$161,700
265
$140,964
57
$75,411
47
$179,156
4
$92,935
APPLICATIONS APPROVED, NOT ACCEPTED
2
$106,965
29
$166,966
51
$147,386
14
$41,416
7
$127,254
6
$69,167
APPLICATIONS DENIED
0
$0
48
$143,592
133
$147,153
60
$60,710
16
$155,769
5
$51,436
APPLICATIONS WITHDRAWN
1
$115,730
18
$207,368
140
$148,071
16
$142,472
11
$139,855
1
$249,000
FILES CLOSED FOR INCOMPLETENESS
0
$0
4
$127,130
18
$151,451
5
$62,424
4
$182,658
0
$0
Aggregated Statistics For Year 2004 (Based on 2 partial tracts)
A) FHA, FSA/RHS & VA Home Purchase Loans
B) Conventional Home Purchase Loans
C) Refinancings
D) Home Improvement Loans
F) Non-occupant Loans on < 5 Family Dwellings (A B C & D)
G) Loans On Manufactured Home Dwelling (A B C & D)
Number
Average Value
Number
Average Value
Number
Average Value
Number
Average Value
Number
Average Value
Number
Average Value
LOANS ORIGINATED
6
$135,410
172
$150,482
269
$129,698
51
$54,003
53
$135,251
8
$73,062
APPLICATIONS APPROVED, NOT ACCEPTED
5
$107,548
30
$160,192
61
$126,654
23
$60,839
14
$178,941
6
$31,953
APPLICATIONS DENIED
2
$124,500
32
$135,787
145
$121,463
44
$33,502
14
$88,093
6
$42,668
APPLICATIONS WITHDRAWN
2
$219,190
12
$130,733
124
$115,674
15
$67,179
5
$108,718
0
$0
FILES CLOSED FOR INCOMPLETENESS
0
$0
4
$154,015
14
$103,791
8
$126,690
2
$192,300
0
$0
Aggregated Statistics For Year 2003 (Based on 2 partial tracts)
A) FHA, FSA/RHS & VA Home Purchase Loans
B) Conventional Home Purchase Loans
C) Refinancings
D) Home Improvement Loans
F) Non-occupant Loans on < 5 Family Dwellings (A B C & D)


 Nearest zip codes: 18337, 18435, 12770, 12719, 12792, 18425.


 (Students: 722, Location: 940 TWIN LAKES ROAD, Grades: KG-5)