Estimated zip code population in 2022: 17,806 Zip code population in 2010: 17,020 Zip code population in 2000: 17,309
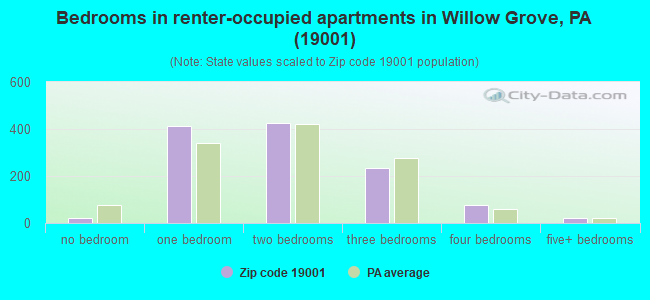
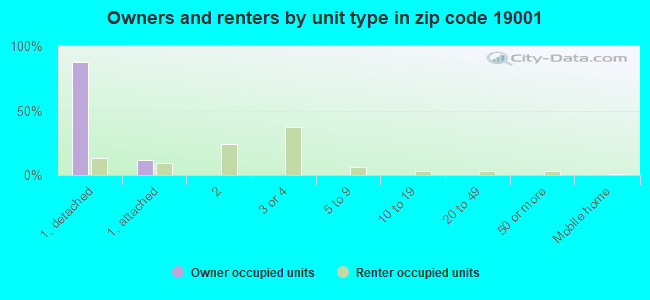
Houses and condos: 6,756 Renter-occupied apartments: 1,200
% of renters here:
18%
State:
31%
March 2022 cost of living index in zip code 19001: 103.5 (near average, U.S. average is 100)
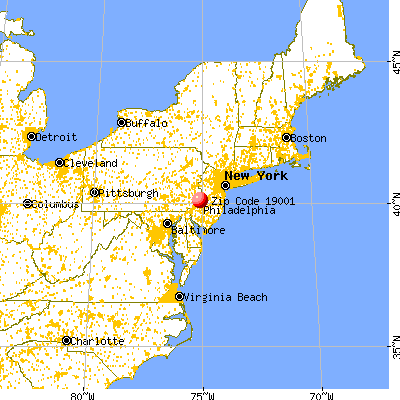
Land area: 3.5 sq. mi. Water area: 0.0 sq. mi.
Population density: 5,143 people per square mile
(average).
OSM Map
General Map
Google Map
MSN Map
OSM Map
General Map
Google Map
MSN Map
OSM Map
General Map
Google Map
MSN Map
OSM Map
General Map
Google Map
MSN Map
Please wait while loading the map...
Real estate property taxes paid for housing units in 2022:
This zip code:
1.4% ($4,841)
Pennsylvania:
1.3% ($3,094)
Median real estate property taxes paid for housing units with mortgages in 2022: $4,926 (1.4%) Median real estate property taxes paid for housing units with no mortgage in 2022: $4,684 (1.4%)
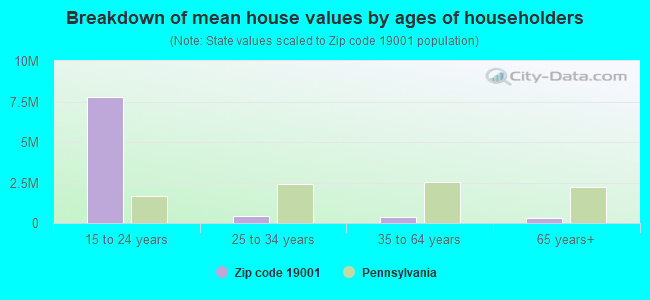
Estimated median house/condo value in 2022: $349,474
19001:
$349,474
Pennsylvania:
$245,500
According to our research of Pennsylvania and other state lists, there were 16 registered sex offenders living in 19001 zip code as of April 23, 2024. The ratio of all residents to sex offenders in zip code 19001 is 1,081 to 1. The ratio of registered sex offenders to all residents in this zip code is lower than the state average.
Median resident age:
This zip code:
39.4 years
Pennsylvania median age:
40.9 years
Average household size:
This zip code:
2.7 people
Pennsylvania:
2.4 people
Averages for the 2020 tax year for zip code 19001, filed in 2021:
Average Adjusted Gross Income (AGI) in 2020: $76,019 (Individual Income Tax Returns)
Here:
$76,019
State:
$75,707
Salary/wage: $69,535 (reported on 83.3% of returns)
Here:
$69,535
State:
$62,806
(% of AGI for various income ranges: 1062.4% for AGIs below $25k, 3552.0% for AGIs $25k-50k, 6414.0% for AGIs $50k-75k, 9868.8% for AGIs $75k-100k, 18535.4% for AGIs $100k-200k, 75216.4% for AGIs over 200k)
Taxable interest for individuals: $1,033 (reported on 35.7% of returns)
This zip code:
$1,033
Pennsylvania:
$1,633
(% of AGI for various income ranges: 28.2% for AGIs below $25k, 30.5% for AGIs $25k-50k, 35.3% for AGIs $50k-75k, 41.4% for AGIs $75k-100k, 87.1% for AGIs $100k-200k, 578.6% for AGIs over 200k)
Ordinary dividends: $4,712 (reported on 23.9% of returns)
Here:
$4,712
State:
$7,382
(% of AGI for various income ranges: 35.9% for AGIs below $25k, 46.2% for AGIs $25k-50k, 100.3% for AGIs $50k-75k, 119.9% for AGIs $75k-100k, 222.7% for AGIs $100k-200k, 3190.7% for AGIs over 200k)
Net capital gain/loss in AGI: +$9,108 (reported on 19.1% of returns)
Here:
+$9,108
State:
+$23,522
(% of AGI for various income ranges: 12.3% for AGIs below $25k, 41.1% for AGIs $25k-50k, 71.9% for AGIs $50k-75k, 127.9% for AGIs $75k-100k, 323.0% for AGIs $100k-200k, 6740.0% for AGIs over 200k)
Profit/loss from business: +$13,186 (reported on 14.4% of returns)
Here:
+$13,186
State:
+$16,274
(% of AGI for various income ranges: 105.9% for AGIs below $25k, 143.9% for AGIs $25k-50k, 175.0% for AGIs $50k-75k, 276.4% for AGIs $75k-100k, 445.8% for AGIs $100k-200k, 3235.0% for AGIs over 200k)
Taxable individual retirement arrangement distribution: $16,979 (reported on 9.7% of returns)
19001:
$16,979
Pennsylvania:
$18,583
(% of AGI for various income ranges: 72.2% for AGIs below $25k, 113.7% for AGIs $25k-50k, 183.6% for AGIs $50k-75k, 220.4% for AGIs $75k-100k, 538.1% for AGIs $100k-200k, 1743.6% for AGIs over 200k)
Self-employed (Keogh) retirement plans: $19,620 (reported on 0.6% of returns)
19001:
$19,620
Pennsylvania:
$25,407
(% of AGI for various income ranges: 47.7% for AGIs $75k-100k, 452.1% for AGIs over 200k)
Total itemized deductions: $25,756 (reported on 11.9% of returns)
Here:
$25,756
State:
$34,850
(% of AGI for various income ranges: 80.4% for AGIs below $25k, 151.5% for AGIs $25k-50k, 415.7% for AGIs $50k-75k, 739.0% for AGIs $75k-100k, 807.2% for AGIs $100k-200k, 3802.1% for AGIs over 200k)
Charity contributions: $7,141 (reported on 9.6% of returns)
Here:
$7,141
State:
$12,392
(% of AGI for various income ranges: 7.8% for AGIs below $25k, 18.1% for AGIs $25k-50k, 51.3% for AGIs $50k-75k, 116.4% for AGIs $75k-100k, 223.3% for AGIs $100k-200k, 1297.1% for AGIs over 200k)
Taxes paid: $8,221 (reported on 11.8% of returns)
19001:
$8,221
State:
$8,200
(% of AGI for various income ranges: 17.1% for AGIs below $25k, 45.2% for AGIs $25k-50k, 145.9% for AGIs $50k-75k, 259.5% for AGIs $75k-100k, 265.5% for AGIs $100k-200k, 995.0% for AGIs over 200k)
Earned income credit: $1,901 (reported on 8.8% of returns)
Here:
$1,901
State:
$2,100
(% of AGI for various income ranges: 54.3% for AGIs below $25k, 49.8% for AGIs $25k-50k)
Percentage of individuals using paid preparers for their 2020 taxes: 90.3%
Here:
90%
State:
92%
(% for various income ranges: 88.9% for AGIs below $25k, 90.9% for AGIs $25k-50k, 91.4% for AGIs $50k-75k, 88.8% for AGIs $75k-100k, 92.0% for AGIs $100k-200k, 89.1% for AGIs over 200k)
Averages for the 2012 tax year for zip code 19001, filed in 2013:
Average Adjusted Gross Income (AGI) in 2012: $62,675 (Individual Income Tax Returns)
Here:
$62,675
State:
$61,346
Salary/wage: $56,956 (reported on 85.0% of returns)
Here:
$56,956
State:
$51,902
(% of AGI for various income ranges: 69.8% for AGIs below $25k, 78.5% for AGIs $25k-50k, 78.7% for AGIs $50k-75k, 81.3% for AGIs $75k-100k, 82.7% for AGIs $100k-200k, 60.7% for AGIs over 200k)
Taxable interest for individuals: $1,182 (reported on 39.2% of returns)
This zip code:
$1,182
Pennsylvania:
$1,588
(% of AGI for various income ranges: 1.6% for AGIs below $25k, 0.9% for AGIs $25k-50k, 0.9% for AGIs $50k-75k, 0.7% for AGIs $75k-100k, 0.5% for AGIs $100k-200k, 0.8% for AGIs over 200k)
Ordinary dividends: $4,258 (reported on 25.1% of returns)
Here:
$4,258
State:
$5,827
(% of AGI for various income ranges: 2.6% for AGIs below $25k, 1.3% for AGIs $25k-50k, 1.5% for AGIs $50k-75k, 1.0% for AGIs $75k-100k, 1.3% for AGIs $100k-200k, 3.5% for AGIs over 200k)
Net capital gain/loss in AGI: +$3,090 (reported on 17.5% of returns)
Here:
+$3,090
State:
+$14,495
(% of AGI for various income ranges: 0.2% for AGIs $25k-50k, 0.3% for AGIs $50k-75k, 0.3% for AGIs $75k-100k, 0.6% for AGIs $100k-200k, 3.7% for AGIs over 200k)
Profit/loss from business: +$16,222 (reported on 13.3% of returns)
Here:
+$16,222
State:
+$16,268
(% of AGI for various income ranges: 6.3% for AGIs below $25k, 3.7% for AGIs $25k-50k, 2.6% for AGIs $50k-75k, 2.5% for AGIs $75k-100k, 3.0% for AGIs $100k-200k, 5.1% for AGIs over 200k)
Taxable individual retirement arrangement distribution: $14,761 (reported on 11.9% of returns)
19001:
$14,761
Pennsylvania:
$14,550
(% of AGI for various income ranges: 4.6% for AGIs below $25k, 3.0% for AGIs $25k-50k, 2.6% for AGIs $50k-75k, 2.3% for AGIs $75k-100k, 2.6% for AGIs $100k-200k, 3.1% for AGIs over 200k)
Self-employment retirement plans: $13,700 (reported on 0.8% of returns)
19001:
$13,700
Pennsylvania:
$20,922
Total itemized deductions: $21,181 (22% of AGI, reported on 47.7% of returns)
Here:
$21,181
State:
$23,538
Here:
21.8% of AGI
State:
18.4% of AGI
(% of AGI for various income ranges: 15.3% for AGIs below $25k, 14.7% for AGIs $25k-50k, 18.4% for AGIs $50k-75k, 18.6% for AGIs $75k-100k, 16.6% for AGIs $100k-200k, 11.5% for AGIs over 200k)
Charity contributions: $2,831 (reported on 40.5% of returns)
Here:
$2,831
State:
$4,025
(% of AGI for various income ranges: 1.1% for AGIs below $25k, 1.5% for AGIs $25k-50k, 1.8% for AGIs $50k-75k, 1.9% for AGIs $75k-100k, 1.9% for AGIs $100k-200k, 2.2% for AGIs over 200k)
Taxes paid: $9,011 (reported on 47.5% of returns)
19001:
$9,011
State:
$9,982
(% of AGI for various income ranges: 4.2% for AGIs below $25k, 4.8% for AGIs $25k-50k, 6.9% for AGIs $50k-75k, 7.7% for AGIs $75k-100k, 7.8% for AGIs $100k-200k, 6.2% for AGIs over 200k)
Earned income credit: $1,773 (reported on 10.4% of returns)
Here:
$1,773
State:
$2,106
(% of AGI for various income ranges: 3.7% for AGIs below $25k, 0.7% for AGIs $25k-50k)
Percentage of individuals using paid preparers for their 2012 taxes: 47.8%
Here:
48%
State:
53%
(% for various income ranges: 41.9% for AGIs below $25k, 45.8% for AGIs $25k-50k, 49.3% for AGIs $50k-75k, 55.0% for AGIs $75k-100k, 52.5% for AGIs $100k-200k, 63.6% for AGIs over 200k)
Averages for the 2004 tax year for zip code 19001, filed in 2005:
Average Adjusted Gross Income (AGI) in 2004: $52,022 (Individual Income Tax Returns)
Here:
$52,022
State:
$48,049
Salary/wage: $48,543 (reported on 84.5% of returns)
Here:
$48,543
State:
$42,646
(% of AGI for various income ranges: 97.6% for AGIs below $10k, 67.7% for AGIs $10k-25k, 80.5% for AGIs $25k-50k, 83.2% for AGIs $50k-75k, 84.8% for AGIs $75k-100k, 73.7% for AGIs over 100k)
Taxable interest for individuals: $1,506 (reported on 55.9% of returns)
This zip code:
$1,506
Pennsylvania:
$1,657
(% of AGI for various income ranges: 6.7% for AGIs below $10k, 3.8% for AGIs $10k-25k, 1.8% for AGIs $25k-50k, 1.5% for AGIs $50k-75k, 1.1% for AGIs $75k-100k, 1.3% for AGIs over 100k)
Taxable dividends: $2,628 (reported on 32.7% of returns)
Here:
$2,628
State:
$3,566
(% of AGI for various income ranges: 6.1% for AGIs below $10k, 3.3% for AGIs $10k-25k, 1.6% for AGIs $25k-50k, 1.2% for AGIs $50k-75k, 1.1% for AGIs $75k-100k, 1.8% for AGIs over 100k)
Net capital gain/loss: +$6,414 (reported on 22.8% of returns)
Here:
+$6,414
State:
+$9,716
(% of AGI for various income ranges: -3.4% for AGIs below $10k, 0.4% for AGIs $10k-25k, 0.3% for AGIs $25k-50k, 0.5% for AGIs $50k-75k, 0.4% for AGIs $75k-100k, 7.1% for AGIs over 100k)
Profit/loss from business: +$14,243 (reported on 13.4% of returns)
Here:
+$14,243
State:
+$14,267
(% of AGI for various income ranges: 4.8% for AGIs below $10k, 5.4% for AGIs $10k-25k, 4.2% for AGIs $25k-50k, 2.1% for AGIs $50k-75k, 2.8% for AGIs $75k-100k, 4.4% for AGIs over 100k)
IRA payment deduction: $2,867 (reported on 3.5% of returns)
19001:
$2,867
Pennsylvania:
$2,903
(% of AGI for various income ranges: 0.3% for AGIs $10k-25k, 0.4% for AGIs $25k-50k, 0.2% for AGIs $50k-75k, 0.1% for AGIs $75k-100k, 0.1% for AGIs over 100k)
Self-employed pension: $10,299 (reported on 1.1% of returns)
Here:
$10,299
Pennsylvania:
$14,674
(% of AGI for various income ranges: 0.1% for AGIs $10k-25k, 0.1% for AGIs $50k-75k, 0.2% for AGIs $75k-100k, 0.4% for AGIs over 100k)
Total itemized deductions: $17,933 (22% of AGI, reported on 48.6% of returns)
Here:
$17,933
State:
$18,804
Here:
22.1% of AGI
State:
19.5% of AGI
(% of AGI for various income ranges: 14.4% for AGIs below $10k, 15.6% for AGIs $10k-25k, 16.7% for AGIs $25k-50k, 19.9% for AGIs $50k-75k, 18.5% for AGIs $75k-100k, 14.3% for AGIs over 100k)
Charity contributions deductions: $2,618 (3% of AGI, reported on 44.6% of returns)
Here:
$2,618
State:
$3,337
Here:
3.1% of AGI
State:
3.3% of AGI
(% of AGI for various income ranges: 1.0% for AGIs below $10k, 1.5% for AGIs $10k-25k, 1.9% for AGIs $25k-50k, 2.4% for AGIs $50k-75k, 2.4% for AGIs $75k-100k, 2.4% for AGIs over 100k)
Total tax: $7,485 (reported on 79.7% of returns)
19001:
$7,485
State:
$8,008
(% of AGI for various income ranges: 2.4% for AGIs below $10k, 4.6% for AGIs $10k-25k, 7.3% for AGIs $25k-50k, 8.7% for AGIs $50k-75k, 10.0% for AGIs $75k-100k, 17.1% for AGIs over 100k)
Earned income credit: $1,361 (reported on 6.9% of returns)
Here:
$1,361
State:
$1,643
Percentage of individuals using paid preparers for their 2004 taxes: 49.3%
Here:
49%
State:
56%
(% for various income ranges: 43.4% for AGIs below $10k, 49.8% for AGIs $10k-25k, 49.3% for AGIs $25k-50k, 51.8% for AGIs $50k-75k, 48.7% for AGIs $75k-100k, 54.8% for AGIs over 100k)
Likely homosexual households (counted as self-reported same-sex unmarried-partner households)
Lesbian couples: 0.8% of all households
Gay men: 0.0% of all households
Household received Food Stamps/SNAP in the past 12 months: 379 Household did not receive Food Stamps/SNAP in the past 12 months: 6,104
Women who had a birth in the past 12 months: 193 (206 now married, 0 unmarried) Women who did not have a birth in the past 12 months: 3,834 (1,782 now married, 2,043 unmarried)
Housing units in zip code 19001 with a mortgage: 3,627 (466 second mortgage, 387 both second mortgage and home equity loan) Houses without a mortgage: 167
Median monthly owner costs for units with a mortgage: $2,023 Median monthly owner costs for units without a mortgage: $748
Residents with income below the poverty level in 2022:
This zip code:
6.4%
Whole state:
11.8%
Residents with income below 50% of the poverty level in 2022:
This zip code:
2.1%
Whole state:
6.1%
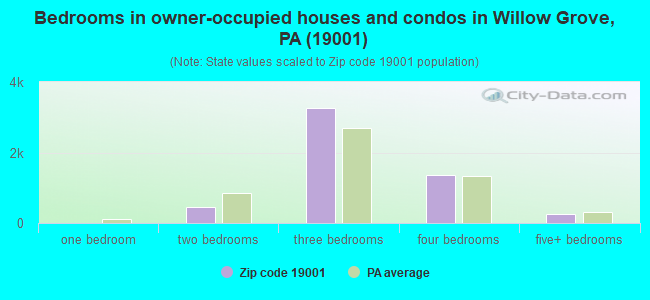
Median number of rooms in houses and condos:
Here:
7.0
State:
6.8
Median number of rooms in apartments:
Here:
4.1
State:
4.3
Notable locations in this zip code not listed on our city pages
Notable locations in zip code 19001: Abington Library Society (A), Abington Township Fire Department / Abington Fire Company (B), Abington Township Hall (C), Abington Township Police Station (D), Abington Township Public Library (E), Montgomery County District Courthouse (F), Roslyn Library (G), Abington Township Fire Department / Roslyn Fire Company (H). Display/hide their locations on the map
Churches in zip code 19001 include: Saint Annes Church (A), Abington Baptist Church (B), Our Lady of Help of Christian Church (C), Holy Trinity Church (D), Evangelical Lutheran of the Living Word Church (E), Abington Presbyterian Church (F). Display/hide their locations on the map
3,582 married couples with children.
584 single-parent households (109 men, 475 women).
84.4% of residents of 19001 zip code speak English at home.
8.8% of residents speak Spanish at home (79% very well, 13% well, 5% not well, 3% not at all).
3.3% of residents speak other Indo-European language at home (80% very well, 18% well, 2% not well).
2.7% of residents speak Asian or Pacific Island language at home (49% very well, 34% well, 17% not well).
0.6% of residents speak other language at home (71% very well, 29% well).
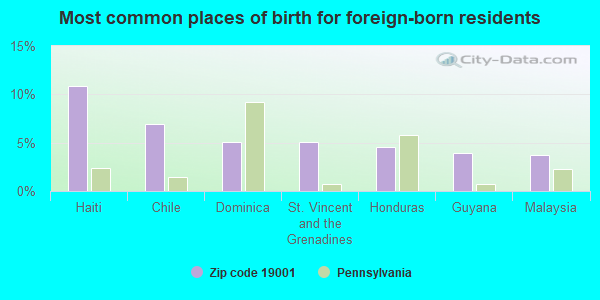
Foreign born population: 1,615 (9.1%) (87.5% of them are naturalized citizens)
This zip code:
9.1%
Whole state:
7.5%
11%Haiti
7%Chile
5%Dominica
5%St. Vincent and the Grenadines
5%Honduras
4%Guyana
4%Malaysia
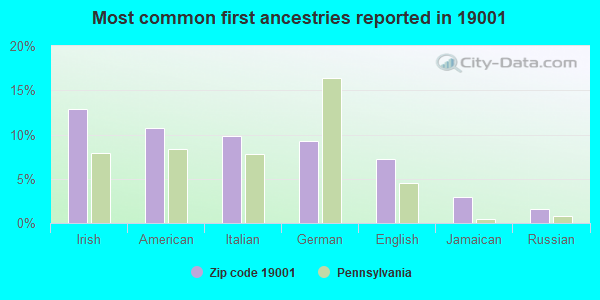
13%Irish
11%American
10%Italian
9%German
7%English
3%Jamaican
2%Russian
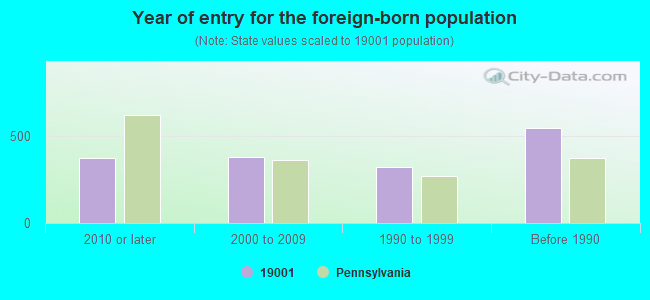
Year of entry for the foreign-born population
3712010 or later
3782000 to 2009
3231990 to 1999
546Before 1990
Facilities with environmental interests located in this zip code:
ABINGTON MEM HOSP (1200 OLD YORK ROAD in ABINGTON, PA)
AIR SYNTHETIC MINOR (AIRS/AFS) ENFORCEMENT/COMPLIANCE ACTIVITY (Integrated Compliance Information System) - ICIS-03-1996-0359, FORMAL ENFORCEMENT ACTION (Integrated Compliance Information System) - ICIS-03-1996-0359, FORMAL ENFORCEMENT ACTION CRITERIA AND HAZARDOUS AIR POLLUTANT INVENTORY (Inventory of air pollution sources) STATE MASTER (Pennsylvania database) - AFS-23-1352152-1, AIR PROGRAM, RCRIS-PAD069895340, HAZARDOUS WASTE PROGRAM Small Quantity Generators, between 100 kg and 1000 kg of hazardous waste/month (Resource Conservation and Recovery Act (tracking hazardous waste)) Business SIC classification: SPECIAL TRADE CONTRACTORS; GENERAL MEDICAL AND SURGICAL HOSPITALS Organizations: ABINGTON MEMORIAL HOSPITAL (CONTACT/OPERATOR)
, ABINGTON MEMORIAL HOSPITAL INC (CONTACT/OWNER)
, ABINGTON MEMORIAL HOSPITAL (CONTACT/OWNER)
Alternative names: ABINGTON MEM HOSP/ABINGTON, ABINGTON MEMORIAL HOPSITAL, ABINGTON MEMORIAL HOSP INC
ABINGTON JR HIGH SCH (2056 SUSQUEHANNA ROAD in ABINGTON, PA)
(Geographic Names Information System) STATE MASTER (Pennsylvania database) - RCRIS-PAD100465434, HAZARDOUS WASTE PROGRAM Small Quantity Generators, between 100 kg and 1000 kg of hazardous waste/month (Resource Conservation and Recovery Act (tracking hazardous waste)) - notification Organizations: OPERNAME (CONTACT/OPERATOR)
, ABINGTON SCHOOL DISTRICT (CONTACT/OWNER)
Alternative names: ABINGTON JHS, ABINGTON JUNIOR HIGH SCHOOL
ABINGTON SR HIGH SCH (900 HIGHLAND AVENUE in ABINGTON, PA)
(Geographic Names Information System) STATE MASTER (Pennsylvania database) - RCRIS-PAD103810180, HAZARDOUS WASTE PROGRAM Small Quantity Generators, between 100 kg and 1000 kg of hazardous waste/month (Resource Conservation and Recovery Act (tracking hazardous waste)) - notification Organizations: OPERNAME (CONTACT/OPERATOR)
, ABINGTON SCHOOL DIST (CONTACT/OWNER)
Alternative names: ABINGTON HIGH SCHOOL, ABINGTON SENIOR HIGH SCHOOL, ABINGTON SHS
BERGEYS TIRE & SVC (1424 YORK RD in ABINGTON, PA)
STATE MASTER (Pennsylvania database) - RCRIS-PAD987347762, HAZARDOUS WASTE PROGRAM Small Quantity Generators, between 100 kg and 1000 kg of hazardous waste/month (Resource Conservation and Recovery Act (tracking hazardous waste)) - notification Organizations: OPERNAME (CONTACT/OPERATOR)
, BERGEY HENRY (CONTACT/OWNER)
ABINGTON SCH DIST (1230 HUNTINGDON RD in ABINGTON, PA)
STATE MASTER (Pennsylvania database) - RCRIS-PAR000002527, HAZARDOUS WASTE PROGRAM Conditionally Exempt Small Quantity Generators, less than 100 kg/month of hazardous waste (Resource Conservation and Recovery Act (tracking hazardous waste)) - notification Organizations: ABINGTON SCHOOL DISTRICT (CONTACT/OWNER)
Alternative names: ABINGTON SCHOOL DISTRICT
ABINGTON TRANSF STA (995 FITZWATERTOWN ROAD in ABINGTON, PA)
STATE MASTER (Pennsylvania database) - RCRIS-PAR000009092, HAZARDOUS WASTE PROGRAM, PCS-PAR900001, National Pollutant Discharge Elimination System Permit Conditionally Exempt Small Quantity Generators, less than 100 kg/month of hazardous waste (Resource Conservation and Recovery Act (tracking hazardous waste)) - notification Business SIC classification: REFUSE SYSTEMS Organizations: MONTGOMERY CNTY (CONTACT/OWNER)
Alternative names: ABINGTON TRANSFER STA
ABINGTON TWP STP (SUSQUEHANNA &FITZWATERTOWN RDS in ABINGTON, PA)
National Pollutant Discharge Elimination System MAJOR (Tracking pollutant discharge elimination systems) - permit National Pollutant Discharge Elimination System NON-MAJOR (Tracking pollutant discharge elimination systems) - permit (Resource Conservation and Recovery Act (tracking hazardous waste)) Business SIC classification: SEWERAGE SYSTEMS Organizations: OPERNAME (CONTACT/OPERATOR)
, CITY OF ABINGTON (CONTACT/OWNER)
Alternative names: ABINGTON STP, ABINGTON TWP COMM-WWTR TRTMT P, ABINGTON WWTP
ABINGTON PLAZA (1750 OLD YORK RD in ABINGTON, PA)
ENFORCEMENT/COMPLIANCE ACTIVITY (Integrated Compliance Information System)
ABINGTON SCHOOL DISTRICT (970 HIGHLAND AVENUE in ABINGTON, PA)
COMPLIANCE ACTIVITY (Tracking inspections of insecticide, fungicide, and rodenticide, and toxic substances)
ABINGTON SHOPPING CENTER (1500 OLD YORK RD. in ABINGTON, PA)
ENFORCEMENT/COMPLIANCE ACTIVITY (Integrated Compliance Information System)
Housing units lacking complete plumbing facilities: 0.1% Housing units lacking complete kitchen facilities: 1.2%
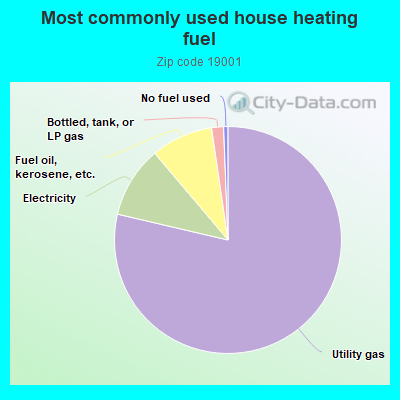
78.2%Utility gas
10.1%Electricity
8.8%Fuel oil, kerosene, etc.
1.7%Bottled, tank, or LP gas
0.6%No fuel used
Population in 1990: 17,302. Population change in the 1990s: +7 (+0.0%).
Place of birth for U.S.-born residents:
This state: 12,625
Northeast: 1,725
Midwest: 374
South: 1,149
West: 239
70% of the 19001 zip code residents lived in the same house 5 years ago. Out of people who lived in different houses, 56% lived in this county. Out of people who lived in different counties, 50% lived in Pennsylvania.
94% of the 19001 zip code residents lived in the same house 1 year ago. Out of people who lived in different houses, 29% moved from this county. Out of people who lived in different houses, 51% moved from different county within same state. Out of people who lived in different houses, 20% moved from different state. Out of people who lived in different houses, 2% moved from abroad.
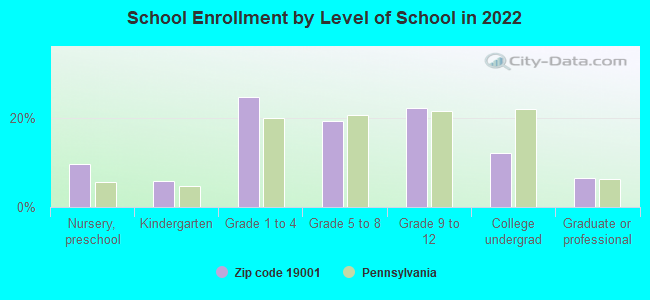
Private vs. public school enrollment:
Students in private schools in grades 1 to 8 (elementary and middle school): 625
Here:
32.2%
Pennsylvania:
15.7%
Students in private schools in grades 9 to 12 (high school): 87
Here:
9.0%
Pennsylvania:
13.4%
Students in private undergraduate colleges: 159
Here:
30.0%
Pennsylvania:
39.8%
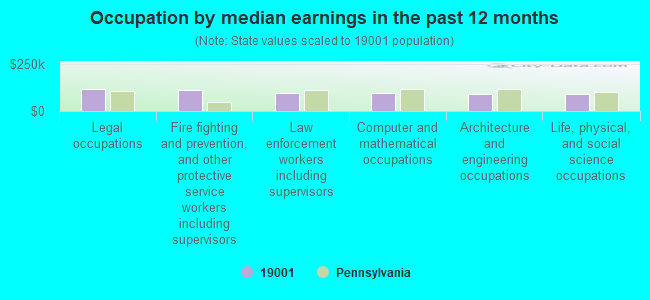
Occupation by median earnings in the past 12 months ($)
116,431Legal occupations
112,594Fire fighting and prevention, and other protective service workers including supervisors
97,332Law enforcement workers including supervisors
97,314Computer and mathematical occupations
91,573Architecture and engineering occupations
89,180Life, physical, and social science occupations
Companies with federal contracts located in this zip code (ABINGTON, PA):
PENN SCIENTIFIC PRODUCTS CO (1000 OLD YORK RD) : $65,846 in 2 contractsin 2001
$38,022 with Defense Logistics Agency for Pipe, Tube and Rigid Tubing. Taking place in OH. Signed on 2001-06-25. Completion date: 2002-08-31.
$27,824 with Defense Logistics Agency for Miscellaneous Power Transmission Equipment. Taking place in OH. Signed on 2001-04-13. Completion date: 2001-12-31.
JAMES A WEST (1925 KEITH ROAD; small business) : $20,650 in 2 contractsin 2000
$19,500 with Navy for Other Housekeeping Services. Signed on 2000-07-31. Completion date: 2001-11-30.
$1,150, same as above.Signed on 2000-12-21. Completion date: 2001-02-28.
COVENTRY GEAR AND SPROCKETT, I (1562 BIRCHWOOD AVE; small business) : $11,185 in 2 contractsin 2005
$6,390 with Defense Logistics Agency for Gears, Pulleys, Sprockets, and Transmission Chain. Signed on 2005-03-25. Completion date: 2005-07-07.
$4,795 with Defense Logistics Agency for Miscellaneous Power Transmission Equipment. Signed on 2005-04-27. Completion date: 2005-08-25.
MULHERN ELECTRIC COMPANY, INC (1828 ECKARD AVE; small business)
$6,423 with Navy for Construction of Structures and Facilities -- Other Administrative Facilities and Service Buildings. Signed on 2000-02-01. Completion date: 2000-02-01.
Top industries in this zip code by the number of employees in 2005:
Health Care and Social Assistance: General Medical and Surgical Hospitals (over 1000 employees: 1 establishment)
Health Care and Social Assistance: Offices of Physicians (except Mental Health Specialists) (100-249: 1, 20-49: 10, 10-19: 8, 5-9: 7, 1-4: 12)
2004 - 2018 National Fire Incident Reporting System (NFIRS) incidents
Based on the data from the years 2004 - 2018 the average number of fires per year is 36. The highest number of fires - 143 took place in 2004, and the least - 0 in 2009. The data has a decreasing trend.
When looking into fire subcategories, the most reports belonged to: Structure Fires (56.5%), and Outside Fires (27.0%).
Fire incident types reported to NFIRS in Zip Code 19001


 Nearest zip codes: 19090, 19046, 19025, 19095, 19027, 19038.


 Based on the data from the years 2004 - 2018 the average number of fires per year is 36. The highest number of fires - 143 took place in 2004, and the least - 0 in 2009. The data has a decreasing trend.
 When looking into fire subcategories, the most reports belonged to: Structure Fires (56.5%), and Outside Fires (27.0%).