Estimated zip code population in 2022: 30,976 Zip code population in 2010: 29,595 Zip code population in 2000: 29,063
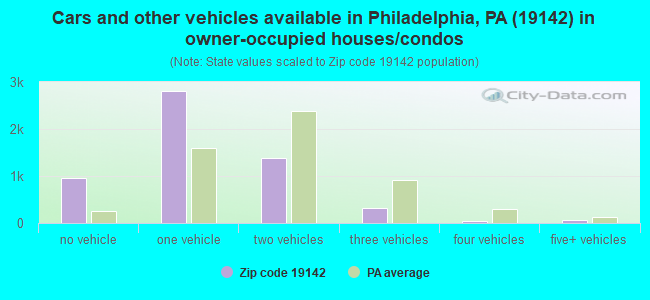
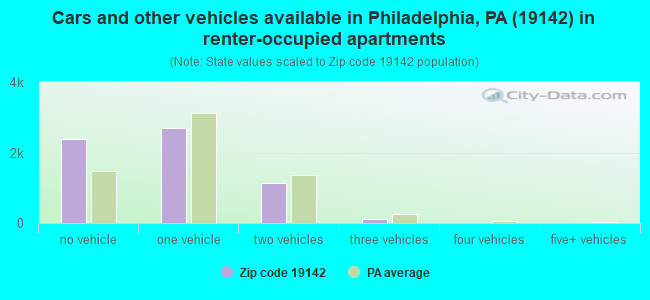
Houses and condos: 12,979 Renter-occupied apartments: 6,335
% of renters here:
54%
State:
31%
March 2022 cost of living index in zip code 19142: 102.4 (near average, U.S. average is 100)
Land area: 1.7 sq. mi. Water area: 0.0 sq. mi.
Population density: 18,373 people per square mile
(very high).
OSM Map
General Map
Google Map
MSN Map
OSM Map
General Map
Google Map
MSN Map
OSM Map
General Map
Google Map
MSN Map
OSM Map
General Map
Google Map
MSN Map
Please wait while loading the map...
Real estate property taxes paid for housing units in 2022:
This zip code:
1.0% ($1,068)
Pennsylvania:
1.3% ($3,094)
Median real estate property taxes paid for housing units with mortgages in 2022: $1,069 (1.0%) Median real estate property taxes paid for housing units with no mortgage in 2022: $1,071 (1.1%)
Averages for the 2020 tax year for zip code 19142, filed in 2021:
Average Adjusted Gross Income (AGI) in 2020: $32,982 (Individual Income Tax Returns)
Here:
$32,982
State:
$75,707
Salary/wage: $29,884 (reported on 84.1% of returns)
Here:
$29,884
State:
$62,806
(% of AGI for various income ranges: 987.7% for AGIs below $25k, 3244.5% for AGIs $25k-50k, 6686.4% for AGIs $50k-75k, 10630.6% for AGIs $75k-100k, 16607.0% for AGIs $100k-200k)
Taxable interest for individuals: $405 (reported on 6.8% of returns)
This zip code:
$405
Pennsylvania:
$1,633
(% of AGI for various income ranges: 1.1% for AGIs below $25k, 2.5% for AGIs $25k-50k, 6.6% for AGIs $50k-75k, 7.1% for AGIs $75k-100k, 55.0% for AGIs $100k-200k)
Ordinary dividends: $1,452 (reported on 1.9% of returns)
Here:
$1,452
State:
$7,382
(% of AGI for various income ranges: 0.9% for AGIs below $25k, 1.8% for AGIs $25k-50k, 8.5% for AGIs $50k-75k, 8.9% for AGIs $75k-100k, 63.0% for AGIs $100k-200k)
Net capital gain/loss in AGI: +$2,532 (reported on 2.0% of returns)
Here:
+$2,532
State:
+$23,522
(% of AGI for various income ranges: 0.5% for AGIs below $25k, 2.3% for AGIs $25k-50k, 16.6% for AGIs $50k-75k, 11.4% for AGIs $75k-100k, 165.0% for AGIs $100k-200k)
Profit/loss from business: +$3,228 (reported on 17.2% of returns)
Here:
+$3,228
State:
+$16,274
(% of AGI for various income ranges: 76.1% for AGIs below $25k, 39.5% for AGIs $25k-50k, 53.4% for AGIs $50k-75k, 205.1% for AGIs $75k-100k, 356.5% for AGIs $100k-200k)
Taxable individual retirement arrangement distribution: $8,812 (reported on 1.2% of returns)
19142:
$8,812
Pennsylvania:
$18,583
(% of AGI for various income ranges: 3.7% for AGIs below $25k, 8.8% for AGIs $25k-50k, 28.9% for AGIs $50k-75k, 277.0% for AGIs $100k-200k)
Total itemized deductions: $26,700 (reported on 3.5% of returns)
Here:
$26,700
State:
$34,850
(% of AGI for various income ranges: 13.8% for AGIs below $25k, 97.0% for AGIs $25k-50k, 322.9% for AGIs $50k-75k, 580.0% for AGIs $75k-100k, 844.0% for AGIs $100k-200k)
Charity contributions: $9,330 (reported on 2.9% of returns)
Here:
$9,330
State:
$12,392
(% of AGI for various income ranges: 3.6% for AGIs below $25k, 25.0% for AGIs $25k-50k, 94.5% for AGIs $50k-75k, 190.3% for AGIs $75k-100k, 287.0% for AGIs $100k-200k)
Taxes paid: $6,306 (reported on 3.4% of returns)
19142:
$6,306
State:
$8,200
(% of AGI for various income ranges: 2.2% for AGIs below $25k, 18.8% for AGIs $25k-50k, 74.6% for AGIs $50k-75k, 179.1% for AGIs $75k-100k, 222.5% for AGIs $100k-200k)
Earned income credit: $2,329 (reported on 36.2% of returns)
Here:
$2,329
State:
$2,100
(% of AGI for various income ranges: 135.1% for AGIs below $25k, 111.0% for AGIs $25k-50k, 0.8% for AGIs $50k-75k)
Percentage of individuals using paid preparers for their 2020 taxes: 93.2%
Here:
93%
State:
92%
(% for various income ranges: 93.3% for AGIs below $25k, 94.4% for AGIs $25k-50k, 91.1% for AGIs $50k-75k, 88.2% for AGIs $75k-100k, 96.8% for AGIs $100k-200k, 0.0% for AGIs over 200k)
Averages for the 2012 tax year for zip code 19142, filed in 2013:
Average Adjusted Gross Income (AGI) in 2012: $26,012 (Individual Income Tax Returns)
Here:
$26,012
State:
$61,346
Salary/wage: $25,335 (reported on 87.3% of returns)
Here:
$25,335
State:
$51,902
(% of AGI for various income ranges: 78.8% for AGIs below $25k, 90.1% for AGIs $25k-50k, 89.5% for AGIs $50k-75k, 82.0% for AGIs $75k-100k, 71.3% for AGIs $100k-200k)
Taxable interest for individuals: $494 (reported on 8.0% of returns)
This zip code:
$494
Pennsylvania:
$1,588
(% of AGI for various income ranges: 0.2% for AGIs below $25k, 0.1% for AGIs $25k-50k, 0.5% for AGIs $75k-100k, 0.3% for AGIs $100k-200k)
Ordinary dividends: $1,463 (reported on 2.4% of returns)
Here:
$1,463
State:
$5,827
(% of AGI for various income ranges: 0.1% for AGIs $25k-50k, 0.1% for AGIs $50k-75k, 0.4% for AGIs $75k-100k, 0.3% for AGIs $100k-200k)
Net capital gain/loss in AGI: +$1,964 (reported on 1.1% of returns)
Here:
+$1,964
State:
+$14,495
(% of AGI for various income ranges: 1.2% for AGIs $75k-100k)
Profit/loss from business: +$6,874 (reported on 14.7% of returns)
Here:
+$6,874
State:
+$16,268
(% of AGI for various income ranges: 10.7% for AGIs below $25k, 1.1% for AGIs $25k-50k, 0.4% for AGIs $50k-75k, 1.1% for AGIs $75k-100k, 1.6% for AGIs $100k-200k)
Taxable individual retirement arrangement distribution: $7,421 (reported on 1.9% of returns)
19142:
$7,421
Pennsylvania:
$14,550
(% of AGI for various income ranges: 0.4% for AGIs below $25k, 0.4% for AGIs $25k-50k, 0.8% for AGIs $50k-75k, 2.2% for AGIs $75k-100k)
Total itemized deductions: $15,651 (33% of AGI, reported on 17.6% of returns)
Here:
$15,651
State:
$23,538
Here:
33.1% of AGI
State:
18.4% of AGI
(% of AGI for various income ranges: 5.0% for AGIs below $25k, 12.0% for AGIs $25k-50k, 14.8% for AGIs $50k-75k, 13.0% for AGIs $75k-100k, 13.8% for AGIs $100k-200k)
Charity contributions: $3,247 (reported on 12.7% of returns)
Here:
$3,247
State:
$4,025
(% of AGI for various income ranges: 0.5% for AGIs below $25k, 1.7% for AGIs $25k-50k, 2.4% for AGIs $50k-75k, 2.4% for AGIs $75k-100k, 2.8% for AGIs $100k-200k)
Taxes paid: $4,479 (reported on 17.5% of returns)
19142:
$4,479
State:
$9,982
(% of AGI for various income ranges: 0.9% for AGIs below $25k, 2.9% for AGIs $25k-50k, 5.0% for AGIs $50k-75k, 5.0% for AGIs $75k-100k, 6.0% for AGIs $100k-200k)
Earned income credit: $2,634 (reported on 50.6% of returns)
Here:
$2,634
State:
$2,106
(% of AGI for various income ranges: 14.0% for AGIs below $25k, 2.4% for AGIs $25k-50k)
Percentage of individuals using paid preparers for their 2012 taxes: 55.0%
Here:
55%
State:
53%
(% for various income ranges: 56.8% for AGIs below $25k, 52.1% for AGIs $25k-50k, 51.5% for AGIs $50k-75k, 55.6% for AGIs $75k-100k, 57.1% for AGIs $100k-200k)
Averages for the 2004 tax year for zip code 19142, filed in 2005:
Average Adjusted Gross Income (AGI) in 2004: $23,522 (Individual Income Tax Returns)
Here:
$23,522
State:
$48,049
Salary/wage: $23,422 (reported on 90.2% of returns)
Here:
$23,422
State:
$42,646
(% of AGI for various income ranges: 81.6% for AGIs below $10k, 87.0% for AGIs $10k-25k, 93.2% for AGIs $25k-50k, 90.9% for AGIs $50k-75k, 87.4% for AGIs $75k-100k, 81.2% for AGIs over 100k)
Taxable interest for individuals: $848 (reported on 15.5% of returns)
This zip code:
$848
Pennsylvania:
$1,657
(% of AGI for various income ranges: 1.2% for AGIs below $10k, 0.7% for AGIs $10k-25k, 0.4% for AGIs $25k-50k, 0.5% for AGIs $50k-75k, 0.7% for AGIs $75k-100k, 0.5% for AGIs over 100k)
Taxable dividends: $1,283 (reported on 4.5% of returns)
Here:
$1,283
State:
$3,566
(% of AGI for various income ranges: 0.4% for AGIs below $10k, 0.2% for AGIs $10k-25k, 0.2% for AGIs $25k-50k, 0.1% for AGIs $50k-75k, 0.1% for AGIs $75k-100k, 1.4% for AGIs over 100k)
Net capital gain/loss: +$781 (reported on 2.5% of returns)
Here:
+$781
State:
+$9,716
(% of AGI for various income ranges: -0.1% for AGIs below $10k, 0.1% for AGIs $10k-25k, 0.0% for AGIs $25k-50k, 0.1% for AGIs $50k-75k, 0.0% for AGIs $75k-100k, 1.0% for AGIs over 100k)
Profit/loss from business: +$5,975 (reported on 8.0% of returns)
Here:
+$5,975
State:
+$14,267
(% of AGI for various income ranges: 10.1% for AGIs below $10k, 3.7% for AGIs $10k-25k, 0.7% for AGIs $25k-50k, 1.1% for AGIs $50k-75k, 0.2% for AGIs $75k-100k)
IRA payment deduction: $2,235 (reported on 0.8% of returns)
19142:
$2,235
Pennsylvania:
$2,903
Total itemized deductions: $13,752 (32% of AGI, reported on 20.0% of returns)
Here:
$13,752
State:
$18,804
Here:
31.5% of AGI
State:
19.5% of AGI
(% of AGI for various income ranges: 2.0% for AGIs below $10k, 6.9% for AGIs $10k-25k, 13.0% for AGIs $25k-50k, 16.6% for AGIs $50k-75k, 18.7% for AGIs $75k-100k, 15.3% for AGIs over 100k)
Charity contributions deductions: $3,173 (7% of AGI, reported on 17.5% of returns)
Here:
$3,173
State:
$3,337
Here:
7.1% of AGI
State:
3.3% of AGI
(% of AGI for various income ranges: 0.3% for AGIs below $10k, 1.0% for AGIs $10k-25k, 2.7% for AGIs $25k-50k, 3.7% for AGIs $50k-75k, 4.0% for AGIs $75k-100k, 3.1% for AGIs over 100k)
Total tax: $2,383 (reported on 49.5% of returns)
19142:
$2,383
State:
$8,008
(% of AGI for various income ranges: 2.0% for AGIs below $10k, 2.3% for AGIs $10k-25k, 4.5% for AGIs $25k-50k, 8.5% for AGIs $50k-75k, 10.0% for AGIs $75k-100k, 14.2% for AGIs over 100k)
Earned income credit: $2,022 (reported on 47.0% of returns)
Here:
$2,022
State:
$1,643
Percentage of individuals using paid preparers for their 2004 taxes: 62.0%
Here:
62%
State:
56%
(% for various income ranges: 60.4% for AGIs below $10k, 67.6% for AGIs $10k-25k, 59.3% for AGIs $25k-50k, 53.4% for AGIs $50k-75k, 54.9% for AGIs $75k-100k, 38.9% for AGIs over 100k)
Likely homosexual households (counted as self-reported same-sex unmarried-partner households)
Lesbian couples: 0.1% of all households
Gay men: 0.0% of all households
Household received Food Stamps/SNAP in the past 12 months: 4,672 Household did not receive Food Stamps/SNAP in the past 12 months: 7,341
Women who had a birth in the past 12 months: 406 (92 now married, 273 unmarried) Women who did not have a birth in the past 12 months: 8,778 (2,166 now married, 6,658 unmarried)
Housing units in zip code 19142 with a mortgage: 3,703 (271 second mortgage, 211 both second mortgage and home equity loan) Houses without a mortgage: 22
Median monthly owner costs for units with a mortgage: $1,104 Median monthly owner costs for units without a mortgage: $425
Residents with income below the poverty level in 2022:
This zip code:
28.0%
Whole state:
11.8%
Residents with income below 50% of the poverty level in 2022:
This zip code:
14.1%
Whole state:
6.1%
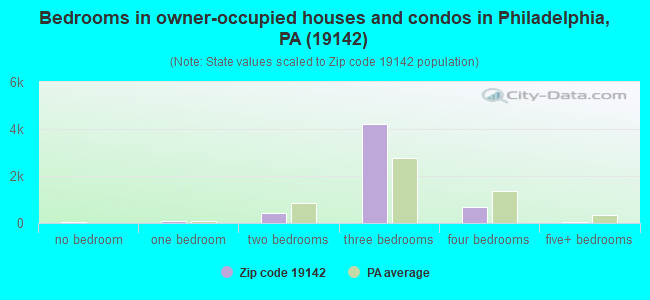
Median number of rooms in houses and condos:
Here:
6.2
State:
6.8
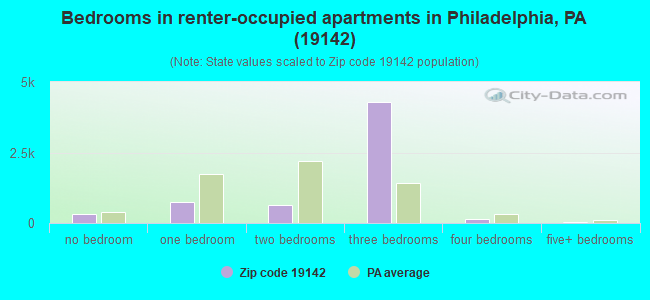
Median number of rooms in apartments:
Here:
5.7
State:
4.3
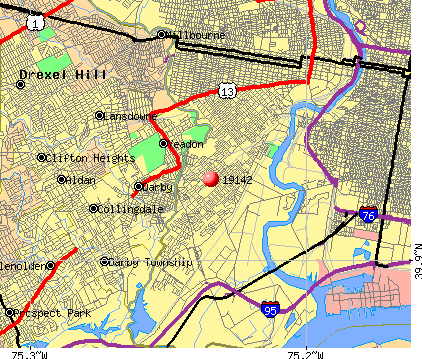
Notable locations in this zip code not listed on our city pages
Notable locations in zip code 19142: Paschalville Library (A), Philadelphia Fire Department Engine 40 (B), Philadelphia District 12 Police Department (C), Saint Vincents Childrens Home (D). Display/hide their locations on the map
2,762 married couples with children.
4,385 single-parent households (697 men, 3,688 women).
73.7% of residents of 19142 zip code speak English at home.
4.3% of residents speak Spanish at home (37% very well, 13% well, 20% not well, 29% not at all).
6.5% of residents speak other Indo-European language at home (42% very well, 49% well, 8% not well, 2% not at all).
5.7% of residents speak Asian or Pacific Island language at home (20% very well, 34% well, 40% not well, 6% not at all).
10.1% of residents speak other language at home (49% very well, 35% well, 13% not well, 4% not at all).
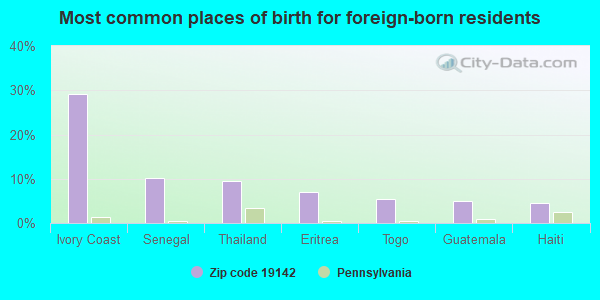
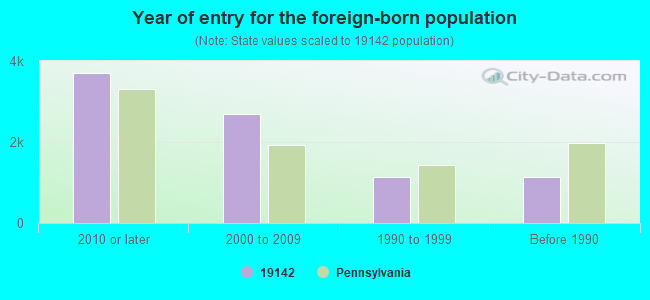
Foreign born population: 7,963 (25.7%) (51.8% of them are naturalized citizens)
Facilities with environmental interests located in this zip code:
AMOCO OIL COMPANY (63RD & PASSYUNK AVENUE in PHILADELPHIA, PA)
AIR MAJOR (AIRS/AFS) (Integrated Compliance Information System) - ICIS-03-1989-0139, FORMAL ENFORCEMENT ACTION National Pollutant Discharge Elimination System NON-MAJOR (Tracking pollutant discharge elimination systems) - permit (Resource Conservation and Recovery Act (tracking hazardous waste)) Business SIC classification: PETROLEUM BULK STATIONS AND TERMINALS Organizations: OPERNAME (CONTACT/OPERATOR)
Alternative names: 121 POINT BREEZE TERMINAL LLC, AMOCO OIL CO - POINT BREEZE, AMOCO OIL CO. - POINT BREEZE TERMINAL
BARTRAM JOHN HIGH SCHOOL (67TH STREET AND ELMWOOD AVENUE in PHILADELPHIA, PA)
(National Center for Education Statistics) - STATE ID-3847 Organizations: PHILADELPHIA CITY SD (SCHOOL DISTRICT)
A & V WOODWORK CO (6525 UPLAND ST in PHILADELPHIA, PA)
(Resource Conservation and Recovery Act (tracking hazardous waste)) Business NAICS classification: INSTITUTIONAL FURNITURE MANUFACTURING. Organizations: OPERNAME (CONTACT/OPERATOR)
Alternative names: A & V WOODWORKING COMPANY
ALTO SIGN CO (6510 UPLAND ST in PHILADELPHIA, PA)
Small Quantity Generators, between 100 kg and 1000 kg of hazardous waste/month (Resource Conservation and Recovery Act (tracking hazardous waste)) - notification Organizations: OPERNAME (CONTACT/OPERATOR)
, LIBERATORE, ALFRED (CONTACT/OWNER)
AMOCO NO 13491 TANKS (22000 ISLAND AVE in PHILADELPHIA, PA)
Small Quantity Generators, between 100 kg and 1000 kg of hazardous waste/month (Resource Conservation and Recovery Act (tracking hazardous waste)) - notification Organizations: AMOCO OIL CO (CONTACT/OWNER)
ATLANTIC AVIATION SERVICE INCORPORATED (ROUTE 291 in PHILADELPHIA, PA)
Small Quantity Generators, between 100 kg and 1000 kg of hazardous waste/month (Resource Conservation and Recovery Act (tracking hazardous waste)) - notification Organizations: OPERNAME (CONTACT/OPERATOR)
70TH AND KINGSESSIN TRAILER (70TH AND KINGSESSIN BLVD. in PHILADELPHIA, PA)
SUPERFUND (Superfund database)
Housing units lacking complete plumbing facilities: 3.3% Housing units lacking complete kitchen facilities: 4.9%
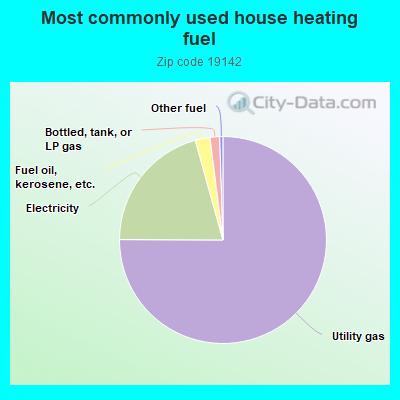
74.7%Utility gas
20.5%Electricity
2.3%Fuel oil, kerosene, etc.
1.5%Bottled, tank, or LP gas
0.5%Other fuel
Population in 1990: 29,171.
Place of birth for U.S.-born residents:
This state: 20,512
Northeast: 864
Midwest: 87
South: 929
West: 80
60% of the 19142 zip code residents lived in the same house 5 years ago. Out of people who lived in different houses, 84% lived in this county. Out of people who lived in different counties, 50% lived in Pennsylvania.
91% of the 19142 zip code residents lived in the same house 1 year ago. Out of people who lived in different houses, 75% moved from this county. Out of people who lived in different houses, 8% moved from different county within same state. Out of people who lived in different houses, 12% moved from different state. Out of people who lived in different houses, 5% moved from abroad.
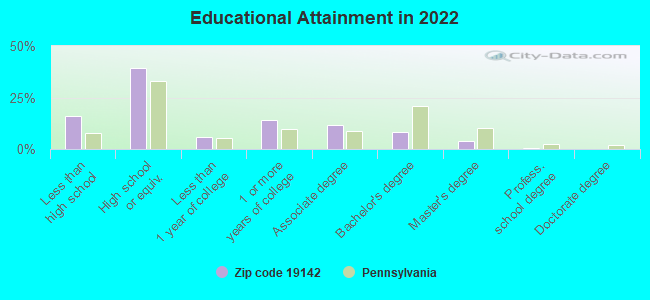
Private vs. public school enrollment:
Students in private schools in grades 1 to 8 (elementary and middle school): 543
Here:
14.2%
Pennsylvania:
15.7%
Students in private schools in grades 9 to 12 (high school): 508
Here:
21.9%
Pennsylvania:
13.4%
Students in private undergraduate colleges: 594
Here:
35.3%
Pennsylvania:
39.8%
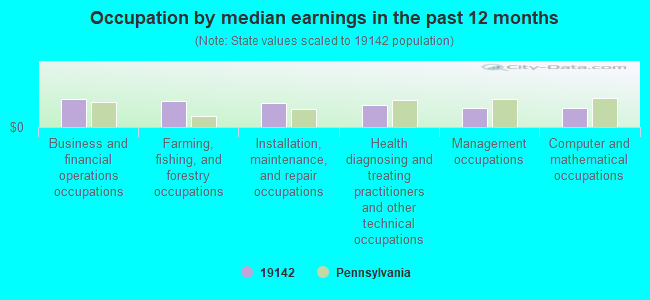
Occupation by median earnings in the past 12 months ($)
74,074Business and financial operations occupations
68,293Farming, fishing, and forestry occupations
61,698Installation, maintenance, and repair occupations
58,807Health diagnosing and treating practitioners and other technical occupations
50,692Management occupations
50,015Computer and mathematical occupations
Companies with federal contracts located in this zip code (PHILADELPHIA, PA):
BOEING COMPANY, THE INC (P.O. BOX 16858) : $92,066,447 in 54 contractsfrom 1999 to 2005
Contracts for Miscellaneous Aircraft Accessories and Components, Technical Representation Services -- Aircraft Components and Accessories, Helicopter Rotor Blades, Drive Mechanisms and Components, Technical Representation Services -- Aircraft and Airframe Structural Components, and moreby Navy Signed by year:2000: $13,854,420; 2001: $14,246,954; 2002: $3,613,418; 2003: $3,633,528; 2004: $1,032,551; 2005: $267,661; 2006: $0.
Biggest contracts:
$33,000,000 with Navy for Miscellaneous Aircraft Accessories and Components. Taking place in MD. Signed on 1999-12-14. Completion date: 2002-01-31.
$22,000,000, same as above.Signed on 1999-12-14. Completion date: 2002-01-31.
$9,200,000 with Navy for Technical Representation Services -- Aircraft Components and Accessories. Signed on 2001-06-27. Completion date: 2001-09-30.
$8,774,970 with Navy for Miscellaneous Aircraft Accessories and Components. Taking place in MD. Signed on 2000-01-10. Completion date: 2000-01-31.
THE ELECTRIC TACHOMETER CORP (6749 UPLAND STREET) : $1,391,101 in 25 contractsfrom 2000 to 2003
Contracts for Shipboard Alarm and Signal Systems, Converters, Electrical, Rotating, Ship and Boat Propulsion Components, Electric Arc Welding Equipment, and moreby Defense Logistics Agency, Navy Signed by year:2000: $413,329; 2001: $628,745; 2002: $319,657; 2003: $29,370; 2004: $0; 2005: $0; 2006: $0.
Biggest contracts:
$195,330 with Defense Logistics Agency for Shipboard Alarm and Signal Systems. Signed on 2000-09-21. Completion date: 2001-03-20.
$98,525, same as above.Signed on 2000-07-31. Completion date: 2000-12-28.
$93,200 with Navy for Shipboard Alarm and Signal Systems. Signed on 2002-09-19. Completion date: 2003-02-16.
$82,000 with Defense Logistics Agency for Shipboard Alarm and Signal Systems. Signed on 2001-04-13. Completion date: 2001-08-11.
REACT ENVIRONMENTAL SERVICES INC (6901 KINGSESSING AVENUE) : $1,001,001 in 5 contractsfrom 2002 to 2004
Contracts for Oil Spill Response including Cleanup, Removal, Disposal and Operational Support by U.S. Coast Guard, United States Coast Guard (disused code: now 7008) Signed by year:2000: $0; 2001: $0; 2002: $1,000; 2003: $0; 2004: $1,000,001; 2005: $0; 2006: $0.
Biggest contracts:
$1,000,000 with U.S. Coast Guard for Oil Spill Response including Cleanup, Removal, Disposal and Operational Support. Signed on 2004-09-09. Completion date: 2005-09-09.
$1,000 with United States Coast Guard (disused code: now 7008) for Oil Spill Response including Cleanup, Removal, Disposal and Operational Support. Signed on 2002-01-15. Completion date: 2003-01-15.
$1 with U.S. Coast Guard for Oil Spill Response including Cleanup, Removal, Disposal and Operational Support. Signed on 2004-09-09. Completion date: 2005-09-09.
$0, same as above.Signed on 2004-09-09. Completion date: 2005-09-09.
ADVANCE TECHNOLOGY EXPORTERS I (6222 REEDLAND ST; small business) : $16,160 in 3 contractsfrom 2004 to 2005
$8,580 with Defense Logistics Agency for Wire and Cable, Electrical. Signed on 2005-05-10. Completion date: 2005-06-12.
$3,790, same as above.Signed on 2004-12-06. Completion date: 2005-02-06.
$3,790, same as above.Signed on 2004-12-06. Completion date: 2005-02-06.
BOEING COMPANY, THE (INC) (MS P53 01) : -$1,389,689 in 4 contractsfrom 2005 to 2006
-$8,324 with Army for Aircraft, Rotary Wing. Signed on 2005-08-17. Completion date: 1999-06-30.
-$41,399, same as above.Signed on 2006-04-18. Completion date: 2000-12-30.
-$341,180 with Army for Miscellaneous Fire Control Equipment. Signed on 2005-05-16. Completion date: 2000-06-30.
-$998,786 with Army for Aircraft, Rotary Wing. Signed on 2006-06-08. Completion date: 1999-09-30.
Top industries in this zip code by the number of employees in 2005:
2010 - 2018 National Fire Incident Reporting System (NFIRS) incidents
Based on the data from the years 2010 - 2018 the average number of fire incidents per year is 135. The highest number of fire incidents - 189 took place in 2010, and the least - 0 in 2016. The data has a declining trend.
When looking into fire subcategories, the most reports belonged to: Structure Fires (54.0%), and Outside Fires (25.3%).
Fire incident types reported to NFIRS in Zip Code 19142


 Nearest zip codes: 19143, 19153, 19050, 19023, 19145, 19139.
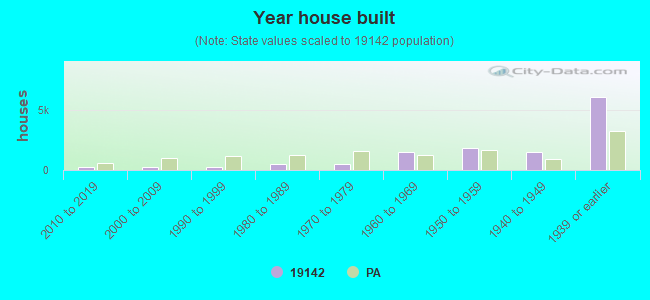


 Based on the data from the years 2010 - 2018 the average number of fire incidents per year is 135. The highest number of fire incidents - 189 took place in 2010, and the least - 0 in 2016. The data has a declining trend.
 When looking into fire subcategories, the most reports belonged to: Structure Fires (54.0%), and Outside Fires (25.3%).