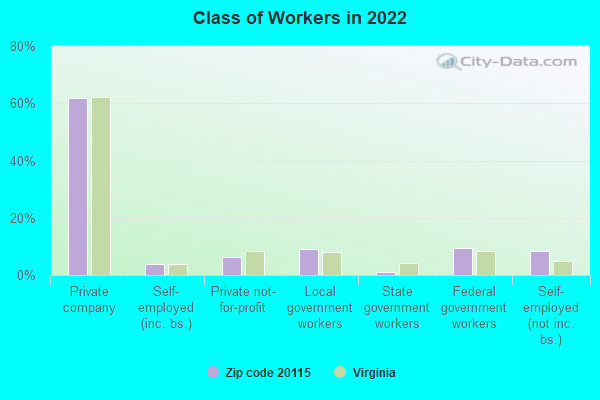
Estimated zip code population in 2022: 7,997 Zip code population in 2010: 5,838 Zip code population in 2000: 5,546
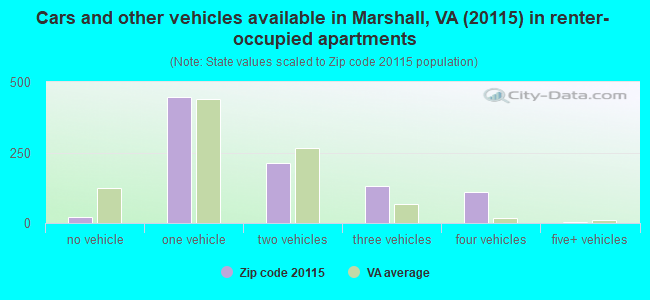
Houses and condos: 3,244 Renter-occupied apartments: 935
% of renters here:
31%
State:
33%
March 2022 cost of living index in zip code 20115: 132.6 (high, U.S. average is 100)
Land area: 95.2 sq. mi. Water area: 0.5 sq. mi.
Population density: 84 people per square mile
(very low).
OSM Map
General Map
Google Map
MSN Map
OSM Map
General Map
Google Map
MSN Map
OSM Map
General Map
Google Map
MSN Map
OSM Map
General Map
Google Map
MSN Map
Please wait while loading the map...
Real estate property taxes paid for housing units in 2022:
This zip code:
0.7% ($5,002)
Virginia:
0.7% ($2,617)
Median real estate property taxes paid for housing units with mortgages in 2022: $5,228 (0.7%) Median real estate property taxes paid for housing units with no mortgage in 2022: $4,141 (0.9%)
Business Search- 14 Million verified businesses
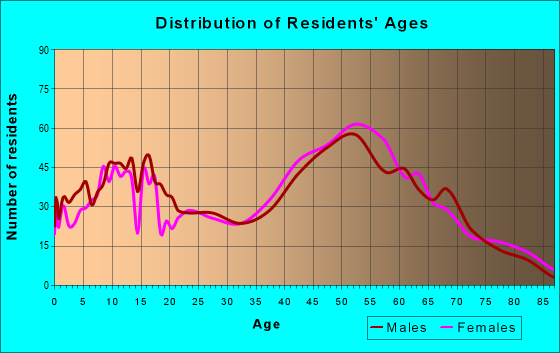
Males: 4,074
(51.0%)
Females: 3,922
(49.0%)
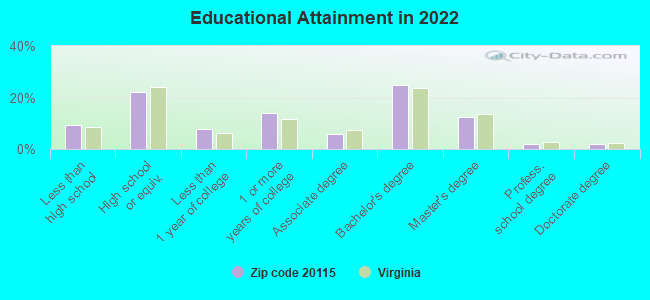
For population 25 years and over in 20115:
High school or higher: 90.1%
Bachelor's degree or higher: 40.4%
Graduate or professional degree: 15.8%
Unemployed: 3.2%
Mean travel time to work (commute): 35.2 minutes
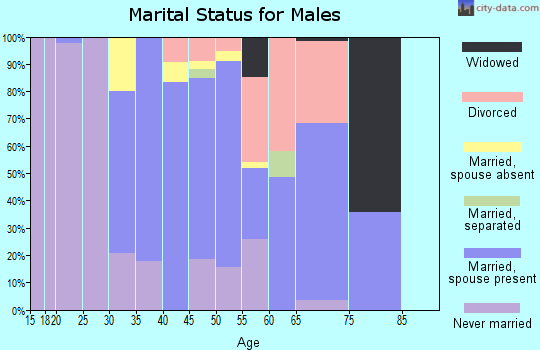
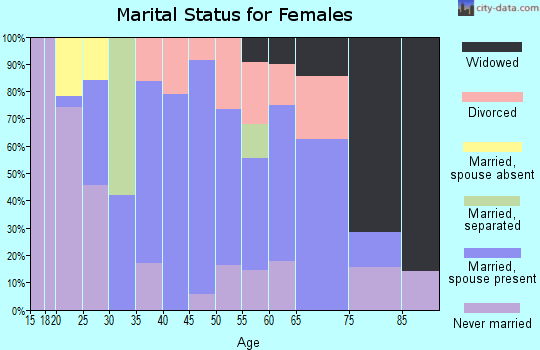
For population 15 years and over in 20115:
Never married: 27.7%
Now married: 55.5%
Separated: 0.2%
Widowed: 5.7%
Divorced: 10.9%
Zip code 20115 compared to state average:
Median household income above state average.
Median house value above state average.
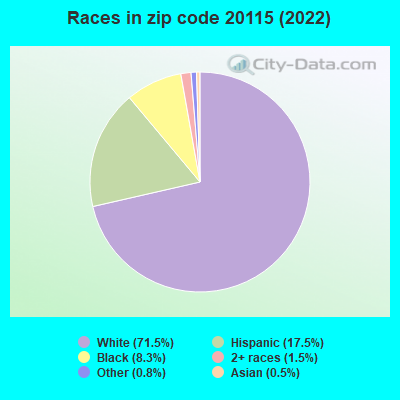
Black race population percentage below state average.
Hispanic race population percentage above state average.
Median age above state average.
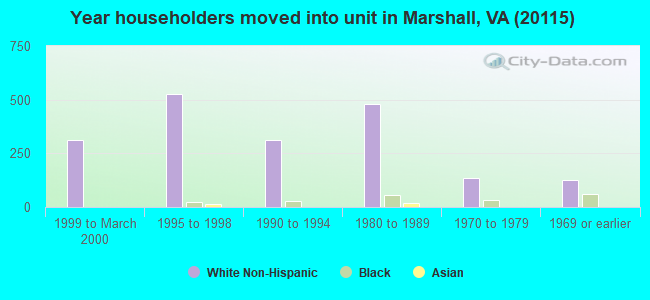
Length of stay since moving in significantly above state average.
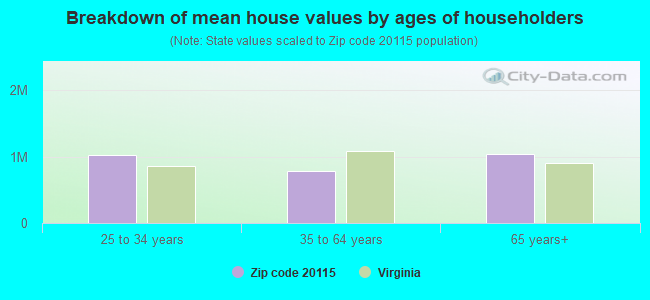
Estimated median house/condo value in 2022: $677,266
20115:
$677,266
Virginia:
$365,700
According to our research of Virginia and other state lists, there were 7 registered sex offenders living in 20115 zip code as of April 19, 2024. The ratio of all residents to sex offenders in zip code 20115 is 940 to 1. The ratio of registered sex offenders to all residents in this zip code is much lower than the state average.
Median resident age:
This zip code:
43.8 years
Virginia median age:
39.0 years
Average household size:
This zip code:
2.7 people
Virginia:
2.5 people
Averages for the 2020 tax year for zip code 20115, filed in 2021:
Average Adjusted Gross Income (AGI) in 2020: $112,857 (Individual Income Tax Returns)
Here:
$112,857
State:
$86,446
Salary/wage: $85,329 (reported on 79.9% of returns)
Here:
$85,329
State:
$71,185
(% of AGI for various income ranges: 1280.2% for AGIs below $25k, 3854.8% for AGIs $25k-50k, 6914.8% for AGIs $50k-75k, 10073.8% for AGIs $75k-100k, 19213.3% for AGIs $100k-200k, 88114.4% for AGIs over 200k)
Taxable interest for individuals: $3,014 (reported on 36.9% of returns)
This zip code:
$3,014
Virginia:
$1,805
(% of AGI for various income ranges: 18.4% for AGIs below $25k, 52.9% for AGIs $25k-50k, 36.5% for AGIs $50k-75k, 126.9% for AGIs $75k-100k, 214.4% for AGIs $100k-200k, 2157.8% for AGIs over 200k)
Ordinary dividends: $14,138 (reported on 26.2% of returns)
Here:
$14,138
State:
$8,327
(% of AGI for various income ranges: 58.0% for AGIs below $25k, 91.2% for AGIs $25k-50k, 116.1% for AGIs $50k-75k, 336.2% for AGIs $75k-100k, 529.4% for AGIs $100k-200k, 8493.3% for AGIs over 200k)
Net capital gain/loss in AGI: +$35,328 (reported on 23.8% of returns)
Here:
+$35,328
State:
+$24,644
(% of AGI for various income ranges: 27.0% for AGIs below $25k, 83.8% for AGIs $25k-50k, 80.9% for AGIs $50k-75k, 323.8% for AGIs $75k-100k, 713.9% for AGIs $100k-200k, 23691.1% for AGIs over 200k)
Profit/loss from business: +$22,298 (reported on 20.1% of returns)
Here:
+$22,298
State:
+$12,836
(% of AGI for various income ranges: 259.2% for AGIs below $25k, 362.1% for AGIs $25k-50k, 352.6% for AGIs $50k-75k, 296.9% for AGIs $75k-100k, 961.9% for AGIs $100k-200k, 6458.9% for AGIs over 200k)
Taxable individual retirement arrangement distribution: $26,019 (reported on 10.4% of returns)
20115:
$26,019
Virginia:
$21,535
(% of AGI for various income ranges: 36.6% for AGIs below $25k, 118.1% for AGIs $25k-50k, 146.5% for AGIs $50k-75k, 353.1% for AGIs $75k-100k, 940.0% for AGIs $100k-200k, 3445.6% for AGIs over 200k)
Self-employed (Keogh) retirement plans: $30,075 (reported on 1.3% of returns)
20115:
$30,075
Virginia:
$31,172
(% of AGI for various income ranges: 1336.7% for AGIs over 200k)
Total itemized deductions: $37,042 (reported on 21.5% of returns)
Here:
$37,042
State:
$33,287
(% of AGI for various income ranges: 371.2% for AGIs $25k-50k, 718.3% for AGIs $50k-75k, 921.2% for AGIs $75k-100k, 2324.2% for AGIs $100k-200k, 11838.9% for AGIs over 200k)
Charity contributions: $12,612 (reported on 17.1% of returns)
Here:
$12,612
State:
$10,381
(% of AGI for various income ranges: 38.6% for AGIs $25k-50k, 83.9% for AGIs $50k-75k, 101.9% for AGIs $75k-100k, 364.4% for AGIs $100k-200k, 5113.3% for AGIs over 200k)
Taxes paid: $8,783 (reported on 21.5% of returns)
20115:
$8,783
State:
$8,284
(% of AGI for various income ranges: 71.9% for AGIs $25k-50k, 161.3% for AGIs $50k-75k, 318.1% for AGIs $75k-100k, 718.9% for AGIs $100k-200k, 2056.7% for AGIs over 200k)
Earned income credit: $2,141 (reported on 9.7% of returns)
Here:
$2,141
State:
$2,214
(% of AGI for various income ranges: 69.4% for AGIs below $25k, 65.2% for AGIs $25k-50k)
Percentage of individuals using paid preparers for their 2020 taxes: 90.3%
Here:
90%
State:
92%
(% for various income ranges: 85.9% for AGIs below $25k, 91.4% for AGIs $25k-50k, 91.2% for AGIs $50k-75k, 92.6% for AGIs $75k-100k, 91.3% for AGIs $100k-200k, 93.8% for AGIs over 200k)
Averages for the 2012 tax year for zip code 20115, filed in 2013:
Average Adjusted Gross Income (AGI) in 2012: $102,253 (Individual Income Tax Returns)
Here:
$102,253
State:
$71,192
Salary/wage: $74,063 (reported on 84.0% of returns)
Here:
$74,063
State:
$59,229
(% of AGI for various income ranges: 78.2% for AGIs below $25k, 80.9% for AGIs $25k-50k, 75.6% for AGIs $50k-75k, 69.5% for AGIs $75k-100k, 76.2% for AGIs $100k-200k, 42.4% for AGIs over 200k)
Taxable interest for individuals: $3,515 (reported on 40.6% of returns)
This zip code:
$3,515
Virginia:
$1,600
(% of AGI for various income ranges: 1.0% for AGIs below $25k, 1.0% for AGIs $25k-50k, 0.8% for AGIs $50k-75k, 1.3% for AGIs $75k-100k, 0.6% for AGIs $100k-200k, 2.1% for AGIs over 200k)
Ordinary dividends: $12,066 (reported on 27.5% of returns)
Here:
$12,066
State:
$6,959
(% of AGI for various income ranges: 1.3% for AGIs below $25k, 1.9% for AGIs $25k-50k, 1.8% for AGIs $50k-75k, 1.9% for AGIs $75k-100k, 1.9% for AGIs $100k-200k, 4.9% for AGIs over 200k)
Net capital gain/loss in AGI: +$19,402 (reported on 21.3% of returns)
Here:
+$19,402
State:
+$16,672
(% of AGI for various income ranges: 0.2% for AGIs $25k-50k, 0.4% for AGIs $50k-75k, 1.2% for AGIs $75k-100k, 1.8% for AGIs $100k-200k, 7.6% for AGIs over 200k)
Profit/loss from business: +$15,045 (reported on 20.1% of returns)
Here:
+$15,045
State:
+$14,116
(% of AGI for various income ranges: 12.4% for AGIs below $25k, 4.8% for AGIs $25k-50k, 3.4% for AGIs $50k-75k, 5.0% for AGIs $75k-100k, 3.2% for AGIs $100k-200k, 1.3% for AGIs over 200k)
Taxable individual retirement arrangement distribution: $19,122 (reported on 11.1% of returns)
20115:
$19,122
Virginia:
$16,667
(% of AGI for various income ranges: 2.0% for AGIs below $25k, 2.6% for AGIs $25k-50k, 2.1% for AGIs $50k-75k, 2.6% for AGIs $75k-100k, 2.5% for AGIs $100k-200k, 1.6% for AGIs over 200k)
Self-employment retirement plans: $20,767 (reported on 1.2% of returns)
20115:
$20,767
Virginia:
$25,373
Total itemized deductions: $35,199 (20% of AGI, reported on 48.0% of returns)
Here:
$35,199
State:
$26,596
Here:
19.9% of AGI
State:
20.1% of AGI
(% of AGI for various income ranges: 13.0% for AGIs below $25k, 14.4% for AGIs $25k-50k, 16.7% for AGIs $50k-75k, 18.9% for AGIs $75k-100k, 19.2% for AGIs $100k-200k, 14.9% for AGIs over 200k)
Charity contributions: $6,709 (reported on 39.3% of returns)
Here:
$6,709
State:
$4,443
(% of AGI for various income ranges: 0.7% for AGIs below $25k, 1.0% for AGIs $25k-50k, 1.3% for AGIs $50k-75k, 1.7% for AGIs $75k-100k, 1.9% for AGIs $100k-200k, 3.8% for AGIs over 200k)
Taxes paid: $13,815 (reported on 48.0% of returns)
20115:
$13,815
State:
$9,951
(% of AGI for various income ranges: 2.4% for AGIs below $25k, 3.4% for AGIs $25k-50k, 4.9% for AGIs $50k-75k, 6.5% for AGIs $75k-100k, 7.7% for AGIs $100k-200k, 6.7% for AGIs over 200k)
Earned income credit: $2,032 (reported on 10.2% of returns)
Here:
$2,032
State:
$2,211
(% of AGI for various income ranges: 4.5% for AGIs below $25k, 0.8% for AGIs $25k-50k)
Percentage of individuals using paid preparers for their 2012 taxes: 50.0%
Here:
50%
State:
46%
(% for various income ranges: 42.9% for AGIs below $25k, 48.0% for AGIs $25k-50k, 51.6% for AGIs $50k-75k, 50.0% for AGIs $75k-100k, 56.9% for AGIs $100k-200k, 61.1% for AGIs over 200k)
Averages for the 2004 tax year for zip code 20115, filed in 2005:
Average Adjusted Gross Income (AGI) in 2004: $79,908 (Individual Income Tax Returns)
Here:
$79,908
State:
$56,704
Salary/wage: $64,657 (reported on 84.5% of returns)
Here:
$64,657
State:
$48,441
(% of AGI for various income ranges: 167.5% for AGIs below $10k, 77.4% for AGIs $10k-25k, 80.9% for AGIs $25k-50k, 76.1% for AGIs $50k-75k, 79.6% for AGIs $75k-100k, 61.8% for AGIs over 100k)
Taxable interest for individuals: $2,043 (reported on 55.8% of returns)
This zip code:
$2,043
Virginia:
$1,688
(% of AGI for various income ranges: 11.9% for AGIs below $10k, 3.1% for AGIs $10k-25k, 1.7% for AGIs $25k-50k, 1.7% for AGIs $50k-75k, 1.4% for AGIs $75k-100k, 1.2% for AGIs over 100k)
Taxable dividends: $6,478 (reported on 31.7% of returns)
Here:
$6,478
State:
$4,028
(% of AGI for various income ranges: 8.3% for AGIs below $10k, 1.2% for AGIs $10k-25k, 1.2% for AGIs $25k-50k, 2.1% for AGIs $50k-75k, 1.3% for AGIs $75k-100k, 3.2% for AGIs over 100k)
Net capital gain/loss: +$37,208 (reported on 25.1% of returns)
Here:
+$37,208
State:
+$14,375
(% of AGI for various income ranges: -1.0% for AGIs below $10k, -0.4% for AGIs $10k-25k, 0.2% for AGIs $25k-50k, 0.5% for AGIs $50k-75k, 2.1% for AGIs $75k-100k, 18.0% for AGIs over 100k)
Profit/loss from business: +$15,112 (reported on 17.1% of returns)
Here:
+$15,112
State:
+$13,342
(% of AGI for various income ranges: 35.0% for AGIs below $10k, 5.5% for AGIs $10k-25k, 5.8% for AGIs $25k-50k, 3.6% for AGIs $50k-75k, 2.0% for AGIs $75k-100k, 2.7% for AGIs over 100k)
IRA payment deduction: $2,989 (reported on 4.1% of returns)
20115:
$2,989
Virginia:
$2,943
(% of AGI for various income ranges: 0.4% for AGIs $25k-50k, 0.3% for AGIs $50k-75k, 0.2% for AGIs $75k-100k, 0.1% for AGIs over 100k)
Self-employed pension: $11,188 (reported on 1.5% of returns)
Here:
$11,188
Virginia:
$17,430
Total itemized deductions: $25,788 (20% of AGI, reported on 52.1% of returns)
Here:
$25,788
State:
$21,492
Here:
20.2% of AGI
State:
21.0% of AGI
(% of AGI for various income ranges: 33.4% for AGIs below $10k, 14.0% for AGIs $10k-25k, 14.6% for AGIs $25k-50k, 19.9% for AGIs $50k-75k, 19.2% for AGIs $75k-100k, 16.1% for AGIs over 100k)
Charity contributions deductions: $4,364 (3% of AGI, reported on 44.1% of returns)
Here:
$4,364
State:
$3,794
Here:
3.3% of AGI
State:
3.5% of AGI
(% of AGI for various income ranges: 1.0% for AGIs $10k-25k, 1.4% for AGIs $25k-50k, 2.1% for AGIs $50k-75k, 2.0% for AGIs $75k-100k, 2.8% for AGIs over 100k)
Total tax: $13,526 (reported on 83.3% of returns)
20115:
$13,526
State:
$9,537
(% of AGI for various income ranges: 5.5% for AGIs below $10k, 4.9% for AGIs $10k-25k, 7.9% for AGIs $25k-50k, 9.1% for AGIs $50k-75k, 10.2% for AGIs $75k-100k, 17.2% for AGIs over 100k)
Earned income credit: $1,750 (reported on 6.2% of returns)
Here:
$1,750
State:
$1,734
Percentage of individuals using paid preparers for their 2004 taxes: 51.0%
Here:
51%
State:
52%
(% for various income ranges: 39.4% for AGIs below $10k, 54.1% for AGIs $10k-25k, 49.4% for AGIs $25k-50k, 50.3% for AGIs $50k-75k, 54.1% for AGIs $75k-100k, 57.2% for AGIs over 100k)
Household received Food Stamps/SNAP in the past 12 months: 213 Household did not receive Food Stamps/SNAP in the past 12 months: 2,749
Women who had a birth in the past 12 months: 39 (41 now married, 0 unmarried) Women who did not have a birth in the past 12 months: 1,771 (758 now married, 1,013 unmarried)
Housing units in zip code 20115 with a mortgage: 1,372 (224 second mortgage, 189 both second mortgage and home equity loan) Houses without a mortgage: 103
Median monthly owner costs for units with a mortgage: $2,785 Median monthly owner costs for units without a mortgage: $558
Residents with income below the poverty level in 2022:
This zip code:
13.2%
Whole state:
10.6%
Residents with income below 50% of the poverty level in 2022:
This zip code:
10.6%
Whole state:
5.2%
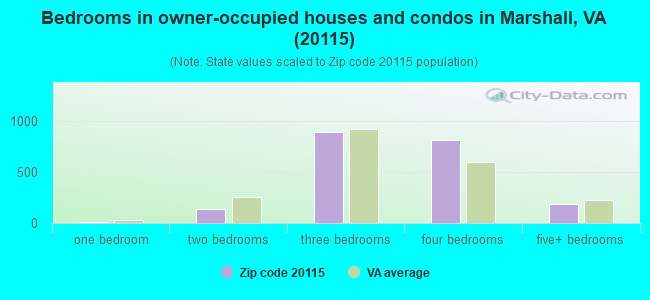
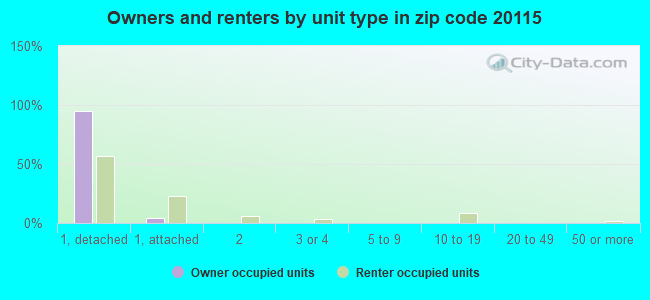
Median number of rooms in houses and condos:
Here:
7.9
State:
7.0
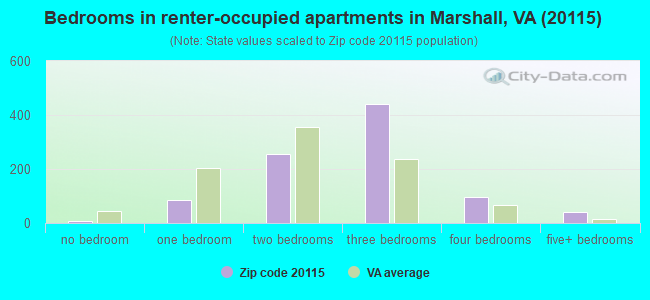
Median number of rooms in apartments:
Here:
5.2
State:
4.3
Notable locations in this zip code not listed on our city pages
Notable locations in zip code 20115: Jerrys Shop (A), Wilsons Store (B), Salem Station (C), Runnymeade Farm (D), Five Points (E), Cobbler Springs Farm (F), Oak Grove Meadows (G), Marshall Volunteer Rescue Squad Company 9 (H), Waveland (I), Frye House (J), Orlean Volunteer Fire and Rescue Department Company 11 (K), Marshall Volunteer Rescue Squad (L), Marshall Volunteer Fire Department Company 3 (M), The John Marshall Library (N). Display/hide their locations on the map
Churches in zip code 20115 include: Mount Olive Baptist Church (A), Marshall Methodist Episcopal Church (B), Orlean Methodist Episcopal Church (C), Saint Andrew Episcopal Church (D), Salem Baptist Church (E), Providence Church (F), Thumb Run Church (G), Wesley Chapel (H), Mount Nebo Church (I). Display/hide their locations on the map
Streams, rivers, and creeks: Wet and Dry Branch (A), West Branch Thumb Run (B), Tanner Branch (C), Strothers Branch (D), South Run (E), Rattle Branch (F), Poorhouse Branch (G), Horner Run (H), East Branch Thumb Run (I). Display/hide their locations on the map
Tourist attractions (not listed on the city page) : Fauquier Heritage (Historical Places & Services; 4110 Winchester Road) (1), Mosby Heritage Area (1461 Atoka Rd) (2). Display/hide their approximate locations on the map
980 married couples with children.
296 single-parent households (100 men, 196 women).
81.7% of residents of 20115 zip code speak English at home.
14.9% of residents speak Spanish at home (21% very well, 38% well, 21% not well, 20% not at all).
1.5% of residents speak other Indo-European language at home (76% very well, 24% well).
0.8% of residents speak Asian or Pacific Island language at home (97% very well, 3% well).
0.5% of residents speak other language at home (100% very well).
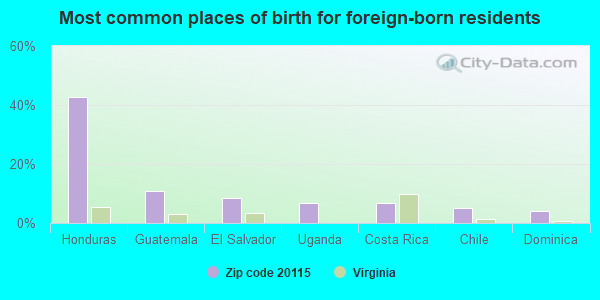
Foreign born population: 1,156 (14.5%) (25.2% of them are naturalized citizens)
This zip code:
14.5%
Whole state:
12.7%
43%Honduras
11%Guatemala
9%El Salvador
7%Uganda
7%Costa Rica
5%Chile
4%Dominica
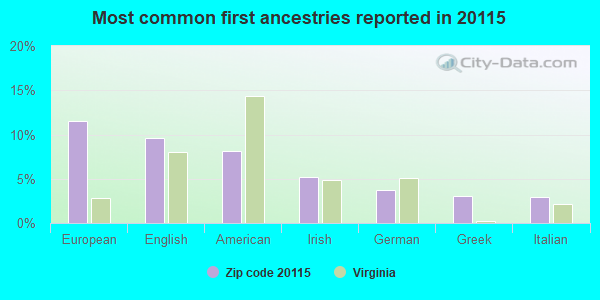
11%European
10%English
8%American
5%Irish
4%German
3%Greek
3%Italian
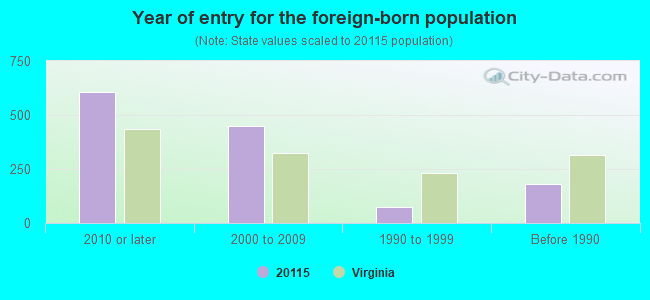
Year of entry for the foreign-born population
6082010 or later
4512000 to 2009
721990 to 1999
179Before 1990
Facilities with environmental interests located in this zip code:
CLAUDE THOMPSON ELEM. (3284 RECTORTOWN RD in MARSHALL, VA)
(National Center for Education Statistics) - STATE ID-0300120 Organizations: FAUQUIER COUNTY PUBLIC SCHOOLS (SCHOOL DISTRICT)
7-ELEVEN #18050 (710 MAIN STREET in MARSHALL, VA)
Small Quantity Generators, between 100 kg and 1000 kg of hazardous waste/month (Resource Conservation and Recovery Act (tracking hazardous waste)) - notification Organizations: OPERNAME (CONTACT/OPERATOR)
, SOUTHLAND CORPORATION THE (CONTACT/OWNER)
BELVOIR STATION SITE (STATE ROUTE 709 in MARSHALL, VA)
SUPERFUND (Superfund database)
Housing units lacking complete plumbing facilities: 1.0% Housing units lacking complete kitchen facilities: 1.1%
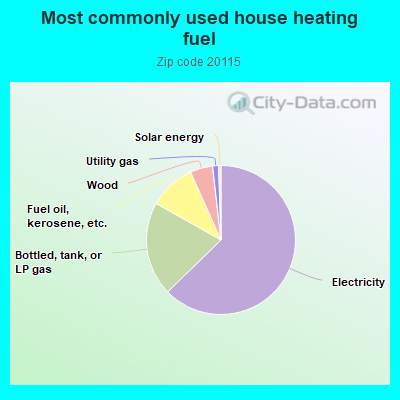
62.6%Electricity
20.4%Bottled, tank, or LP gas
10.1%Fuel oil, kerosene, etc.
4.9%Wood
1.3%Utility gas
0.5%Solar energy
Place of birth for U.S.-born residents:
This state: 3,558
Northeast: 564
Midwest: 525
South: 1,603
West: 474
60% of the 20115 zip code residents lived in the same house 5 years ago. Out of people who lived in different houses, 36% lived in this county. Out of people who lived in different counties, 50% lived in Virginia.
94% of the 20115 zip code residents lived in the same house 1 year ago. Out of people who lived in different houses, 22% moved from this county. Out of people who lived in different houses, 73% moved from different county within same state. Out of people who lived in different houses, 12% moved from different state.
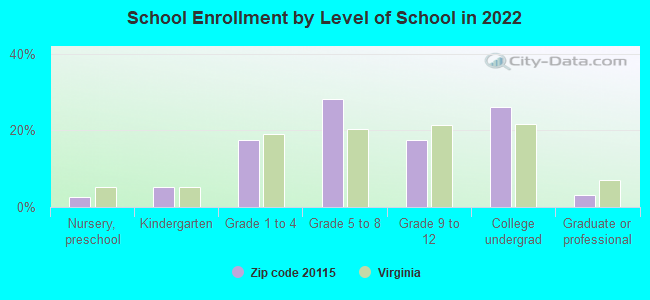
Private vs. public school enrollment:
Students in private schools in grades 1 to 8 (elementary and middle school): 45
Here:
7.0%
Virginia:
13.2%
Students in private schools in grades 9 to 12 (high school): 57
Here:
22.7%
Virginia:
10.2%
Students in private undergraduate colleges: 65
Here:
17.3%
Virginia:
18.7%
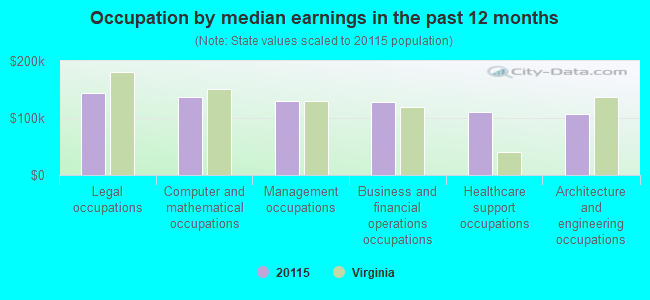
Occupation by median earnings in the past 12 months ($)
144,531Legal occupations
137,307Computer and mathematical occupations
130,529Management occupations
128,647Business and financial operations occupations
110,329Healthcare support occupations
107,443Architecture and engineering occupations
Companies with federal contracts located in this zip code (MARSHALL, VA):
TECHNOLOGY MANAGEMENT & INTERG (3800 RECTORTOWN RD; small business) : $2,097,927 in 38 contractsfrom 2000 to 2006
Contracts for ADP Telecommunications and Transmission Services by Department of Defense, Defense Information Systems Agency Signed by year:2000: $602,376; 2001: $1,452,156; 2002: -$72,030; 2003: $0; 2004: -$14,071; 2005: $112,396; 2006: $17,100.
Biggest contracts:
$288,430 with Department of Defense for ADP Telecommunications and Transmission Services. Signed on 2000-04-30. Completion date: 2005-03-09.
$288,430, same as above.Signed on 2000-04-30. Completion date: 2005-04-05.
$212,057, same as above.Signed on 2001-09-30. Completion date: 2003-07-19.
$193,620, same as above.Signed on 2001-09-30. Completion date: 2006-08-29.
A & M SUPPLY CORPORATION (4227 WHITING ROAD; small business) : $43,226 in 4 contractsfrom 2004 to 2005
$30,860 with Departmental Offices for Plywood and Veneer. Taking place in DC. Signed on 2004-09-24. Completion date: 2004-12-30.
$7,683 with Navy for Connectors, Electrical. Signed on 2005-07-22. Completion date: 2005-08-01.
$3,328 with Public Buildings Service for Woodworking Machines. Taking place in DC. Signed on 2004-09-03. Effective on 2004-06-29. Completion date: 2004-08-10.
$1,355, same as above.Signed on 2004-08-09. Completion date: 2004-08-10.
UNLIMITED AUTO BODY & COLLISIO (4195-A WHITING RD; small business)
$7,563 with Washington Headquarters Services for Maintenance, Repair and Rebuilding of Equipment -- Vehicular Equipment Components. Taking place in DC. Signed on 2004-03-03. Completion date: 2004-04-01.
AMERICAN BUILDING SPECIALTIES (7830 HILLTOP PLACE; small business)
$6,833 with Army for Plumbing Fixtures and Accessories. Taking place in MD. Signed on 2004-01-15. Completion date: 2004-01-08.
Top industries in this zip code by the number of employees in 2005:
Professional, Scientific, and Technical Services: Other Computer Related Services (100-249 employees: 1 establishment)
Construction: Commercial and Institutional Building Construction (50-99: 1)
Construction: New Single-Family Housing Construction (except Operative Builders) (20-49: 1, 5-9: 1, 1-4: 5)
Administrative and Support and Waste Management and Remediation Services: Landscaping Services (10-19: 1, 5-9: 4, 1-4: 3)
Administrative and Support and Waste Management and Remediation Services: Security Systems Services (except Locksmiths) (20-49: 1, 10-19: 1)
2002 - 2018 National Fire Incident Reporting System (NFIRS) incidents
Based on the data from the years 2002 - 2018 the average number of fires per year is 38. The highest number of fire incidents - 65 took place in 2007, and the least - 12 in 2002. The data has a rising trend.
When looking into fire subcategories, the most reports belonged to: Outside Fires (42.5%), and Structure Fires (36.0%).
Fire incident types reported to NFIRS in Zip Code 20115
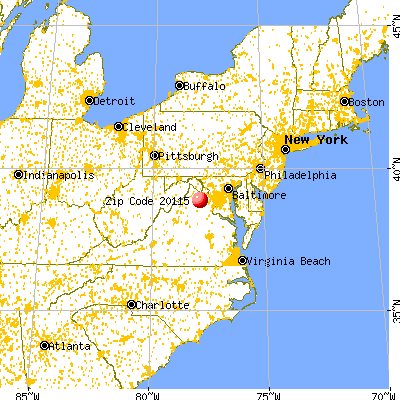


 Nearest zip codes: 22643, 22639, 20144, 20186, 20106, 22642.
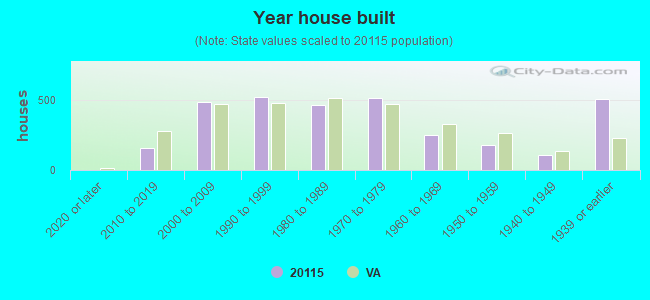


 Based on the data from the years 2002 - 2018 the average number of fires per year is 38. The highest number of fire incidents - 65 took place in 2007, and the least - 12 in 2002. The data has a rising trend.
 When looking into fire subcategories, the most reports belonged to: Outside Fires (42.5%), and Structure Fires (36.0%).