Estimated zip code population in 2022: 31,950 Zip code population in 2010: 28,498 Zip code population in 2000: 8,910
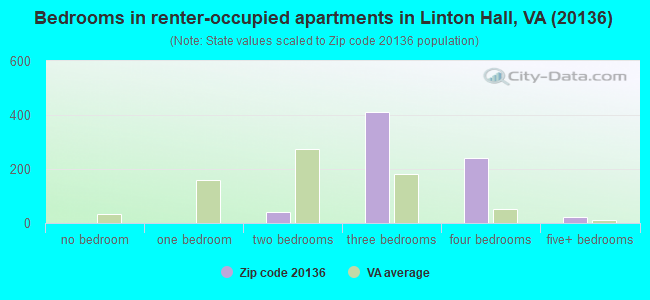
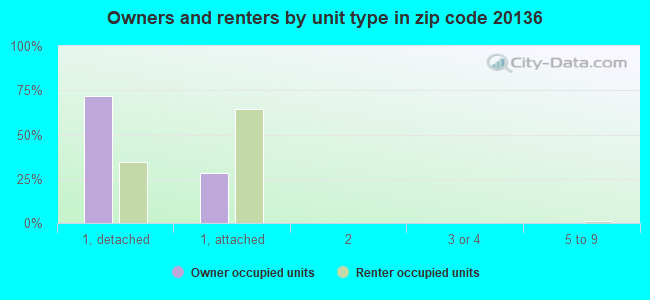
Houses and condos: 9,439 Renter-occupied apartments: 721
% of renters here:
8%
State:
33%
March 2022 cost of living index in zip code 20136: 165.6 (very high, U.S. average is 100)
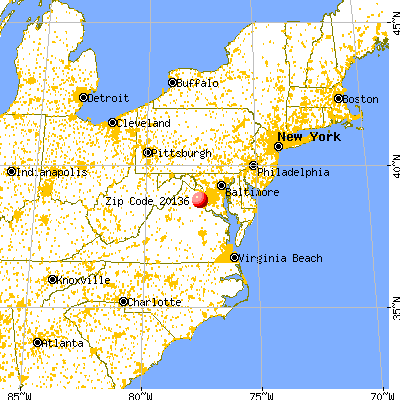
Land area: 14.7 sq. mi. Water area: 0.3 sq. mi.
Population density: 2,178 people per square mile
(low).
OSM Map
General Map
Google Map
MSN Map
OSM Map
General Map
Google Map
MSN Map
OSM Map
General Map
Google Map
MSN Map
OSM Map
General Map
Google Map
MSN Map
Please wait while loading the map...
Real estate property taxes paid for housing units in 2022:
This zip code:
0.9% ($5,425)
Virginia:
0.7% ($2,617)
Median real estate property taxes paid for housing units with mortgages in 2022: $5,468 (0.9%) Median real estate property taxes paid for housing units with no mortgage in 2022: $5,158 (0.9%)
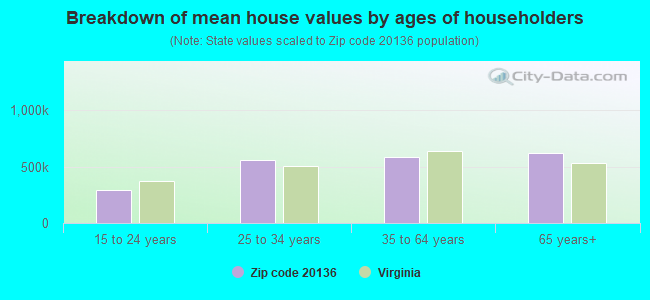
Estimated median house/condo value in 2022: $599,455
20136:
$599,455
Virginia:
$365,700
According to our research of Virginia and other state lists, there were 17 registered sex offenders living in 20136 zip code as of April 23, 2024. The ratio of all residents to sex offenders in zip code 20136 is 1,822 to 1. The ratio of registered sex offenders to all residents in this zip code is much lower than the state average.
Median resident age:
This zip code:
37.1 years
Virginia median age:
39.0 years
Average household size:
This zip code:
3.4 people
Virginia:
2.5 people
Averages for the 2020 tax year for zip code 20136, filed in 2021:
Average Adjusted Gross Income (AGI) in 2020: $106,046 (Individual Income Tax Returns)
Here:
$106,046
State:
$86,446
Salary/wage: $99,710 (reported on 88.9% of returns)
Here:
$99,710
State:
$71,185
(% of AGI for various income ranges: 1105.4% for AGIs below $25k, 3784.5% for AGIs $25k-50k, 6964.8% for AGIs $50k-75k, 10029.8% for AGIs $75k-100k, 21578.3% for AGIs $100k-200k, 64917.3% for AGIs over 200k)
Taxable interest for individuals: $846 (reported on 35.1% of returns)
This zip code:
$846
Virginia:
$1,805
(% of AGI for various income ranges: 8.2% for AGIs below $25k, 13.6% for AGIs $25k-50k, 33.4% for AGIs $50k-75k, 38.0% for AGIs $75k-100k, 72.2% for AGIs $100k-200k, 178.4% for AGIs over 200k)
Ordinary dividends: $2,655 (reported on 23.6% of returns)
Here:
$2,655
State:
$8,327
(% of AGI for various income ranges: 12.2% for AGIs below $25k, 32.5% for AGIs $25k-50k, 54.2% for AGIs $50k-75k, 61.1% for AGIs $75k-100k, 120.1% for AGIs $100k-200k, 553.6% for AGIs over 200k)
Net capital gain/loss in AGI: +$9,233 (reported on 22.2% of returns)
Here:
+$9,233
State:
+$24,644
(% of AGI for various income ranges: 12.4% for AGIs below $25k, 48.4% for AGIs $25k-50k, 76.3% for AGIs $50k-75k, 98.4% for AGIs $75k-100k, 274.9% for AGIs $100k-200k, 2723.9% for AGIs over 200k)
Profit/loss from business: +$12,977 (reported on 19.6% of returns)
Here:
+$12,977
State:
+$12,836
(% of AGI for various income ranges: 149.3% for AGIs below $25k, 276.2% for AGIs $25k-50k, 231.4% for AGIs $50k-75k, 261.3% for AGIs $75k-100k, 372.5% for AGIs $100k-200k, 2000.7% for AGIs over 200k)
Taxable individual retirement arrangement distribution: $22,470 (reported on 5.7% of returns)
20136:
$22,470
Virginia:
$21,535
(% of AGI for various income ranges: 20.0% for AGIs below $25k, 75.9% for AGIs $25k-50k, 129.4% for AGIs $50k-75k, 170.2% for AGIs $75k-100k, 308.9% for AGIs $100k-200k, 823.9% for AGIs over 200k)
Self-employed (Keogh) retirement plans: $16,689 (reported on 0.6% of returns)
20136:
$16,689
Virginia:
$31,172
(% of AGI for various income ranges: 20.9% for AGIs $100k-200k, 140.3% for AGIs over 200k)
Total itemized deductions: $29,389 (reported on 29.3% of returns)
Here:
$29,389
State:
$33,287
(% of AGI for various income ranges: 42.9% for AGIs below $25k, 310.4% for AGIs $25k-50k, 805.9% for AGIs $50k-75k, 1356.5% for AGIs $75k-100k, 2262.3% for AGIs $100k-200k, 5350.0% for AGIs over 200k)
Charity contributions: $5,839 (reported on 23.4% of returns)
Here:
$5,839
State:
$10,381
(% of AGI for various income ranges: 2.3% for AGIs below $25k, 29.7% for AGIs $25k-50k, 85.8% for AGIs $50k-75k, 154.3% for AGIs $75k-100k, 339.0% for AGIs $100k-200k, 1116.6% for AGIs over 200k)
Taxes paid: $9,169 (reported on 29.3% of returns)
20136:
$9,169
State:
$8,284
(% of AGI for various income ranges: 10.4% for AGIs below $25k, 75.9% for AGIs $25k-50k, 242.3% for AGIs $50k-75k, 440.9% for AGIs $75k-100k, 745.8% for AGIs $100k-200k, 1569.6% for AGIs over 200k)
Earned income credit: $2,096 (reported on 6.6% of returns)
Here:
$2,096
State:
$2,214
(% of AGI for various income ranges: 48.9% for AGIs below $25k, 55.9% for AGIs $25k-50k, 1.1% for AGIs $50k-75k)
Percentage of individuals using paid preparers for their 2020 taxes: 93.3%
Here:
93%
State:
92%
(% for various income ranges: 92.3% for AGIs below $25k, 94.4% for AGIs $25k-50k, 91.3% for AGIs $50k-75k, 93.0% for AGIs $75k-100k, 93.8% for AGIs $100k-200k, 94.9% for AGIs over 200k)
Averages for the 2012 tax year for zip code 20136, filed in 2013:
Average Adjusted Gross Income (AGI) in 2012: $96,524 (Individual Income Tax Returns)
Here:
$96,524
State:
$71,192
Salary/wage: $90,252 (reported on 92.5% of returns)
Here:
$90,252
State:
$59,229
(% of AGI for various income ranges: 85.1% for AGIs below $25k, 84.7% for AGIs $25k-50k, 86.9% for AGIs $50k-75k, 88.8% for AGIs $75k-100k, 91.6% for AGIs $100k-200k, 75.3% for AGIs over 200k)
Taxable interest for individuals: $627 (reported on 40.8% of returns)
This zip code:
$627
Virginia:
$1,600
(% of AGI for various income ranges: 0.9% for AGIs below $25k, 0.4% for AGIs $25k-50k, 0.4% for AGIs $50k-75k, 0.4% for AGIs $75k-100k, 0.2% for AGIs $100k-200k, 0.3% for AGIs over 200k)
Ordinary dividends: $2,138 (reported on 23.4% of returns)
Here:
$2,138
State:
$6,959
(% of AGI for various income ranges: 1.5% for AGIs below $25k, 0.6% for AGIs $25k-50k, 0.4% for AGIs $50k-75k, 0.4% for AGIs $75k-100k, 0.3% for AGIs $100k-200k, 0.9% for AGIs over 200k)
Net capital gain/loss in AGI: +$4,497 (reported on 17.4% of returns)
Here:
+$4,497
State:
+$16,672
(% of AGI for various income ranges: 0.2% for AGIs $50k-75k, 0.2% for AGIs $75k-100k, 0.2% for AGIs $100k-200k, 2.7% for AGIs over 200k)
Profit/loss from business: +$11,690 (reported on 16.7% of returns)
Here:
+$11,690
State:
+$14,116
(% of AGI for various income ranges: 7.0% for AGIs below $25k, 5.2% for AGIs $25k-50k, 2.5% for AGIs $50k-75k, 1.5% for AGIs $75k-100k, 1.5% for AGIs $100k-200k, 2.1% for AGIs over 200k)
Taxable individual retirement arrangement distribution: $16,712 (reported on 6.4% of returns)
20136:
$16,712
Virginia:
$16,667
(% of AGI for various income ranges: 1.5% for AGIs below $25k, 1.6% for AGIs $25k-50k, 1.1% for AGIs $50k-75k, 1.2% for AGIs $75k-100k, 0.9% for AGIs $100k-200k, 1.5% for AGIs over 200k)
Self-employment retirement plans: $19,483 (reported on 0.5% of returns)
20136:
$19,483
Virginia:
$25,373
(% of AGI for various income ranges: 0.3% for AGIs over 200k)
Total itemized deductions: $29,084 (22% of AGI, reported on 64.5% of returns)
Here:
$29,084
State:
$26,596
Here:
22.2% of AGI
State:
20.1% of AGI
(% of AGI for various income ranges: 14.8% for AGIs below $25k, 16.8% for AGIs $25k-50k, 23.3% for AGIs $50k-75k, 22.1% for AGIs $75k-100k, 20.6% for AGIs $100k-200k, 15.6% for AGIs over 200k)
Charity contributions: $3,016 (reported on 52.2% of returns)
Here:
$3,016
State:
$4,443
(% of AGI for various income ranges: 0.8% for AGIs below $25k, 1.4% for AGIs $25k-50k, 1.8% for AGIs $50k-75k, 1.7% for AGIs $75k-100k, 1.7% for AGIs $100k-200k, 1.6% for AGIs over 200k)
Taxes paid: $10,694 (reported on 64.5% of returns)
20136:
$10,694
State:
$9,951
(% of AGI for various income ranges: 2.8% for AGIs below $25k, 4.2% for AGIs $25k-50k, 6.7% for AGIs $50k-75k, 7.2% for AGIs $75k-100k, 7.9% for AGIs $100k-200k, 6.8% for AGIs over 200k)
Earned income credit: $2,065 (reported on 6.1% of returns)
Here:
$2,065
State:
$2,211
(% of AGI for various income ranges: 3.9% for AGIs below $25k, 0.9% for AGIs $25k-50k)
Percentage of individuals using paid preparers for their 2012 taxes: 40.8%
Here:
41%
State:
46%
(% for various income ranges: 39.7% for AGIs below $25k, 47.6% for AGIs $25k-50k, 43.1% for AGIs $50k-75k, 39.3% for AGIs $75k-100k, 37.7% for AGIs $100k-200k, 46.4% for AGIs over 200k)
Averages for the 2004 tax year for zip code 20136, filed in 2005:
Average Adjusted Gross Income (AGI) in 2004: $79,891 (Individual Income Tax Returns)
Here:
$79,891
State:
$56,704
Salary/wage: $74,496 (reported on 93.9% of returns)
Here:
$74,496
State:
$48,441
(% of AGI for various income ranges: 119.9% for AGIs below $10k, 82.9% for AGIs $10k-25k, 88.5% for AGIs $25k-50k, 90.4% for AGIs $50k-75k, 93.5% for AGIs $75k-100k, 84.5% for AGIs over 100k)
Taxable interest for individuals: $661 (reported on 57.5% of returns)
This zip code:
$661
Virginia:
$1,688
(% of AGI for various income ranges: 2.8% for AGIs below $10k, 1.0% for AGIs $10k-25k, 0.8% for AGIs $25k-50k, 0.7% for AGIs $50k-75k, 0.4% for AGIs $75k-100k, 0.4% for AGIs over 100k)
Taxable dividends: $1,135 (reported on 27.2% of returns)
Here:
$1,135
State:
$4,028
(% of AGI for various income ranges: 2.6% for AGIs below $10k, 0.6% for AGIs $10k-25k, 0.3% for AGIs $25k-50k, 0.4% for AGIs $50k-75k, 0.4% for AGIs $75k-100k, 0.4% for AGIs over 100k)
Net capital gain/loss: +$9,142 (reported on 23.7% of returns)
Here:
+$9,142
State:
+$14,375
(% of AGI for various income ranges: -1.1% for AGIs below $10k, -0.3% for AGIs $10k-25k, -0.2% for AGIs $25k-50k, 0.5% for AGIs $50k-75k, 0.5% for AGIs $75k-100k, 4.6% for AGIs over 100k)
Profit/loss from business: +$11,620 (reported on 17.6% of returns)
Here:
+$11,620
State:
+$13,342
(% of AGI for various income ranges: 2.8% for AGIs below $10k, 8.5% for AGIs $10k-25k, 4.4% for AGIs $25k-50k, 2.5% for AGIs $50k-75k, 1.7% for AGIs $75k-100k, 2.4% for AGIs over 100k)
IRA payment deduction: $2,539 (reported on 3.1% of returns)
20136:
$2,539
Virginia:
$2,943
(% of AGI for various income ranges: 0.4% for AGIs $10k-25k, 0.2% for AGIs $25k-50k, 0.2% for AGIs $50k-75k, 0.1% for AGIs $75k-100k, 0.1% for AGIs over 100k)
Self-employed pension: $13,741 (reported on 0.7% of returns)
Here:
$13,741
Virginia:
$17,430
Total itemized deductions: $25,407 (26% of AGI, reported on 72.9% of returns)
Here:
$25,407
State:
$21,492
Here:
25.6% of AGI
State:
21.0% of AGI
(% of AGI for various income ranges: 18.5% for AGIs below $10k, 21.0% for AGIs $10k-25k, 24.8% for AGIs $25k-50k, 28.5% for AGIs $50k-75k, 26.4% for AGIs $75k-100k, 20.6% for AGIs over 100k)
Charity contributions deductions: $2,540 (2% of AGI, reported on 62.6% of returns)
Here:
$2,540
State:
$3,794
Here:
2.5% of AGI
State:
3.5% of AGI
(% of AGI for various income ranges: 1.2% for AGIs below $10k, 1.8% for AGIs $10k-25k, 2.0% for AGIs $25k-50k, 2.2% for AGIs $50k-75k, 2.1% for AGIs $75k-100k, 1.9% for AGIs over 100k)
Total tax: $10,098 (reported on 88.2% of returns)
20136:
$10,098
State:
$9,537
(% of AGI for various income ranges: 4.1% for AGIs below $10k, 5.0% for AGIs $10k-25k, 6.9% for AGIs $25k-50k, 7.6% for AGIs $50k-75k, 8.2% for AGIs $75k-100k, 13.9% for AGIs over 100k)
Earned income credit: $1,551 (reported on 4.8% of returns)
Here:
$1,551
State:
$1,734
Percentage of individuals using paid preparers for their 2004 taxes: 44.9%
Here:
45%
State:
52%
(% for various income ranges: 37.8% for AGIs below $10k, 48.9% for AGIs $10k-25k, 49.4% for AGIs $25k-50k, 45.9% for AGIs $50k-75k, 42.1% for AGIs $75k-100k, 44.9% for AGIs over 100k)
Likely homosexual households (counted as self-reported same-sex unmarried-partner households)
Lesbian couples: 0.1% of all households
Gay men: 0.0% of all households
Household received Food Stamps/SNAP in the past 12 months: 102 Household did not receive Food Stamps/SNAP in the past 12 months: 9,102
Women who had a birth in the past 12 months: 278 (227 now married, 52 unmarried) Women who did not have a birth in the past 12 months: 7,781 (4,704 now married, 3,022 unmarried)
Housing units in zip code 20136 with a mortgage: 7,497 (773 second mortgage, 33 home equity loan, 552 both second mortgage and home equity loan) Houses without a mortgage: 46
Median monthly owner costs for units with a mortgage: $2,729 Median monthly owner costs for units without a mortgage: $748
Residents with income below the poverty level in 2022:
This zip code:
1.0%
Whole state:
10.6%
Residents with income below 50% of the poverty level in 2022:
This zip code:
0.5%
Whole state:
5.2%
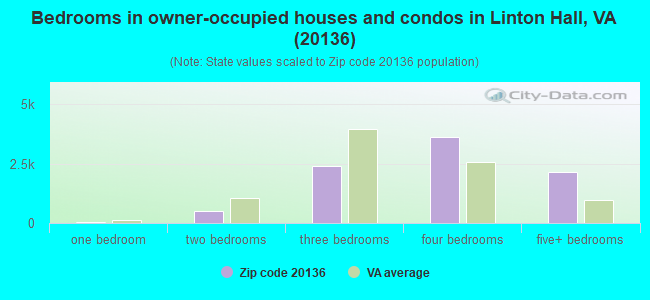
Median number of rooms in houses and condos:
Here:
10.0
State:
7.0
Median number of rooms in apartments:
Here:
6.8
State:
4.3
Notable locations in this zip code not listed on our city pages
Notable locations in zip code 20136: Gainesford Industrial Park (A), Rosemont (B), Nokesville Volunteer Fire and Rescue Department Station 25 (C). Display/hide their locations on the map
Churches in zip code 20136 include: Brentsville Presbyterian Church (A), New Hope Baptist Church (B), Saint James Church (C). Display/hide their locations on the map
8,257 married couples with children.
756 single-parent households (150 men, 606 women).
76.1% of residents of 20136 zip code speak English at home.
9.8% of residents speak Spanish at home (74% very well, 11% well, 14% not well, 1% not at all).
6.2% of residents speak other Indo-European language at home (66% very well, 26% well, 6% not well, 2% not at all).
4.9% of residents speak Asian or Pacific Island language at home (58% very well, 28% well, 13% not well, 1% not at all).
2.8% of residents speak other language at home (82% very well, 8% well, 7% not well, 2% not at all).
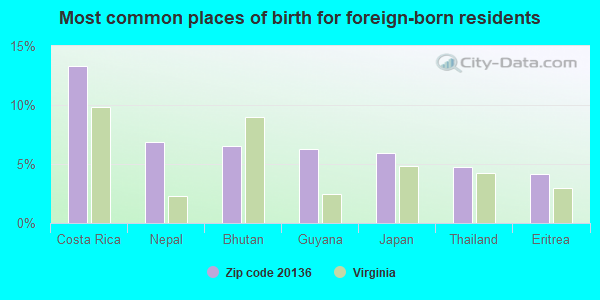
Foreign born population: 5,646 (17.7%) (74.8% of them are naturalized citizens)
This zip code:
17.7%
Whole state:
12.7%
13%Costa Rica
7%Nepal
7%Bhutan
6%Guyana
6%Japan
5%Thailand
4%Eritrea
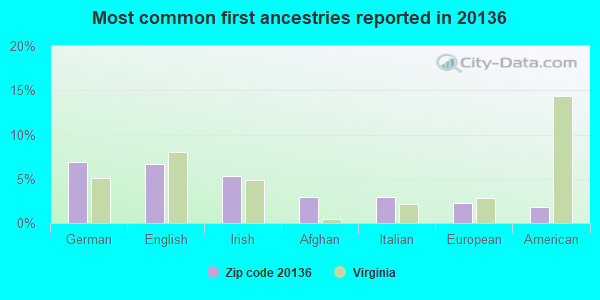
7%German
7%English
5%Irish
3%Afghan
3%Italian
2%European
2%American
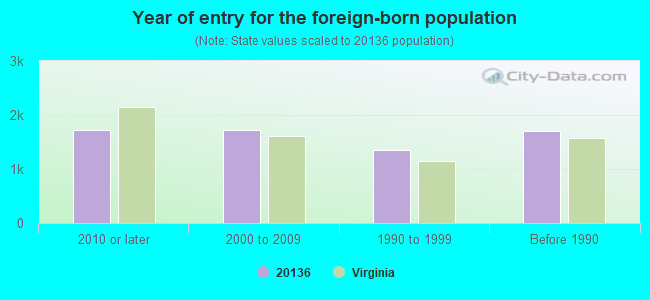
Year of entry for the foreign-born population
1,7242010 or later
1,7242000 to 2009
1,3431990 to 1999
1,706Before 1990
Facilities with environmental interests located in this zip code:
BRISTOW RUN ELEM (8990 WORTHINGTON DR in BRISTOW, VA)
(National Center for Education Statistics) - STATE ID-0750860 Organizations: PRINCE WILLIAM COUNTY PUBLIC SCHOOLS (SCHOOL DISTRICT)
CEDAR POINT ELEM. (12601 BRAEMAR PARKWAY in BRISTOW, VA)
(National Center for Education Statistics) - STATE ID-0750900 Organizations: PRINCE WILLIAM COUNTY PUBLIC SCHOOLS (SCHOOL DISTRICT)
Housing units lacking complete plumbing facilities: 0.3% Housing units lacking complete kitchen facilities: 0.3%
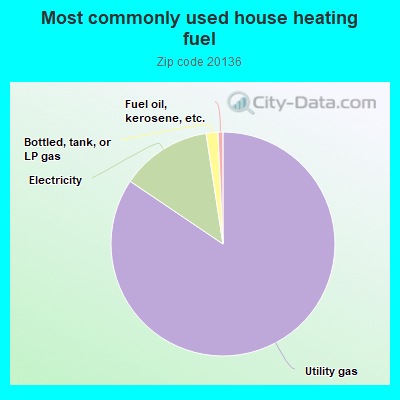
84.2%Utility gas
13.1%Electricity
1.7%Bottled, tank, or LP gas
0.7%Fuel oil, kerosene, etc.
Place of birth for U.S.-born residents:
This state: 12,851
Northeast: 3,662
Midwest: 2,345
South: 4,573
West: 2,017
20% of the 20136 zip code residents lived in the same house 5 years ago. Out of people who lived in different houses, 26% lived in this county. Out of people who lived in different counties, 50% lived in Virginia.
91% of the 20136 zip code residents lived in the same house 1 year ago. Out of people who lived in different houses, 49% moved from this county. Out of people who lived in different houses, 33% moved from different county within same state. Out of people who lived in different houses, 13% moved from different state. Out of people who lived in different houses, 4% moved from abroad.
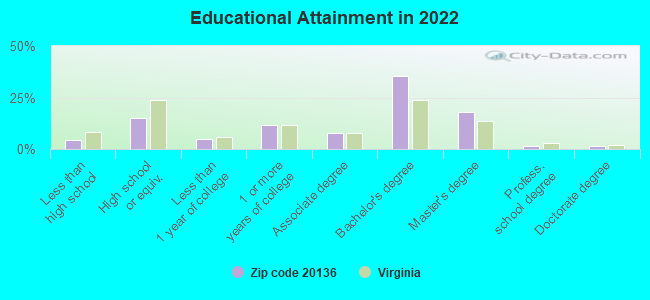
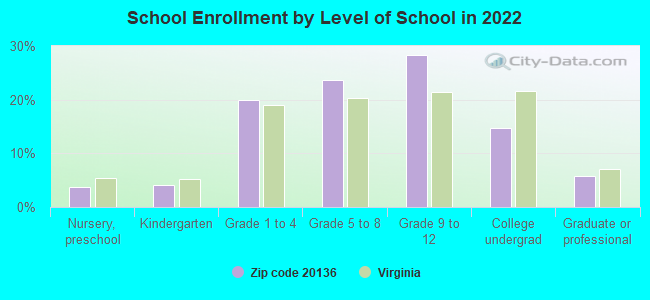
Private vs. public school enrollment:
Students in private schools in grades 1 to 8 (elementary and middle school): 481
Here:
10.8%
Virginia:
13.2%
Students in private schools in grades 9 to 12 (high school): 155
Here:
5.3%
Virginia:
10.2%
Students in private undergraduate colleges: 200
Here:
13.2%
Virginia:
18.7%
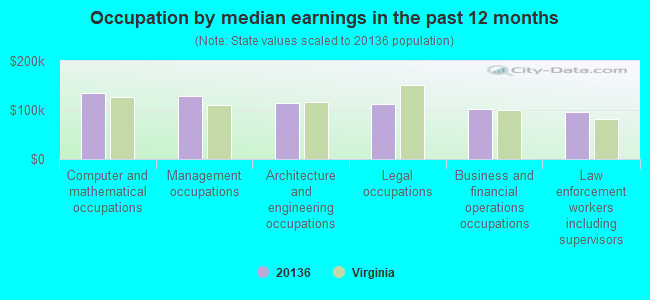
Occupation by median earnings in the past 12 months ($)
135,049Computer and mathematical occupations
128,569Management occupations
113,666Architecture and engineering occupations
111,792Legal occupations
102,547Business and financial operations occupations
95,540Law enforcement workers including supervisors
Companies with federal contracts located in this zip code (BRISTOW, VA):
INDEPENDENT SYSTEMS INC (10095 BROADSWORD DR; small business) : $1,514,215 in 22 contractsfrom 2004 to 2005
Contracts for Miscellaneous Construction Equipment, Tableware, Warehouse Trucks and Tractors, Self-Propelled, Trailers, and moreby Army, Federal Supply Service, Department of Defense, Navy, and others Signed by year:2000: $0; 2001: $0; 2002: $0; 2003: $0; 2004: $1,300,337; 2005: $213,878; 2006: $0.
Biggest contracts:
$761,850 with Army for Miscellaneous Construction Equipment. Signed on 2004-09-30. Completion date: 2007-12-31.
$254,200, same as above.Signed on 2004-09-27. Completion date: 2007-12-31.
$178,290, same as above.Signed on 2005-01-21. Completion date: 2007-12-31.
$145,500 with Federal Supply Service for Tableware. Taking place in SC. Signed on 2004-06-15. Completion date: 2004-09-16.
FRANKLIN MOTORCOACH, INC (7920 GAINSFORD COURT; small business) : $182,586 in 20 contractsfrom 2001 to 2003
Contracts for Motor Passenger Services, Passenger Motor Vehicles, Passenger Motor Charter Service by Army Signed by year:2000: $0; 2001: $73,595; 2002: $57,254; 2003: $51,737; 2004: $0; 2005: $0; 2006: $0.
Biggest contracts:
$45,000 with Army for Motor Passenger Services. Signed on 2001-03-28. Completion date: 2001-07-27.
$41,155 with Army for Passenger Motor Vehicles. Signed on 2003-05-09. Completion date: 2003-09-30.
$24,000 with Army for Motor Passenger Services. Signed on 2002-04-03. Completion date: 2002-06-07.
$10,850, same as above.Signed on 2002-01-11. Completion date: 2002-06-07.
IMAGE CONTROL INC (9797 RUNNER STONE PLACE; small business) : $53,707 in 3 contractsfrom 2001 to 2003
$38,600 with Navy for Laboratory Equipment and Supplies. Signed on 2001-03-01. Completion date: 2001-03-26.
$7,920 with Navy for Maintenance, Repair and Rebuilding of Equipment -- Miscellaneous. Signed on 2003-06-26. Completion date: 2004-09-30.
$7,187, same as above.Signed on 2002-07-31. Completion date: 2003-09-30.
FOMIN, PAVEL (12148 FORMBY ST; small business) : $8,835 in 3 contractsfrom 2004 to 2005
$7,788 with Army for Engineering and Technical Services. Signed on 2004-05-06. Completion date: 2004-05-06.
$2,998, same as above.Signed on 2004-08-23. Completion date: 2005-02-01.
-$1,951, same as above.Signed on 2005-12-14. Completion date: 2005-12-14.
SCENIC AMERICA INC (10169 PIPER LN; small business)
$4,200 with Army for Passenger Motor Charter Service. Signed on 2006-02-03. Completion date: 2006-03-14.
CELLAR DOOR AMPHITHEATER, INC (7800 CELLAR DOOR DR) : -$8,000 in 2 contractsin 2004
$0 with Navy for Lease or Rental of Facilities -- Conference Space and Facilities. Signed on 2004-06-18. Completion date: 2004-09-30.
-$8,000, same as above.Signed on 2004-06-18. Completion date: 2004-09-30.
Top industries in this zip code by the number of employees in 2005:
Construction: Highway, Street, and Bridge Construction (100-249 employees: 1 establishment, 20-49 employees: 1 establishment)
Arts, Entertainment, and Recreation: Golf Courses and Country Clubs (100-249: 1)
Other Services (except Public Administration): Religious Organizations (50-99: 1, 20-49: 1, 5-9: 1, 1-4: 4)
Health Care and Social Assistance: Other Residential Care Facilities (50-99: 1)
Professional, Scientific, and Technical Services: Public Relations Agencies (50-99: 1)
Administrative and Support and Waste Management and Remediation Services: Landscaping Services (20-49: 1, 5-9: 3, 1-4: 2)
Administrative and Support and Waste Management and Remediation Services: Janitorial Services (20-49: 1, 5-9: 2, 1-4: 3)
Health Care and Social Assistance: Child Day Care Services (20-49: 1, 1-4: 5)
People in group quarters in 2010:
43 people in group homes for juveniles (non-correctional)
32 people in emergency and transitional shelters (with sleeping facilities) for people experiencing homelessness
30 people in other noninstitutional facilities
18 people in workers' group living quarters and job corps centers
People in group quarters in 2000:
57 people in other noninstitutional group quarters
46 people in religious group quarters
Fatal accident statistics in 2014:
Fatal accident count: 1
Vehicles involved in fatal accidents: 1
Fatal accidents caused by drunken drivers: 0
Fatalities: 1
Persons involved in fatal accidents: 1
Pedestrians involved in fatal accidents: 1
Fatal accident statistics in 2012:
Fatal accident count: 1
Vehicles involved in fatal accidents: 2
Fatal accidents caused by drunken drivers: 0
Fatalities: 1
Persons involved in fatal accidents: 3
Pedestrians involved in fatal accidents: 0
Home Mortgage Disclosure Act Aggregated Statistics For Year 2009 (Based on 4 partial tracts)
A) FHA, FSA/RHS & VA Home Purchase Loans
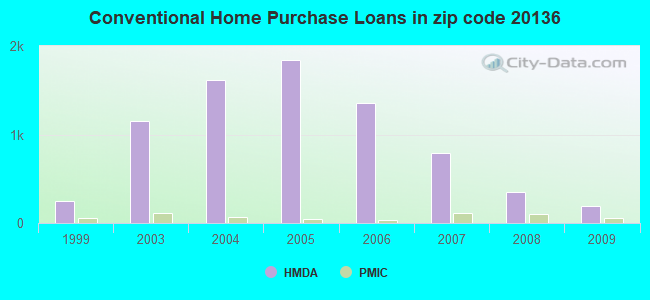
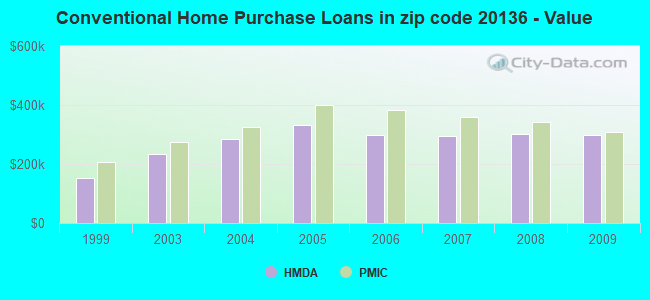
B) Conventional Home Purchase Loans
C) Refinancings
D) Home Improvement Loans
F) Non-occupant Loans on < 5 Family Dwellings (A B C & D)
G) Loans On Manufactured Home Dwelling (A B C & D)
Number
Average Value
Number
Average Value
Number
Average Value
Number
Average Value
Number
Average Value
Number
Average Value
LOANS ORIGINATED
378
$341,183
196
$298,933
693
$313,050
21
$85,403
23
$232,023
1
$372,120
APPLICATIONS APPROVED, NOT ACCEPTED
15
$338,913
18
$268,579
43
$343,159
2
$9,760
1
$297,620
0
$0
APPLICATIONS DENIED
29
$314,574
19
$250,027
239
$349,363
15
$73,273
11
$253,387
0
$0
APPLICATIONS WITHDRAWN
55
$332,629
42
$332,572
189
$336,233
3
$58,953
10
$288,892
0
$0
FILES CLOSED FOR INCOMPLETENESS
5
$299,918
5
$338,196
49
$354,098
1
$111,280
1
$314,840
0
$0
Aggregated Statistics For Year 2008 (Based on 4 partial tracts)
A) FHA, FSA/RHS & VA Home Purchase Loans
B) Conventional Home Purchase Loans
C) Refinancings
D) Home Improvement Loans
F) Non-occupant Loans on < 5 Family Dwellings (A B C & D)
G) Loans On Manufactured Home Dwelling (A B C & D)
Number
Average Value
Number
Average Value
Number
Average Value
Number
Average Value
Number
Average Value
Number
Average Value
LOANS ORIGINATED
329
$326,581
350
$302,974
246
$301,381
22
$76,628
27
$271,844
0
$0
APPLICATIONS APPROVED, NOT ACCEPTED
14
$332,946
29
$314,100
40
$300,101
4
$38,615
3
$349,953
0
$0
APPLICATIONS DENIED
33
$354,628
54
$332,697
210
$351,136
29
$130,728
16
$296,292
1
$91,880
APPLICATIONS WITHDRAWN
33
$343,553
64
$283,143
115
$362,888
4
$147,782
9
$276,297
0
$0
FILES CLOSED FOR INCOMPLETENESS
2
$453,845
7
$337,821
21
$320,284
6
$58,323
3
$345,927
0
$0
Aggregated Statistics For Year 2007 (Based on 4 partial tracts)
A) FHA, FSA/RHS & VA Home Purchase Loans
B) Conventional Home Purchase Loans
C) Refinancings
D) Home Improvement Loans
F) Non-occupant Loans on < 5 Family Dwellings (A B C & D)
G) Loans On Manufactured Home Dwelling (A B C & D)
Number
Average Value
Number
Average Value
Number
Average Value
Number
Average Value
Number
Average Value
Number
Average Value
LOANS ORIGINATED
30
$341,774
795
$295,460
493
$304,390
62
$114,543
40
$296,215
1
$43,200
APPLICATIONS APPROVED, NOT ACCEPTED
1
$305,120
77
$310,816
109
$326,416
10
$118,765
7
$340,513
0
$0
APPLICATIONS DENIED
3
$263,960
120
$345,941
447
$357,309
65
$120,541
22
$401,570
1
$49,800
APPLICATIONS WITHDRAWN
2
$263,760
114
$312,986
208
$355,542
7
$113,657
11
$303,664
1
$506,120
FILES CLOSED FOR INCOMPLETENESS
1
$300,590
24
$349,501
55
$382,019
4
$191,918
5
$330,016
0
$0
Aggregated Statistics For Year 2006 (Based on 4 partial tracts)
A) FHA, FSA/RHS & VA Home Purchase Loans
B) Conventional Home Purchase Loans
C) Refinancings
D) Home Improvement Loans
E) Loans on Dwellings For 5+ Families
F) Non-occupant Loans on < 5 Family Dwellings (A B C & D)
G) Loans On Manufactured Home Dwelling (A B C & D)
Number
Average Value
Number
Average Value
Number
Average Value
Number
Average Value
Number
Average Value
Number
Average Value
Number
Average Value
LOANS ORIGINATED
20
$352,204
1,354
$297,741
853
$316,869
102
$126,589
0
$0
82
$314,239
1
$97,110
APPLICATIONS APPROVED, NOT ACCEPTED
0
$0
123
$330,849
136
$312,168
24
$79,915
0
$0
15
$285,378
0
$0
APPLICATIONS DENIED
3
$328,057
170
$312,332
400
$350,807
50
$123,027
0
$0
24
$310,913
0
$0
APPLICATIONS WITHDRAWN
1
$181,090
193
$323,370
287
$359,859
17
$281,235
1
$298,780
27
$264,562
0
$0
FILES CLOSED FOR INCOMPLETENESS
0
$0
27
$349,835
46
$314,206
6
$152,885
0
$0
3
$224,837
0
$0
Aggregated Statistics For Year 2005 (Based on 4 partial tracts)
A) FHA, FSA/RHS & VA Home Purchase Loans
B) Conventional Home Purchase Loans
C) Refinancings
D) Home Improvement Loans
F) Non-occupant Loans on < 5 Family Dwellings (A B C & D)
G) Loans On Manufactured Home Dwelling (A B C & D)
Number
Average Value
Number
Average Value
Number
Average Value
Number
Average Value
Number
Average Value
Number
Average Value
LOANS ORIGINATED
2
$358,565
1,840
$331,306
1,292
$332,172
123
$139,526
194
$288,645
0
$0
APPLICATIONS APPROVED, NOT ACCEPTED
0
$0
152
$311,123
123
$313,470
14
$157,601
18
$333,625
0
$0
APPLICATIONS DENIED
1
$224,990
214
$354,246
271
$332,593
46
$145,839
29
$278,635
1
$45,270
APPLICATIONS WITHDRAWN
0
$0
155
$348,890
243
$331,012
37
$174,969
12
$258,448
0
$0
FILES CLOSED FOR INCOMPLETENESS
0
$0
26
$303,217
46
$359,483
9
$72,967
3
$255,053
0
$0
Aggregated Statistics For Year 2004 (Based on 4 partial tracts)
A) FHA, FSA/RHS & VA Home Purchase Loans
B) Conventional Home Purchase Loans
C) Refinancings
D) Home Improvement Loans
F) Non-occupant Loans on < 5 Family Dwellings (A B C & D)
G) Loans On Manufactured Home Dwelling (A B C & D)
Number
Average Value
Number
Average Value
Number
Average Value
Number
Average Value
Number
Average Value
Number
Average Value
LOANS ORIGINATED
28
$258,098
1,613
$284,743
1,107
$276,941
80
$104,906
101
$242,399
1
$67,910
APPLICATIONS APPROVED, NOT ACCEPTED
0
$0
120
$271,594
121
$261,535
19
$80,589
4
$485,118
0
$0
APPLICATIONS DENIED
3
$310,703
126
$274,904
240
$258,679
42
$78,310
11
$274,277
4
$57,075
APPLICATIONS WITHDRAWN
4
$208,400
123
$281,115
189
$257,295
21
$96,446
14
$232,771
1
$83,770
FILES CLOSED FOR INCOMPLETENESS
0
$0
24
$288,905
42
$262,315
7
$93,629
2
$294,070
0
$0
Aggregated Statistics For Year 2003 (Based on 4 partial tracts)
A) FHA, FSA/RHS & VA Home Purchase Loans
B) Conventional Home Purchase Loans
C) Refinancings
D) Home Improvement Loans
F) Non-occupant Loans on < 5 Family Dwellings (A B C & D)
Number
Average Value
Number
Average Value
Number
Average Value
Number
Average Value
Number
Average Value
LOANS ORIGINATED
102
$227,890
1,153
$233,799
1,874
$227,358
54
$48,020
51
$150,254
APPLICATIONS APPROVED, NOT ACCEPTED
2
$191,980
78
$228,647
209
$206,380
14
$40,754
3
$148,427
APPLICATIONS DENIED
2
$249,005
61
$225,293
249
$216,514
42
$34,855
7
$193,331
APPLICATIONS WITHDRAWN
7
$203,263
107
$217,069
188
$223,855
10
$41,029
5
$125,348
FILES CLOSED FOR INCOMPLETENESS
1
$247,100
15
$413,609
55
$240,198
7
$35,824
3
$133,780
Aggregated Statistics For Year 1999 (Based on 1 partial tract)
A) FHA, FSA/RHS & VA Home Purchase Loans
B) Conventional Home Purchase Loans
C) Refinancings
D) Home Improvement Loans
F) Non-occupant Loans on < 5 Family Dwellings (A B C & D)
Detailed PMIC statistics for the following Tracts:9014.05
, 9014.06
2003 - 2018 National Fire Incident Reporting System (NFIRS) incidents
Based on the data from the years 2003 - 2018 the average number of fire incidents per year is 17. The highest number of fires - 50 took place in 2018, and the least - 0 in 2005. The data has an increasing trend.
When looking into fire subcategories, the most incidents belonged to: Structure Fires (47.2%), and Outside Fires (33.3%).
Fire incident types reported to NFIRS in Zip Code 20136


 Nearest zip codes: 20181, 20109, 20110, 20155, 20121, 20143.


 Based on the data from the years 2003 - 2018 the average number of fire incidents per year is 17. The highest number of fires - 50 took place in 2018, and the least - 0 in 2005. The data has an increasing trend.
 When looking into fire subcategories, the most incidents belonged to: Structure Fires (47.2%), and Outside Fires (33.3%).