Estimated zip code population in 2022: 18,961 Zip code population in 2010: 15,252 Zip code population in 2000: 12,886
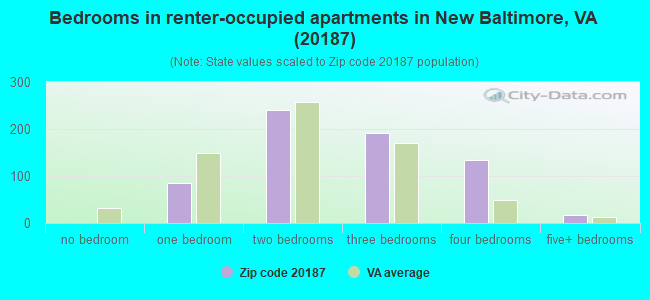
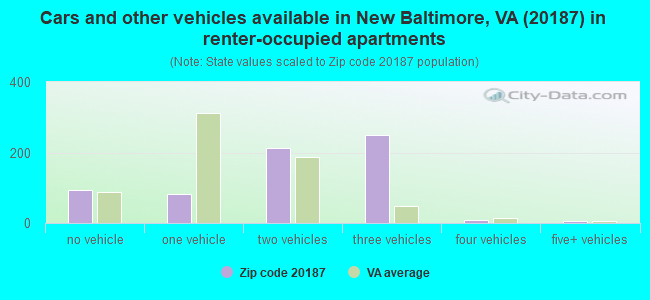
Houses and condos: 6,703 Renter-occupied apartments: 674
% of renters here:
10%
State:
33%
March 2022 cost of living index in zip code 20187: 161.4 (very high, U.S. average is 100)
Land area: 48.5 sq. mi. Water area: 0.6 sq. mi.
Population density: 391 people per square mile
(very low).
OSM Map
General Map
Google Map
MSN Map
OSM Map
General Map
Google Map
MSN Map
OSM Map
General Map
Google Map
MSN Map
OSM Map
General Map
Google Map
MSN Map
Please wait while loading the map...
Real estate property taxes paid for housing units in 2022:
This zip code:
0.7% ($4,435)
Virginia:
0.7% ($2,617)
Median real estate property taxes paid for housing units with mortgages in 2022: $4,489 (0.7%) Median real estate property taxes paid for housing units with no mortgage in 2022: $4,210 (0.8%)
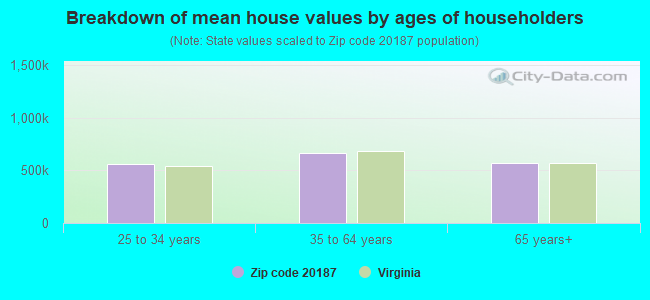
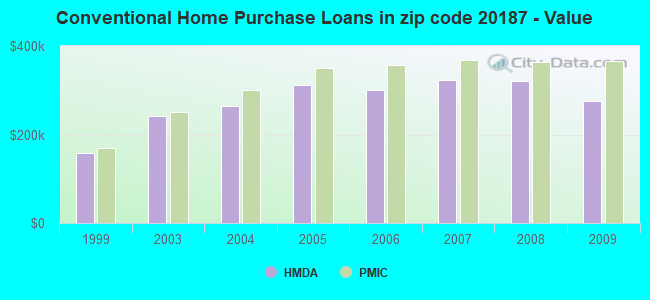
Estimated median house/condo value in 2022: $596,980
20187:
$596,980
Virginia:
$365,700
According to our research of Virginia and other state lists, there were 24 registered sex offenders living in 20187 zip code as of April 25, 2024. The ratio of all residents to sex offenders in zip code 20187 is 714 to 1. The ratio of registered sex offenders to all residents in this zip code is lower than the state average.
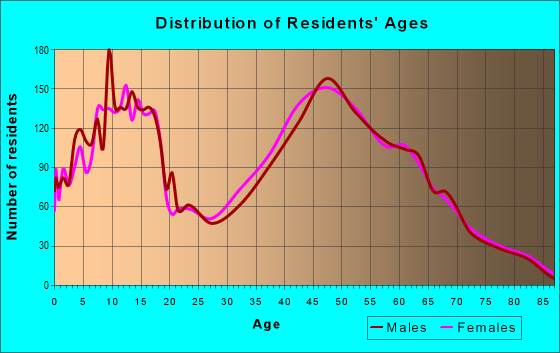
Median resident age:
This zip code:
40.3 years
Virginia median age:
39.0 years
Average household size:
This zip code:
2.9 people
Virginia:
2.5 people
Averages for the 2020 tax year for zip code 20187, filed in 2021:
Average Adjusted Gross Income (AGI) in 2020: $120,481 (Individual Income Tax Returns)
Here:
$120,481
State:
$86,446
Salary/wage: $105,510 (reported on 82.7% of returns)
Here:
$105,510
State:
$71,185
(% of AGI for various income ranges: 1217.3% for AGIs below $25k, 3520.9% for AGIs $25k-50k, 6342.1% for AGIs $50k-75k, 8968.8% for AGIs $75k-100k, 19665.0% for AGIs $100k-200k, 67179.6% for AGIs over 200k)
Taxable interest for individuals: $1,466 (reported on 43.3% of returns)
This zip code:
$1,466
Virginia:
$1,805
(% of AGI for various income ranges: 18.3% for AGIs below $25k, 45.8% for AGIs $25k-50k, 74.0% for AGIs $50k-75k, 81.2% for AGIs $75k-100k, 113.5% for AGIs $100k-200k, 472.4% for AGIs over 200k)
Ordinary dividends: $6,684 (reported on 30.5% of returns)
Here:
$6,684
State:
$8,327
(% of AGI for various income ranges: 34.5% for AGIs below $25k, 104.6% for AGIs $25k-50k, 137.6% for AGIs $50k-75k, 184.3% for AGIs $75k-100k, 331.9% for AGIs $100k-200k, 1931.8% for AGIs over 200k)
Net capital gain/loss in AGI: +$14,702 (reported on 27.4% of returns)
Here:
+$14,702
State:
+$24,644
(% of AGI for various income ranges: 38.5% for AGIs below $25k, 53.5% for AGIs $25k-50k, 168.4% for AGIs $50k-75k, 172.0% for AGIs $75k-100k, 345.4% for AGIs $100k-200k, 5371.2% for AGIs over 200k)
Profit/loss from business: +$19,724 (reported on 17.6% of returns)
Here:
+$19,724
State:
+$12,836
(% of AGI for various income ranges: 100.9% for AGIs below $25k, 173.4% for AGIs $25k-50k, 320.5% for AGIs $50k-75k, 356.1% for AGIs $75k-100k, 529.3% for AGIs $100k-200k, 3162.5% for AGIs over 200k)
Taxable individual retirement arrangement distribution: $24,081 (reported on 10.7% of returns)
20187:
$24,081
Virginia:
$21,535
(% of AGI for various income ranges: 50.2% for AGIs below $25k, 164.4% for AGIs $25k-50k, 241.8% for AGIs $50k-75k, 507.3% for AGIs $75k-100k, 661.2% for AGIs $100k-200k, 1311.8% for AGIs over 200k)
Self-employed (Keogh) retirement plans: $26,411 (reported on 1.0% of returns)
20187:
$26,411
Virginia:
$31,172
(% of AGI for various income ranges: 28.0% for AGIs $100k-200k, 383.1% for AGIs over 200k)
Total itemized deductions: $32,773 (reported on 30.3% of returns)
Here:
$32,773
State:
$33,287
(% of AGI for various income ranges: 145.5% for AGIs below $25k, 318.9% for AGIs $25k-50k, 810.8% for AGIs $50k-75k, 1281.6% for AGIs $75k-100k, 2318.1% for AGIs $100k-200k, 7136.3% for AGIs over 200k)
Charity contributions: $8,082 (reported on 24.2% of returns)
Here:
$8,082
State:
$10,381
(% of AGI for various income ranges: 5.5% for AGIs below $25k, 31.9% for AGIs $25k-50k, 82.9% for AGIs $50k-75k, 157.1% for AGIs $75k-100k, 362.7% for AGIs $100k-200k, 1985.7% for AGIs over 200k)
Taxes paid: $9,047 (reported on 30.3% of returns)
20187:
$9,047
State:
$8,284
(% of AGI for various income ranges: 19.7% for AGIs below $25k, 60.5% for AGIs $25k-50k, 216.1% for AGIs $50k-75k, 371.6% for AGIs $75k-100k, 731.5% for AGIs $100k-200k, 1787.3% for AGIs over 200k)
Earned income credit: $1,769 (reported on 4.8% of returns)
Here:
$1,769
State:
$2,214
(% of AGI for various income ranges: 38.6% for AGIs below $25k, 29.1% for AGIs $25k-50k)
Percentage of individuals using paid preparers for their 2020 taxes: 91.1%
Here:
91%
State:
92%
(% for various income ranges: 89.6% for AGIs below $25k, 89.8% for AGIs $25k-50k, 90.1% for AGIs $50k-75k, 92.1% for AGIs $75k-100k, 91.1% for AGIs $100k-200k, 94.4% for AGIs over 200k)
Averages for the 2012 tax year for zip code 20187, filed in 2013:
Average Adjusted Gross Income (AGI) in 2012: $97,273 (Individual Income Tax Returns)
Here:
$97,273
State:
$71,192
Salary/wage: $84,846 (reported on 85.2% of returns)
Here:
$84,846
State:
$59,229
(% of AGI for various income ranges: 78.5% for AGIs below $25k, 73.5% for AGIs $25k-50k, 67.8% for AGIs $50k-75k, 71.0% for AGIs $75k-100k, 81.1% for AGIs $100k-200k, 67.7% for AGIs over 200k)
Taxable interest for individuals: $1,309 (reported on 47.6% of returns)
This zip code:
$1,309
Virginia:
$1,600
(% of AGI for various income ranges: 1.0% for AGIs below $25k, 0.8% for AGIs $25k-50k, 1.0% for AGIs $50k-75k, 0.7% for AGIs $75k-100k, 0.4% for AGIs $100k-200k, 0.8% for AGIs over 200k)
Ordinary dividends: $5,376 (reported on 30.0% of returns)
Here:
$5,376
State:
$6,959
(% of AGI for various income ranges: 1.8% for AGIs below $25k, 1.7% for AGIs $25k-50k, 1.7% for AGIs $50k-75k, 1.5% for AGIs $75k-100k, 0.9% for AGIs $100k-200k, 2.7% for AGIs over 200k)
Net capital gain/loss in AGI: +$7,599 (reported on 22.7% of returns)
Here:
+$7,599
State:
+$16,672
(% of AGI for various income ranges: 0.2% for AGIs below $25k, 0.6% for AGIs $50k-75k, 0.2% for AGIs $75k-100k, 0.6% for AGIs $100k-200k, 4.5% for AGIs over 200k)
Profit/loss from business: +$17,942 (reported on 16.0% of returns)
Here:
+$17,942
State:
+$14,116
(% of AGI for various income ranges: 7.8% for AGIs below $25k, 3.9% for AGIs $25k-50k, 2.8% for AGIs $50k-75k, 2.3% for AGIs $75k-100k, 2.4% for AGIs $100k-200k, 3.4% for AGIs over 200k)
Taxable individual retirement arrangement distribution: $17,679 (reported on 12.0% of returns)
20187:
$17,679
Virginia:
$16,667
(% of AGI for various income ranges: 2.7% for AGIs below $25k, 3.3% for AGIs $25k-50k, 3.8% for AGIs $50k-75k, 2.4% for AGIs $75k-100k, 2.1% for AGIs $100k-200k, 1.7% for AGIs over 200k)
Self-employment retirement plans: $16,757 (reported on 0.9% of returns)
20187:
$16,757
Virginia:
$25,373
Total itemized deductions: $29,706 (21% of AGI, reported on 58.0% of returns)
Here:
$29,706
State:
$26,596
Here:
20.6% of AGI
State:
20.1% of AGI
(% of AGI for various income ranges: 13.4% for AGIs below $25k, 15.5% for AGIs $25k-50k, 20.1% for AGIs $50k-75k, 19.4% for AGIs $75k-100k, 19.4% for AGIs $100k-200k, 15.2% for AGIs over 200k)
Charity contributions: $3,878 (reported on 48.4% of returns)
Here:
$3,878
State:
$4,443
(% of AGI for various income ranges: 0.9% for AGIs below $25k, 1.6% for AGIs $25k-50k, 1.8% for AGIs $50k-75k, 2.0% for AGIs $75k-100k, 2.0% for AGIs $100k-200k, 2.0% for AGIs over 200k)
Taxes paid: $11,111 (reported on 57.9% of returns)
20187:
$11,111
State:
$9,951
(% of AGI for various income ranges: 2.3% for AGIs below $25k, 3.6% for AGIs $25k-50k, 5.5% for AGIs $50k-75k, 6.2% for AGIs $75k-100k, 7.2% for AGIs $100k-200k, 7.0% for AGIs over 200k)
Earned income credit: $1,794 (reported on 6.3% of returns)
Here:
$1,794
State:
$2,211
(% of AGI for various income ranges: 3.1% for AGIs below $25k, 0.6% for AGIs $25k-50k)
Percentage of individuals using paid preparers for their 2012 taxes: 42.0%
Here:
42%
State:
46%
(% for various income ranges: 34.4% for AGIs below $25k, 40.2% for AGIs $25k-50k, 49.4% for AGIs $50k-75k, 45.1% for AGIs $75k-100k, 42.3% for AGIs $100k-200k, 51.4% for AGIs over 200k)
Averages for the 2004 tax year for zip code 20187, filed in 2005:
Average Adjusted Gross Income (AGI) in 2004: $82,773 (Individual Income Tax Returns)
Here:
$82,773
State:
$56,704
Salary/wage: $69,053 (reported on 86.9% of returns)
Here:
$69,053
State:
$48,441
(% of AGI for various income ranges: 162.2% for AGIs below $10k, 74.1% for AGIs $10k-25k, 78.0% for AGIs $25k-50k, 73.7% for AGIs $50k-75k, 83.6% for AGIs $75k-100k, 68.3% for AGIs over 100k)
Taxable interest for individuals: $1,779 (reported on 60.3% of returns)
This zip code:
$1,779
Virginia:
$1,688
(% of AGI for various income ranges: 6.3% for AGIs below $10k, 1.8% for AGIs $10k-25k, 1.4% for AGIs $25k-50k, 1.9% for AGIs $50k-75k, 0.8% for AGIs $75k-100k, 1.3% for AGIs over 100k)
Taxable dividends: $4,270 (reported on 35.1% of returns)
Here:
$4,270
State:
$4,028
(% of AGI for various income ranges: 7.0% for AGIs below $10k, 1.8% for AGIs $10k-25k, 1.1% for AGIs $25k-50k, 1.7% for AGIs $50k-75k, 0.7% for AGIs $75k-100k, 2.1% for AGIs over 100k)
Net capital gain/loss: +$20,228 (reported on 28.3% of returns)
Here:
+$20,228
State:
+$14,375
(% of AGI for various income ranges: -2.8% for AGIs below $10k, 0.7% for AGIs $10k-25k, 0.5% for AGIs $25k-50k, 1.2% for AGIs $50k-75k, 0.7% for AGIs $75k-100k, 10.2% for AGIs over 100k)
Profit/loss from business: +$17,529 (reported on 16.6% of returns)
Here:
+$17,529
State:
+$13,342
(% of AGI for various income ranges: 11.8% for AGIs below $10k, 7.0% for AGIs $10k-25k, 3.6% for AGIs $25k-50k, 2.9% for AGIs $50k-75k, 3.1% for AGIs $75k-100k, 3.5% for AGIs over 100k)
IRA payment deduction: $3,086 (reported on 4.0% of returns)
20187:
$3,086
Virginia:
$2,943
(% of AGI for various income ranges: 0.2% for AGIs $10k-25k, 0.4% for AGIs $25k-50k, 0.2% for AGIs $50k-75k, 0.2% for AGIs $75k-100k, 0.1% for AGIs over 100k)
Self-employed pension: $12,758 (reported on 1.6% of returns)
Here:
$12,758
Virginia:
$17,430
Total itemized deductions: $24,664 (20% of AGI, reported on 60.2% of returns)
Here:
$24,664
State:
$21,492
Here:
20.3% of AGI
State:
21.0% of AGI
(% of AGI for various income ranges: 19.4% for AGIs below $10k, 14.5% for AGIs $10k-25k, 18.1% for AGIs $25k-50k, 22.9% for AGIs $50k-75k, 22.3% for AGIs $75k-100k, 16.3% for AGIs over 100k)
Charity contributions deductions: $3,697 (3% of AGI, reported on 53.8% of returns)
Here:
$3,697
State:
$3,794
Here:
2.9% of AGI
State:
3.5% of AGI
(% of AGI for various income ranges: 0.5% for AGIs below $10k, 1.1% for AGIs $10k-25k, 1.7% for AGIs $25k-50k, 2.6% for AGIs $50k-75k, 2.4% for AGIs $75k-100k, 2.5% for AGIs over 100k)
Total tax: $13,822 (reported on 84.6% of returns)
20187:
$13,822
State:
$9,537
(% of AGI for various income ranges: 4.2% for AGIs below $10k, 5.3% for AGIs $10k-25k, 7.6% for AGIs $25k-50k, 8.4% for AGIs $50k-75k, 9.5% for AGIs $75k-100k, 17.1% for AGIs over 100k)
Earned income credit: $1,583 (reported on 4.4% of returns)
Here:
$1,583
State:
$1,734
Percentage of individuals using paid preparers for their 2004 taxes: 45.3%
Here:
45%
State:
52%
(% for various income ranges: 32.4% for AGIs below $10k, 45.6% for AGIs $10k-25k, 51.8% for AGIs $25k-50k, 50.6% for AGIs $50k-75k, 43.6% for AGIs $75k-100k, 48.2% for AGIs over 100k)
Likely homosexual households (counted as self-reported same-sex unmarried-partner households)
Lesbian couples: 0.3% of all households
Gay men: 0.1% of all households
Household received Food Stamps/SNAP in the past 12 months: 208 Household did not receive Food Stamps/SNAP in the past 12 months: 6,256
Women who had a birth in the past 12 months: 177 (165 now married, 15 unmarried) Women who did not have a birth in the past 12 months: 4,095 (2,096 now married, 1,985 unmarried)
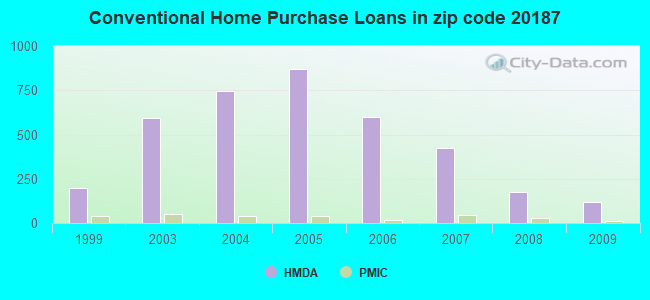
Housing units in zip code 20187 with a mortgage: 4,727 (649 second mortgage, 6 home equity loan, 482 both second mortgage and home equity loan) Houses without a mortgage: 156
Median monthly owner costs for units with a mortgage: $2,596 Median monthly owner costs for units without a mortgage: $684
Residents with income below the poverty level in 2022:
This zip code:
2.2%
Whole state:
10.6%
Residents with income below 50% of the poverty level in 2022:
This zip code:
1.0%
Whole state:
5.2%
Median number of rooms in houses and condos:
Here:
10.0
State:
7.0
Median number of rooms in apartments:
Here:
5.1
State:
4.3
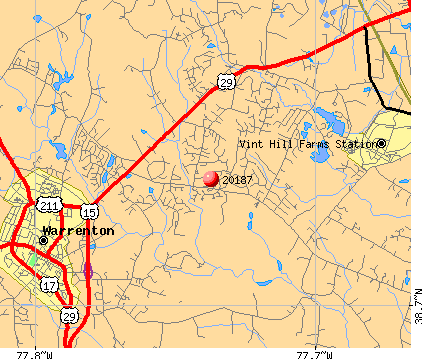
Notable locations in this zip code not listed on our city pages
Notable locations in zip code 20187: Road Island (A), New Baltimore Industrial Park (B), New Baltimore Business Park (C), Groomes Crossroads (D), Godfreys Corner (E), Evergreen (F), New Baltimore Volunteer Fire and Rescue Company 10 (G). Display/hide their locations on the map
Churches in zip code 20187 include: Bethel United Methodist Church (A), Christ Church (B), Poplar Fork Church (C), Broad Run Church (D), Walnut Grove Church (E). Display/hide their locations on the map
Reservoirs: Warrenton Lake (A), Airlie Lake (B), Springhill Farm Pond (C), Lake Anne (D), Lake Brittle (E), Warrenton Reservoir (F). Display/hide their locations on the map
In group quarters: 22 (-1 institutionalized population)
Size of family households: 1,834 2-persons, 1,428 3-persons, 1,127 4-persons, 439 5-persons, 238 6-persons, 106 7-or-more-persons
Size of nonfamily households: 1,193 1-person, 79 2-persons, 52 3-persons
3,813 married couples with children.
629 single-parent households (339 men, 290 women).
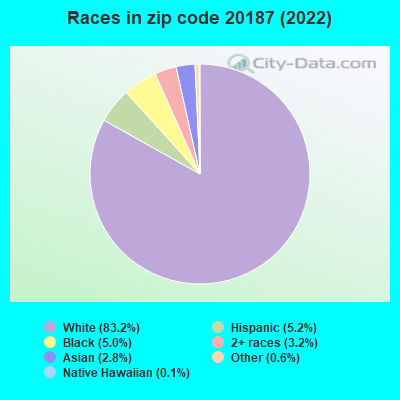
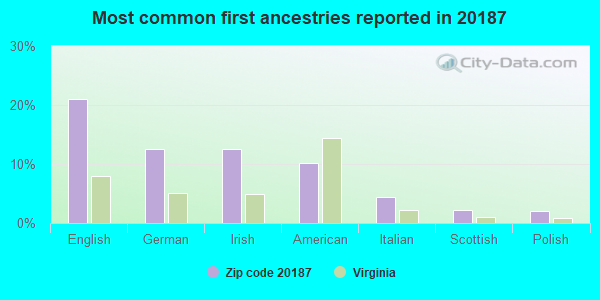
93.0% of residents of 20187 zip code speak English at home.
3.3% of residents speak Spanish at home (74% very well, 13% well, 13% not well).
2.4% of residents speak other Indo-European language at home (95% very well, 5% well).
0.8% of residents speak Asian or Pacific Island language at home (73% very well, 20% well, 4% not well, 4% not at all).
0.1% of residents speak other language at home (100% very well).
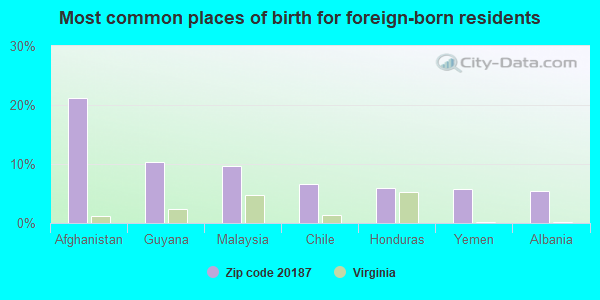
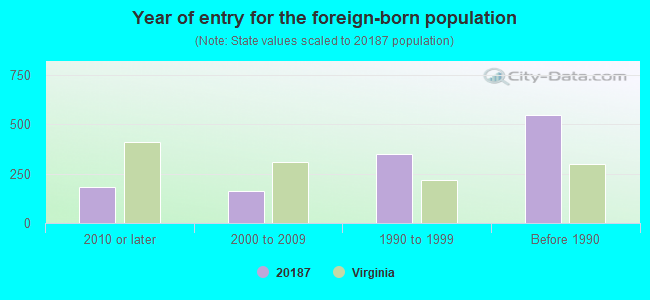
Foreign born population: 1,054 (5.6%) (85.3% of them are naturalized citizens)
Facilities with environmental interests located in this zip code:
C. HUNTER RITCHIE ELEM. (4416 BROAD RUN CHURCH RD in NEW BALTIMORE, VA)
(National Center for Education Statistics) - STATE ID-0300460 Organizations: FAUQUIER COUNTY PUBLIC SCHOOLS (SCHOOL DISTRICT)
7-ELEVEN #23412 (US RTE 29 & RT 211 in NEW BALTIMORE, VA)
Small Quantity Generators, between 100 kg and 1000 kg of hazardous waste/month (Resource Conservation and Recovery Act (tracking hazardous waste)) - notification Organizations: OPERNAME (CONTACT/OPERATOR)
, SOUTHLAND CORPORATION THE (CONTACT/OWNER)
Housing units lacking complete plumbing facilities: 0.1% Housing units lacking complete kitchen facilities: 0.7%
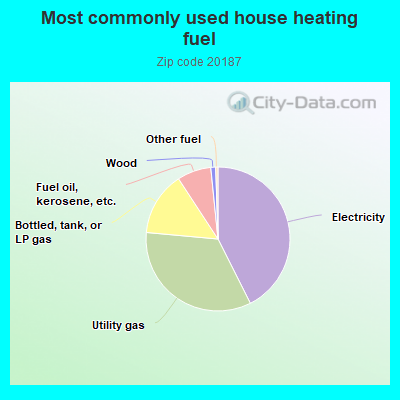
42.5%Electricity
33.8%Utility gas
14.3%Bottled, tank, or LP gas
7.6%Fuel oil, kerosene, etc.
1.1%Wood
0.5%Other fuel
Place of birth for U.S.-born residents:
This state: 8,888
Northeast: 2,249
Midwest: 1,086
South: 3,700
West: 1,797
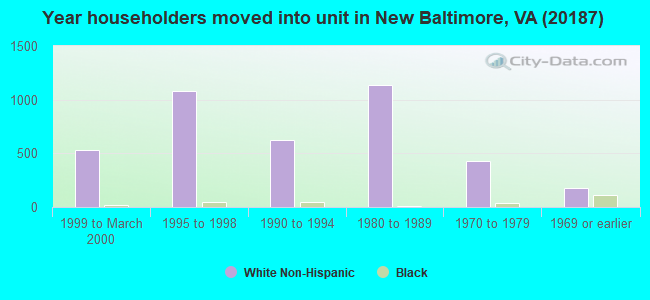
61% of the 20187 zip code residents lived in the same house 5 years ago. Out of people who lived in different houses, 27% lived in this county. Out of people who lived in different counties, 50% lived in Virginia.
93% of the 20187 zip code residents lived in the same house 1 year ago. Out of people who lived in different houses, 29% moved from this county. Out of people who lived in different houses, 51% moved from different county within same state. Out of people who lived in different houses, 22% moved from different state. Out of people who lived in different houses, 2% moved from abroad.
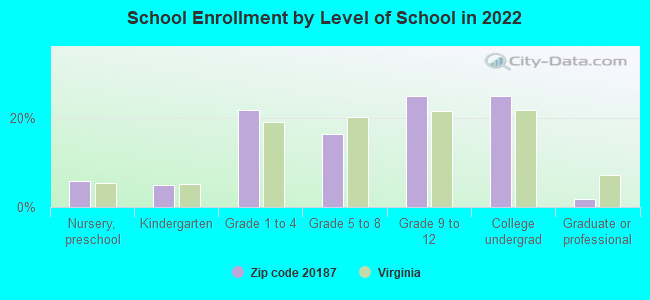
Private vs. public school enrollment:
Students in private schools in grades 1 to 8 (elementary and middle school): 568
Here:
27.8%
Virginia:
13.2%
Students in private schools in grades 9 to 12 (high school): 78
Here:
5.9%
Virginia:
10.2%
Students in private undergraduate colleges: 111
Here:
8.3%
Virginia:
18.7%
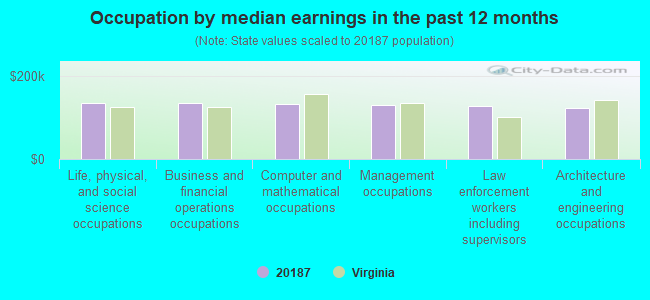
Occupation by median earnings in the past 12 months ($)
135,216Life, physical, and social science occupations
134,517Business and financial operations occupations
133,075Computer and mathematical occupations
130,266Management occupations
126,360Law enforcement workers including supervisors
122,733Architecture and engineering occupations
Companies with biggest federal contracts located in this zip code (WARRENTON, VA):
LOG SEC GROUP (4150 WEEKS DR; small business) : $44,372,943 in 85 contractsfrom 2004 to 2006
Contracts for Other ADP and Telecommunications Services (includes data storage on tapes, compact disks, etc.), ADP Facility Operation and Maintenance Services by Army Signed by year:2000: $0; 2001: $0; 2002: $0; 2003: $0; 2004: $12,532,150; 2005: $18,127,980; 2006: $13,712,813.
Biggest contracts:
$5,064,674 with Army for Other ADP and Telecommunications Services (includes data storage on tapes, compact disks, etc.). Taking place in MD. Signed on 2006-02-23. Completion date: 2007-01-14.
$5,000,000, same as above.Signed on 2006-03-30. Completion date: 2009-03-31.
$4,392,203, same as above.Signed on 2005-02-11. Completion date: 2006-01-31.
$2,895,799 with Army for ADP Facility Operation and Maintenance Services. Taking place in MD. Signed on 2004-04-20. Completion date: 2005-01-05.
LOG. SEC CORPORATION (4150 WEEKS DR VINT HL VIN; small business) : $19,621,831 in 89 contractsfrom 2000 to 2006
Contracts for ADP Systems Development Services, Other Professional Services, Program Management/Support Services, Automated News Services, Data Services, or Other Information Services. Buying data, the electronic equivalent of books, periodicals, newspapers, etc., and moreby Army, Federal Technology Service, Navy Signed by year:2000: $58,684; 2001: $0; 2002: $3,847,226; 2003: $3,161,633; 2004: $4,471,002; 2005: $4,809,648; 2006: $3,273,638.
Biggest contracts:
$1,802,389 with Army for ADP Systems Development Services. Taking place in MD. Signed on 2005-05-25. Completion date: 2006-05-24.
$1,427,940, same as above.Signed on 2004-01-22. Completion date: 2005-01-31.
$1,163,436 with Army for Other Professional Services. Taking place in MD. Signed on 2006-07-07. Effective on 2006-07-10. Completion date: 2007-07-09.
$1,050,000 with Army for ADP Systems Development Services. Taking place in MD. Signed on 2002-09-25. Completion date: 2003-09-26.
ATHENA TECHNOLOGIES INC (6876 WATSON COURT; small business) 100 employees, $0 revenue. : $7,003,295 in 32 contractsfrom 2000 to 2006
Contracts for Other Research and Development -- Advanced Development (R&D), Other Defense -- Applied Research and Exploratory Development (R&D), Weapons -- Applied Research and Exploratory Development (R&D), Defense Aircraft -- Advanced Development (R&D), and moreby Department of Defense, Army, Air Force, Navy, and others Signed by year:2000: $462,316; 2001: $1,505,343; 2002: $667,508; 2003: $678,227; 2004: $2,136,551; 2005: $1,537,000; 2006: $16,350.
Biggest contracts:
$1,500,000 with Department of Defense for Other Research and Development -- Advanced Development (R&D). Signed on 2005-09-26. Completion date: 2005-06-03.
$738,185 with Army for Other Defense -- Applied Research and Exploratory Development (R&D). Signed on 2004-01-14. Completion date: 2004-12-30.
$499,861 with Department of Defense for Other Research and Development -- Advanced Development (R&D). Signed on 2004-12-10. Completion date: 2005-06-03.
$399,563 with Army for Other Defense -- Applied Research and Exploratory Development (R&D). Signed on 2001-02-28. Completion date: 2002-03-31.
SCHIEBEL TECHNOLOGY, INC (7081 LINEWEAVER RD; small business) : $1,380,951 in 6 contractsfrom 2001 to 2005
Contracts for Other Defense -- Advanced Development (R&D), Hazard-Detecting Instruments and Apparatus, Vocational/Technical, Engineering and Technical Services by Army Signed by year:2000: $0; 2001: $117,450; 2002: $1,269,927; 2003: $4,147; 2004: $0; 2005: -$10,573; 2006: $0.
Biggest contracts:
$1,245,597 with Army for Other Defense -- Advanced Development (R&D). Signed on 2002-08-08. Completion date: 2003-03-08.
$82,500 with Army for Hazard-Detecting Instruments and Apparatus. Signed on 2001-11-05. Completion date: 2001-12-03.
$34,950 with Army for Vocational/Technical. Taking place in HI. Signed on 2001-08-08. Completion date: 2001-09-13.
$24,330 with Army for Engineering and Technical Services. Signed on 2002-07-08. Completion date: 2002-08-08.
COMMONWEALTH MEDICAL LABORATOR (4228 AIKEN DR; small business) : $978,332 in 40 contractsfrom 2000 to 2006
Contracts for Laboratory Testing Services, Other Medical Services, Laboratory Equipment and Supplies, In Vitro Diagnostic Substances, Reagents, Test Kits, and Sets, and moreby Army, Navy Signed by year:2000: $34,060; 2001: $0; 2002: $0; 2003: $144,553; 2004: $334,317; 2005: $325,474; 2006: $139,928.
Biggest contracts:
$84,553 with Army for Laboratory Testing Services. Signed on 2003-01-25. Completion date: 2004-01-24.
$72,901 with Navy for Other Medical Services. Signed on 2005-11-17. Completion date: 2006-09-30.
$47,763 with Navy for Laboratory Equipment and Supplies. Signed on 2004-10-07. Completion date: 2005-09-30.
$34,060 with Navy for Laboratory Testing Services. Taking place in MD. Signed on 2000-11-15. Completion date: 2001-09-30.
HIGHLAND RENOVATION CORP (6705 KELLY ROAD; small business) : $420,674 in 17 contractsfrom 2000 to 2006
Contracts for Construction of Structures and Facilities -- Other Administrative Facilities and Service Buildings, Maintenance, Repair or Alteration of Real Property -- Government-Owned Contractor-Operated (GOCO) R&D Facilities, Maintenance, Repair or Alteration of Real Property -- Laboratories and Clinics, Construction of Structures and Facilities -- Other Industrial Buildings, and moreby Navy, Army, ENERGY, Department of, Office of Operations (disused code), and others Signed by year:2000: $41,000; 2001: $32,000; 2002: $39,876; 2003: $14,558; 2004: $74,212; 2005: $131,324; 2006: $87,704.
Biggest contracts:
$79,380 with Navy for Construction of Structures and Facilities -- Other Administrative Facilities and Service Buildings. Taking place in MD. Signed on 2006-02-17. Completion date: 2006-04-15.
$73,770, same as above.Signed on 2005-09-14. Completion date: 2005-10-30.
$59,792 with Navy for Maintenance, Repair or Alteration of Real Property -- Government-Owned Contractor-Operated (GOCO) R&D Facilities. Taking place in MD. Signed on 2004-09-02. Completion date: 2004-09-30.
$39,876 with Army for Maintenance, Repair or Alteration of Real Property -- Laboratories and Clinics. Signed on 2002-09-16. Completion date: 2002-10-03.
SIMPSON BURKE LLC (6599 MERCHANT PL STE 201; small business) : $139,335 in 3 contractsfrom 2004 to 2005
$107,410 with Army for Other Housekeeping Services. Signed on 2004-12-10. Completion date: 2005-01-30.
$28,625, same as above.Signed on 2005-06-24. Completion date: 2005-01-30.
$3,300, same as above.Signed on 2005-08-03. Completion date: 2005-01-30.
DOWNEY & SCOTT LLC (6799 KENNEDY ROAD; small business) : $96,484 in 9 contractsfrom 2005 to 2006
Contracts for Architect - Engineer Services (including landscaping, interior layout, and designing) by Navy Signed by year:2000: $0; 2001: $0; 2002: $0; 2003: $0; 2004: $0; 2005: $30,767; 2006: $65,717.
Biggest contracts:
$30,767 with Navy for Architect - Engineer Services (including landscaping, interior layout, and designing). Taking place in NC. Signed on 2005-12-06. Completion date: 2006-01-12.
$14,528 with Navy for Architect - Engineer Services (including landscaping, interior layout, and designing). Taking place in GA. Signed on 2006-01-09. Completion date: 2006-02-20.
$14,373 with Navy for Architect - Engineer Services (including landscaping, interior layout, and designing). Taking place in SC. Signed on 2006-01-09. Completion date: 2006-02-06.
$14,341 with Navy for Architect - Engineer Services (including landscaping, interior layout, and designing). Taking place in NC. Signed on 2006-01-03. Completion date: 2006-02-02.
PRIORITY COMPUTER SOLUTIONS, I (6176 WEST POINTE LN; small business)
$39,650 with Army for Maintenance, Repair and Rebuilding of Equipment -- Electrical and Electronic Equipment Components. Taking place in PA. Signed on 2005-12-28. Completion date: 2006-12-31.
TRIBLE EQUIPMENT INC (8326 MEETZE RD; small business)
$19,921 with Army for Miscellaneous Construction Equipment. Signed on 2003-09-30. Completion date: 2003-10-30.
Top industries in this zip code by the number of employees in 2005:
2002 - 2018 National Fire Incident Reporting System (NFIRS) incidents
Based on the data from the years 2002 - 2018 the average number of fires per year is 22. The highest number of fires - 54 took place in 2015, and the least - 5 in 2008. The data has an increasing trend.
When looking into fire subcategories, the most reports belonged to: Outside Fires (42.9%), and Structure Fires (38.8%).
Fire incident types reported to NFIRS in Zip Code 20187


 Nearest zip codes: 20139, 20137, 20186, 22728, 20155, 22712.
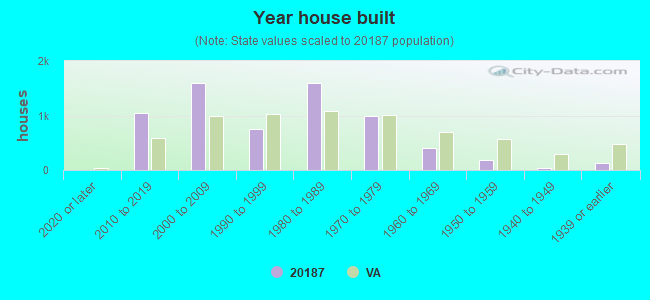


 Based on the data from the years 2002 - 2018 the average number of fires per year is 22. The highest number of fires - 54 took place in 2015, and the least - 5 in 2008. The data has an increasing trend.
 When looking into fire subcategories, the most reports belonged to: Outside Fires (42.9%), and Structure Fires (38.8%).