Estimated zip code population in 2022: 2,060 Zip code population in 2010: 1,671 Zip code population in 2000: 1,807
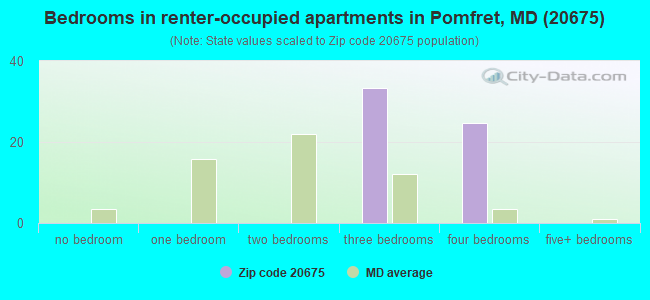
Houses and condos: 775 Renter-occupied apartments: 59
% of renters here:
8%
State:
32%
March 2022 cost of living index in zip code 20675: 130.5 (high, U.S. average is 100)
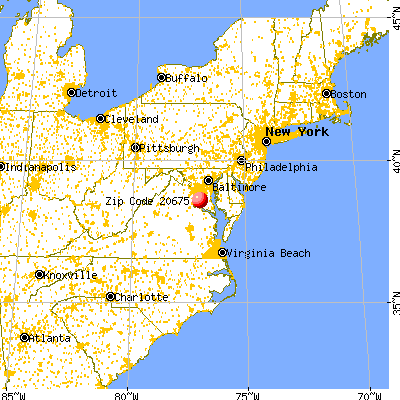
Land area: 6.0 sq. mi. Water area: 0.0 sq. mi.
Population density: 341 people per square mile
(very low).
OSM Map
General Map
Google Map
MSN Map
OSM Map
General Map
Google Map
MSN Map
OSM Map
General Map
Google Map
MSN Map
OSM Map
General Map
Google Map
MSN Map
Please wait while loading the map...
Real estate property taxes paid for housing units in 2022:
This zip code:
0.9% ($4,096)
Maryland:
0.9% ($3,777)
Median real estate property taxes paid for housing units with mortgages in 2022: $3,787 (0.8%) Median real estate property taxes paid for housing units with no mortgage in 2022: $4,517 (1.2%)
Business Search- 14 Million verified businesses
Males: 1,003
(48.7%)
Females: 1,057
(51.3%)
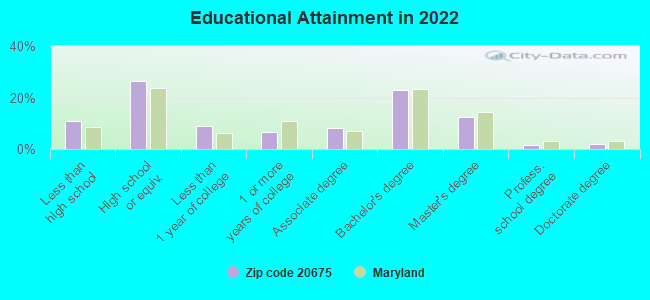
For population 25 years and over in 20675:
High school or higher: 88.7%
Bachelor's degree or higher: 39.1%
Graduate or professional degree: 16.3%
Unemployed: 7.3%
Mean travel time to work (commute): 35.4 minutes
For population 15 years and over in 20675:
Never married: 25.0%
Now married: 56.9%
Separated: 2.5%
Widowed: 6.7%
Divorced: 8.8%
Zip code 20675 compared to state average:
Unemployed percentage above state average.
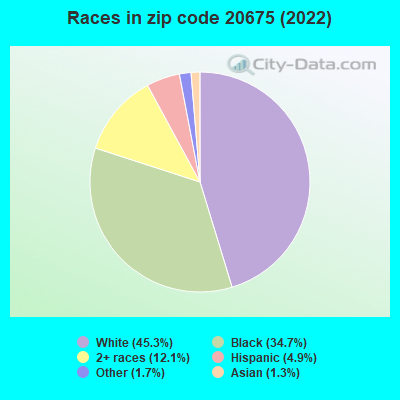
Hispanic race population percentage below state average.
Median age significantly above state average.
Foreign-born population percentage significantly below state average.
Renting percentage significantly below state average.
Length of stay since moving in significantly above state average.
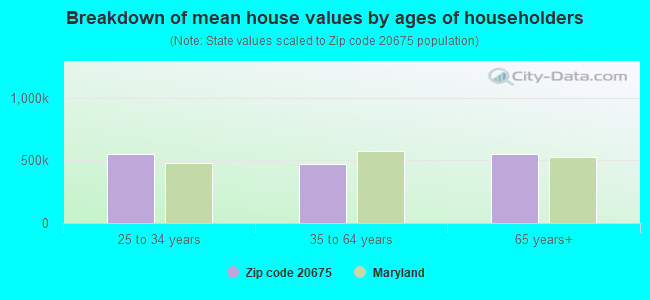
Estimated median house/condo value in 2022: $441,310
20675:
$441,310
Maryland:
$398,100
According to our research of Maryland and other state lists, there was 1 registered sex offender living in 20675 zip code as of April 23, 2024. The ratio of all residents to sex offenders in zip code 20675 is 1,791 to 1. The ratio of registered sex offenders to all residents in this zip code is lower than the state average.
Median resident age:
This zip code:
52.3 years
Maryland median age:
39.7 years
Average household size:
This zip code:
2.6 people
Maryland:
2.5 people
Averages for the 2020 tax year for zip code 20675, filed in 2021:
Average Adjusted Gross Income (AGI) in 2020: $85,572 (Individual Income Tax Returns)
Here:
$85,572
State:
$86,905
Salary/wage: $77,054 (reported on 76.7% of returns)
Here:
$77,054
State:
$73,953
(% of AGI for various income ranges: 1089.2% for AGIs below $25k, 3542.7% for AGIs $25k-50k, 6290.0% for AGIs $50k-75k, 8990.0% for AGIs $75k-100k, 16558.5% for AGIs $100k-200k, 45816.7% for AGIs over 200k)
Taxable interest for individuals: $1,237 (reported on 42.2% of returns)
This zip code:
$1,237
Maryland:
$1,528
(% of AGI for various income ranges: 10.0% for AGIs below $25k, 17.3% for AGIs $25k-50k, 77.0% for AGIs $50k-75k, 54.3% for AGIs $75k-100k, 172.3% for AGIs $100k-200k, 330.0% for AGIs over 200k)
Ordinary dividends: $4,536 (reported on 15.6% of returns)
Here:
$4,536
State:
$8,028
(% of AGI for various income ranges: 32.7% for AGIs $25k-50k, 55.7% for AGIs $75k-100k, 303.1% for AGIs $100k-200k, 553.3% for AGIs over 200k)
Net capital gain/loss in AGI: +$7,092 (reported on 14.4% of returns)
Here:
+$7,092
State:
+$25,238
(% of AGI for various income ranges: 52.0% for AGIs $50k-75k, 600.0% for AGIs $100k-200k, 300.0% for AGIs over 200k)
Taxable individual retirement arrangement distribution: $12,186 (reported on 7.8% of returns)
20675:
$12,186
Maryland:
$20,944
(% of AGI for various income ranges: 136.0% for AGIs $50k-75k, 551.5% for AGIs $100k-200k)
Total itemized deductions: $28,092 (reported on 27.8% of returns)
Here:
$28,092
State:
$30,672
(% of AGI for various income ranges: 354.6% for AGIs below $25k, 903.0% for AGIs $50k-75k, 1675.7% for AGIs $75k-100k, 2237.7% for AGIs $100k-200k, 5256.7% for AGIs over 200k)
Charity contributions: $8,100 (reported on 23.3% of returns)
Here:
$8,100
State:
$9,065
(% of AGI for various income ranges: 200.0% for AGIs $50k-75k, 372.9% for AGIs $75k-100k, 566.2% for AGIs $100k-200k, 1680.0% for AGIs over 200k)
Taxes paid: $8,380 (reported on 27.8% of returns)
20675:
$8,380
State:
$8,475
(% of AGI for various income ranges: 87.7% for AGIs below $25k, 288.0% for AGIs $50k-75k, 608.6% for AGIs $75k-100k, 666.9% for AGIs $100k-200k, 1333.3% for AGIs over 200k)
Earned income credit: $1,962 (reported on 8.9% of returns)
Here:
$1,962
State:
$2,151
(% of AGI for various income ranges: 81.5% for AGIs below $25k, 46.4% for AGIs $25k-50k)
Percentage of individuals using paid preparers for their 2020 taxes: 90.0%
Here:
90%
State:
90%
(% for various income ranges: 89.5% for AGIs below $25k, 87.5% for AGIs $25k-50k, 92.9% for AGIs $50k-75k, 90.9% for AGIs $75k-100k, 91.3% for AGIs $100k-200k, 85.7% for AGIs over 200k)
Averages for the 2012 tax year for zip code 20675, filed in 2013:
Average Adjusted Gross Income (AGI) in 2012: $76,256 (Individual Income Tax Returns)
Here:
$76,256
State:
$72,703
Salary/wage: $69,457 (reported on 79.5% of returns)
Here:
$69,457
State:
$62,228
(% of AGI for various income ranges: 76.7% for AGIs below $25k, 73.1% for AGIs $25k-50k, 63.6% for AGIs $50k-75k, 74.6% for AGIs $75k-100k, 77.3% for AGIs $100k-200k, 66.9% for AGIs over 200k)
Taxable interest for individuals: $857 (reported on 50.0% of returns)
This zip code:
$857
Maryland:
$1,413
(% of AGI for various income ranges: 0.7% for AGIs below $25k, 0.9% for AGIs $25k-50k, 0.4% for AGIs $50k-75k, 0.4% for AGIs $75k-100k, 0.3% for AGIs $100k-200k, 0.9% for AGIs over 200k)
Ordinary dividends: $2,553 (reported on 17.0% of returns)
Here:
$2,553
State:
$6,933
(% of AGI for various income ranges: 0.4% for AGIs below $25k, 0.5% for AGIs $50k-75k, 0.9% for AGIs $75k-100k, 0.5% for AGIs $100k-200k, 0.9% for AGIs over 200k)
Net capital gain/loss in AGI: +$40 (reported on 11.4% of returns)
Here:
+$40
State:
+$14,830
Profit/loss from business: +$5,562 (reported on 14.8% of returns)
Here:
+$5,562
State:
+$12,606
(% of AGI for various income ranges: 7.8% for AGIs below $25k, 0.3% for AGIs $25k-50k, 2.7% for AGIs $50k-75k, 0.3% for AGIs $75k-100k, 1.0% for AGIs $100k-200k)
Taxable individual retirement arrangement distribution: $13,567 (reported on 6.8% of returns)
20675:
$13,567
Maryland:
$17,065
Total itemized deductions: $26,304 (23% of AGI, reported on 54.5% of returns)
Here:
$26,304
State:
$27,886
Here:
23.1% of AGI
State:
22.8% of AGI
(% of AGI for various income ranges: 10.8% for AGIs below $25k, 13.4% for AGIs $25k-50k, 21.3% for AGIs $50k-75k, 22.9% for AGIs $75k-100k, 20.2% for AGIs $100k-200k, 16.4% for AGIs over 200k)
Charity contributions: $3,944 (reported on 46.6% of returns)
Here:
$3,944
State:
$4,452
(% of AGI for various income ranges: 2.3% for AGIs $25k-50k, 2.3% for AGIs $50k-75k, 2.7% for AGIs $75k-100k, 2.9% for AGIs $100k-200k, 1.9% for AGIs over 200k)
Taxes paid: $11,136 (reported on 53.4% of returns)
20675:
$11,136
State:
$11,690
(% of AGI for various income ranges: 5.1% for AGIs $25k-50k, 7.5% for AGIs $50k-75k, 8.4% for AGIs $75k-100k, 8.8% for AGIs $100k-200k, 8.6% for AGIs over 200k)
Earned income credit: $2,033 (reported on 10.2% of returns)
Here:
$2,033
State:
$2,199
(% of AGI for various income ranges: 5.1% for AGIs below $25k, 0.6% for AGIs $25k-50k)
Percentage of individuals using paid preparers for their 2012 taxes: 55.7%
Here:
56%
State:
52%
(% for various income ranges: 43.5% for AGIs below $25k, 55.6% for AGIs $25k-50k, 61.5% for AGIs $50k-75k, 63.6% for AGIs $75k-100k, 61.1% for AGIs $100k-200k, 60.0% for AGIs over 200k)
Averages for the 2004 tax year for zip code 20675, filed in 2005:
Average Adjusted Gross Income (AGI) in 2004: $61,875 (Individual Income Tax Returns)
Here:
$61,875
State:
$60,339
Salary/wage: $57,032 (reported on 85.2% of returns)
Here:
$57,032
State:
$52,211
(% of AGI for various income ranges: 122.0% for AGIs below $10k, 73.3% for AGIs $10k-25k, 75.2% for AGIs $25k-50k, 78.4% for AGIs $50k-75k, 74.7% for AGIs $75k-100k, 80.3% for AGIs over 100k)
Taxable interest for individuals: $1,072 (reported on 56.0% of returns)
This zip code:
$1,072
Maryland:
$1,701
(% of AGI for various income ranges: 2.5% for AGIs below $10k, 0.7% for AGIs $10k-25k, 1.0% for AGIs $25k-50k, 0.7% for AGIs $50k-75k, 0.6% for AGIs $75k-100k, 1.1% for AGIs over 100k)
Taxable dividends: $1,478 (reported on 21.0% of returns)
Here:
$1,478
State:
$4,235
(% of AGI for various income ranges: 4.9% for AGIs below $10k, 0.3% for AGIs $10k-25k, 0.3% for AGIs $25k-50k, 0.1% for AGIs $50k-75k, 0.1% for AGIs $75k-100k, 0.7% for AGIs over 100k)
Net capital gain/loss: +$6,289 (reported on 15.1% of returns)
Here:
+$6,289
State:
+$15,888
(% of AGI for various income ranges: -0.6% for AGIs below $10k, -0.1% for AGIs $25k-50k, -0.2% for AGIs $50k-75k, 0.0% for AGIs $75k-100k, 3.0% for AGIs over 100k)
Profit/loss from business: +$4,780 (reported on 14.5% of returns)
Here:
+$4,780
State:
+$12,221
(% of AGI for various income ranges: 5.9% for AGIs $10k-25k, -0.8% for AGIs $25k-50k, -0.2% for AGIs $50k-75k, 0.2% for AGIs $75k-100k, 1.8% for AGIs over 100k)
IRA payment deduction: $3,050 (reported on 2.4% of returns)
20675:
$3,050
Maryland:
$2,968
Total itemized deductions: $22,892 (25% of AGI, reported on 56.7% of returns)
Here:
$22,892
State:
$22,960
Here:
24.7% of AGI
State:
23.3% of AGI
(% of AGI for various income ranges: 59.5% for AGIs below $10k, 12.1% for AGIs $10k-25k, 20.5% for AGIs $25k-50k, 25.8% for AGIs $50k-75k, 22.4% for AGIs $75k-100k, 19.5% for AGIs over 100k)
Charity contributions deductions: $3,578 (4% of AGI, reported on 54.0% of returns)
Here:
$3,578
State:
$4,031
Here:
3.8% of AGI
State:
3.9% of AGI
(% of AGI for various income ranges: 2.2% for AGIs $10k-25k, 3.3% for AGIs $25k-50k, 3.6% for AGIs $50k-75k, 3.9% for AGIs $75k-100k, 2.9% for AGIs over 100k)
Total tax: $9,006 (reported on 80.8% of returns)
20675:
$9,006
State:
$10,167
(% of AGI for various income ranges: 3.0% for AGIs below $10k, 4.2% for AGIs $10k-25k, 6.6% for AGIs $25k-50k, 8.7% for AGIs $50k-75k, 9.8% for AGIs $75k-100k, 15.3% for AGIs over 100k)
Earned income credit: $1,792 (reported on 9.1% of returns)
Here:
$1,792
State:
$1,700
Percentage of individuals using paid preparers for their 2004 taxes: 55.8%
Here:
56%
State:
55%
(% for various income ranges: 38.9% for AGIs below $10k, 55.7% for AGIs $10k-25k, 62.6% for AGIs $25k-50k, 66.1% for AGIs $50k-75k, 53.2% for AGIs $75k-100k, 56.4% for AGIs over 100k)
Household received Food Stamps/SNAP in the past 12 months: 12 Household did not receive Food Stamps/SNAP in the past 12 months: 764
Women who did not have a birth in the past 12 months: 437 (166 now married, 271 unmarried)
Housing units in zip code 20675 with a mortgage: 577 (28 second mortgage, 7 home equity loan, 21 both second mortgage and home equity loan) Houses without a mortgage: 19
Median monthly owner costs for units with a mortgage: $2,092 Median monthly owner costs for units without a mortgage: $724
Residents with income below the poverty level in 2022:
This zip code:
0.3%
Whole state:
9.6%
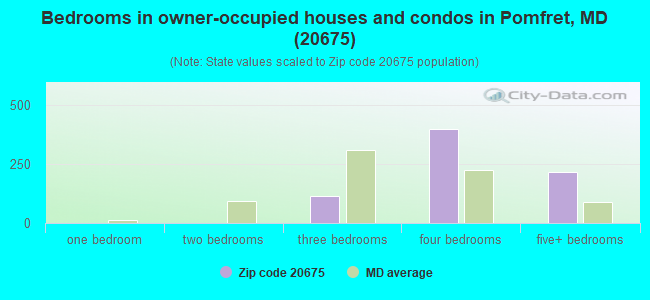
Median number of rooms in houses and condos:
Here:
8.1
State:
7.3
Median number of rooms in apartments:
Here:
9.8
State:
4.2
Notable locations in this zip code not listed on our city pages
Size of family households: 413 2-persons, 145 3-persons, 60 4-persons, 54 5-persons, 18 6-persons
Size of nonfamily households: 81 1-person, 8 2-persons
247 married couples with children.
0 single-parent households ().
89.2% of residents of 20675 zip code speak English at home.
9.4% of residents speak Spanish at home (48% very well, 30% well, 22% not well).
0.6% of residents speak other Indo-European language at home (100% very well).
0.7% of residents speak Asian or Pacific Island language at home (8% very well, 92% well).
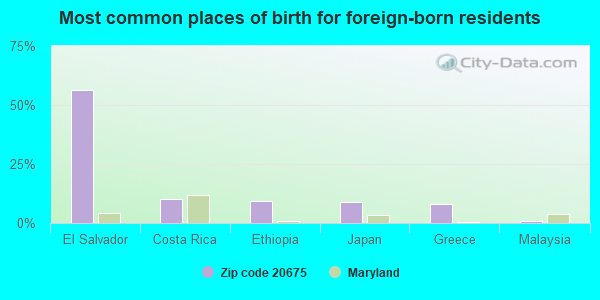
Foreign born population: 137 (6.7%) (31.1% of them are naturalized citizens)
This zip code:
6.7%
Whole state:
16.7%
56%El Salvador
10%Costa Rica
9%Ethiopia
9%Japan
8%Greece
1%Malaysia
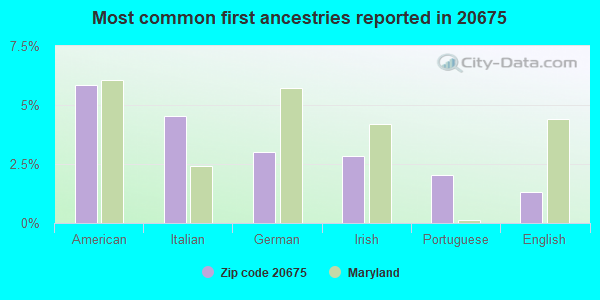
6%American
5%Italian
3%German
3%Irish
2%Portuguese
1%English
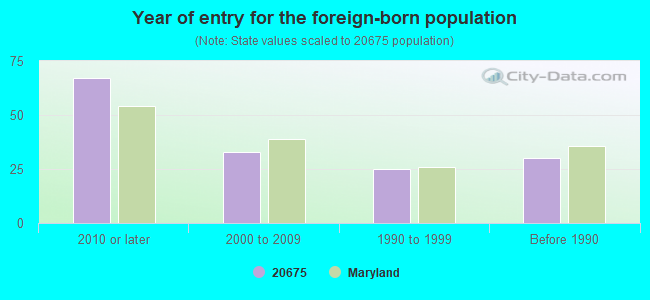
Year of entry for the foreign-born population
672010 or later
332000 to 2009
251990 to 1999
30Before 1990
Facilities with environmental interests located in this zip code:
CHARLES COUNTY CAREER AND TECHNOLOGY CENTER (7775 MARSHALL CORNER ROAD in POMFRET, MD)
AIR MINOR (AIRS/AFS) STATE MASTER (Maryland Air Emissions Database) - AIR MINOR (National Center for Education Statistics) - STATE ID-080607 Business SIC classification: ELEMENTARY AND SECONDARY SCHOOLS Organizations: CHARLES COUNTY BOARD OF EDUCATION (SCHOOL DISTRICT)
Alternative names: CHARLES COUNTY VO-TECH CENTER, VO-TECHNICAL CENTER
DR. JAMES CRAIK ELEMENTARY SCHOOL (7725 MARSHALL CORNER RD in POMFRET, MD)
(National Center for Education Statistics) - STATE ID-080609 Organizations: CHARLES COUNTY BOARD OF EDUCATION (SCHOOL DISTRICT)
DR. JAMES CRAIK E.S. (ROUTE 2, BOX 76 in POMFRETT, MD)
COMPLIANCE ACTIVITY (Tracking inspections of insecticide, fungicide, and rodenticide, and toxic substances)
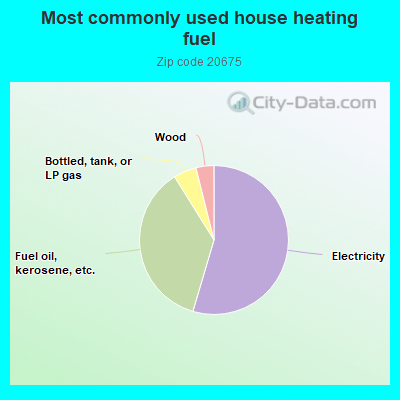
54.8%Electricity
36.7%Fuel oil, kerosene, etc.
5.0%Bottled, tank, or LP gas
3.9%Wood
Population in 1990: 1,410. Population change in the 1990s: +397 (+28.2%).
Place of birth for U.S.-born residents:
This state: 605
Northeast: 97
Midwest: 164
South: 860
West: 151
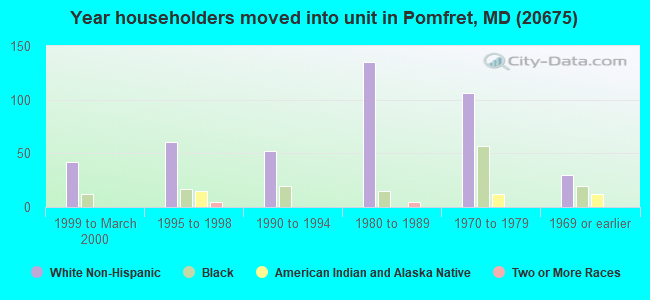
72% of the 20675 zip code residents lived in the same house 5 years ago. Out of people who lived in different houses, 52% lived in this county. Out of people who lived in different counties, 50% lived in Maryland.
92% of the 20675 zip code residents lived in the same house 1 year ago. Out of people who lived in different houses, 23% moved from different county within same state. Out of people who lived in different houses, 78% moved from different state.
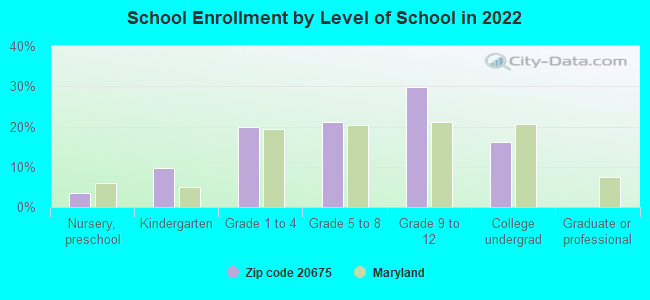
Private vs. public school enrollment:
Students in private schools in grades 1 to 8 (elementary and middle school): 12
Here:
11.5%
Maryland:
15.2%
Students in private schools in grades 9 to 12 (high school): 10
Here:
13.7%
Maryland:
14.4%
Students in private undergraduate colleges:
Here:
0.0%
Maryland:
20.2%
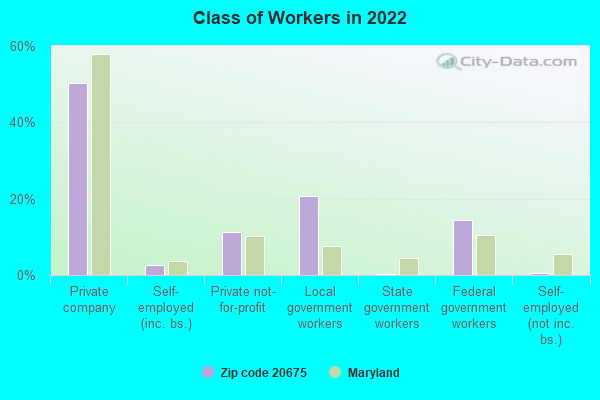
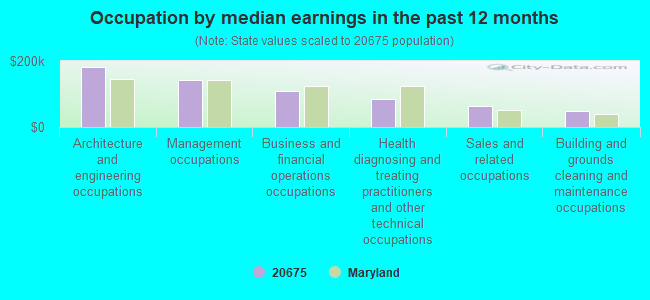
Occupation by median earnings in the past 12 months ($)
182,717Architecture and engineering occupations
141,546Management occupations
109,006Business and financial operations occupations
84,068Health diagnosing and treating practitioners and other technical occupations
63,462Sales and related occupations
48,554Building and grounds cleaning and maintenance occupations
Top industries in this zip code by the number of employees in 2005:
Construction: Drywall and Insulation Contractors (50-99 employees: 1 establishment)
Other Services (except Public Administration): Religious Organizations (10-19: 1, 1-4: 1)
Construction: Plumbing, Heating, and Air-Conditioning Contractors (5-9: 1, 1-4: 1)
Administrative and Support and Waste Management and Remediation Services: Investigation Services (5-9: 1)
Other Services (except Public Administration): Reupholstery and Furniture Repair (5-9: 1)
Construction: Residential Remodelers (1-4: 3)
Real Estate and Rental and Leasing: Offices of Real Estate Agents and Brokers (1-4: 2)
Other Services (except Public Administration): General Automotive Repair (1-4: 1)
Home Mortgage Disclosure Act Aggregated Statistics For Year 2009 (Based on 4 partial tracts)
A) FHA, FSA/RHS & VA Home Purchase Loans
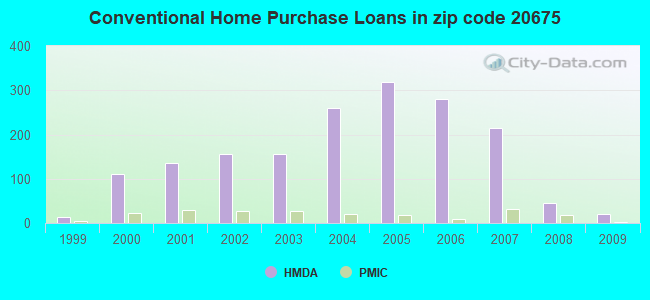
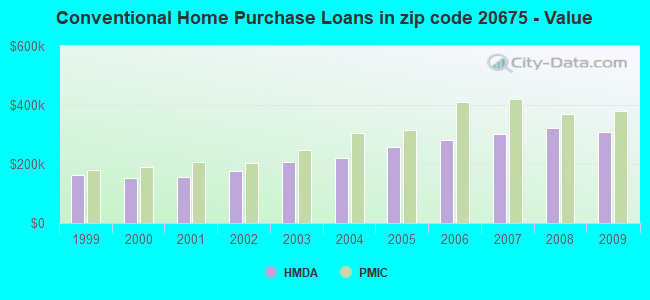
B) Conventional Home Purchase Loans
C) Refinancings
D) Home Improvement Loans
F) Non-occupant Loans on < 5 Family Dwellings (A B C & D)
G) Loans On Manufactured Home Dwelling (A B C & D)
Number
Average Value
Number
Average Value
Number
Average Value
Number
Average Value
Number
Average Value
Number
Average Value
LOANS ORIGINATED
107
$353,278
20
$308,057
219
$284,021
15
$81,788
5
$197,338
0
$0
APPLICATIONS APPROVED, NOT ACCEPTED
7
$366,250
3
$312,660
19
$305,160
3
$76,990
2
$252,430
0
$0
APPLICATIONS DENIED
11
$300,498
4
$222,682
95
$323,111
11
$30,851
7
$148,200
1
$26,710
APPLICATIONS WITHDRAWN
24
$352,911
4
$246,625
86
$297,109
4
$118,235
4
$162,225
0
$0
FILES CLOSED FOR INCOMPLETENESS
0
$0
1
$149,120
16
$291,421
1
$113,510
1
$111,280
0
$0
Aggregated Statistics For Year 2008 (Based on 4 partial tracts)
A) FHA, FSA/RHS & VA Home Purchase Loans
B) Conventional Home Purchase Loans
C) Refinancings
D) Home Improvement Loans
F) Non-occupant Loans on < 5 Family Dwellings (A B C & D)
Number
Average Value
Number
Average Value
Number
Average Value
Number
Average Value
Number
Average Value
LOANS ORIGINATED
73
$391,895
45
$321,608
156
$277,770
22
$83,873
11
$248,856
APPLICATIONS APPROVED, NOT ACCEPTED
4
$340,225
6
$311,692
25
$308,644
9
$39,808
0
$0
APPLICATIONS DENIED
20
$402,566
18
$325,373
101
$339,202
26
$122,466
5
$219,314
APPLICATIONS WITHDRAWN
14
$371,855
15
$366,133
72
$338,326
3
$81,230
1
$38,950
FILES CLOSED FOR INCOMPLETENESS
1
$471,640
2
$384,745
12
$328,795
2
$110,825
1
$313,630
Aggregated Statistics For Year 2007 (Based on 4 partial tracts)
A) FHA, FSA/RHS & VA Home Purchase Loans
B) Conventional Home Purchase Loans
C) Refinancings
D) Home Improvement Loans
F) Non-occupant Loans on < 5 Family Dwellings (A B C & D)
G) Loans On Manufactured Home Dwelling (A B C & D)
Number
Average Value
Number
Average Value
Number
Average Value
Number
Average Value
Number
Average Value
Number
Average Value
LOANS ORIGINATED
11
$363,578
214
$300,496
246
$278,852
36
$101,130
8
$202,426
1
$142,330
APPLICATIONS APPROVED, NOT ACCEPTED
1
$215,880
26
$260,468
44
$317,718
12
$114,408
3
$209,503
1
$77,340
APPLICATIONS DENIED
2
$326,565
74
$295,565
194
$340,319
36
$136,982
8
$345,314
3
$68,390
APPLICATIONS WITHDRAWN
2
$436,680
44
$340,801
106
$329,531
7
$168,691
5
$332,266
0
$0
FILES CLOSED FOR INCOMPLETENESS
0
$0
11
$297,591
35
$331,209
5
$219,212
1
$49,480
0
$0
Aggregated Statistics For Year 2006 (Based on 4 partial tracts)
A) FHA, FSA/RHS & VA Home Purchase Loans
B) Conventional Home Purchase Loans
C) Refinancings
D) Home Improvement Loans
F) Non-occupant Loans on < 5 Family Dwellings (A B C & D)
Number
Average Value
Number
Average Value
Number
Average Value
Number
Average Value
Number
Average Value
LOANS ORIGINATED
12
$364,750
280
$281,664
439
$290,882
64
$135,190
17
$230,333
APPLICATIONS APPROVED, NOT ACCEPTED
1
$154,050
39
$301,865
66
$291,259
9
$111,087
4
$213,532
APPLICATIONS DENIED
1
$520,570
72
$307,425
204
$334,871
40
$145,994
12
$248,019
APPLICATIONS WITHDRAWN
3
$354,197
50
$296,720
154
$312,200
7
$195,337
5
$234,406
FILES CLOSED FOR INCOMPLETENESS
1
$195,850
9
$293,679
31
$287,552
3
$103,860
1
$336,620
Aggregated Statistics For Year 2005 (Based on 4 partial tracts)
A) FHA, FSA/RHS & VA Home Purchase Loans
B) Conventional Home Purchase Loans
C) Refinancings
D) Home Improvement Loans
E) Loans on Dwellings For 5+ Families
F) Non-occupant Loans on < 5 Family Dwellings (A B C & D)
G) Loans On Manufactured Home Dwelling (A B C & D)
Number
Average Value
Number
Average Value
Number
Average Value
Number
Average Value
Number
Average Value
Number
Average Value
Number
Average Value
LOANS ORIGINATED
8
$301,284
318
$256,273
516
$269,966
57
$118,065
0
$0
13
$222,897
1
$51,610
APPLICATIONS APPROVED, NOT ACCEPTED
0
$0
23
$257,562
57
$244,358
11
$57,581
0
$0
2
$130,710
1
$31,400
APPLICATIONS DENIED
1
$319,370
59
$237,143
167
$272,310
35
$132,666
0
$0
7
$251,883
1
$63,990
APPLICATIONS WITHDRAWN
0
$0
49
$257,994
170
$280,751
14
$125,144
1
$377,240
6
$207,982
0
$0
FILES CLOSED FOR INCOMPLETENESS
0
$0
9
$253,319
37
$271,489
4
$180,925
0
$0
0
$0
0
$0
Aggregated Statistics For Year 2004 (Based on 4 partial tracts)
A) FHA, FSA/RHS & VA Home Purchase Loans
B) Conventional Home Purchase Loans
C) Refinancings
D) Home Improvement Loans
F) Non-occupant Loans on < 5 Family Dwellings (A B C & D)
G) Loans On Manufactured Home Dwelling (A B C & D)
Number
Average Value
Number
Average Value
Number
Average Value
Number
Average Value
Number
Average Value
Number
Average Value
LOANS ORIGINATED
19
$257,096
261
$218,863
447
$227,098
48
$52,522
18
$211,673
0
$0
APPLICATIONS APPROVED, NOT ACCEPTED
2
$210,040
23
$232,810
52
$215,677
11
$51,036
0
$0
0
$0
APPLICATIONS DENIED
1
$269,500
28
$226,809
149
$228,614
34
$68,218
2
$176,655
1
$37,000
APPLICATIONS WITHDRAWN
2
$283,485
29
$240,798
156
$217,156
16
$74,674
3
$137,987
1
$11,680
FILES CLOSED FOR INCOMPLETENESS
1
$155,790
4
$255,690
28
$257,236
2
$38,375
0
$0
0
$0
Aggregated Statistics For Year 2003 (Based on 4 partial tracts)
A) FHA, FSA/RHS & VA Home Purchase Loans
B) Conventional Home Purchase Loans
C) Refinancings
D) Home Improvement Loans
F) Non-occupant Loans on < 5 Family Dwellings (A B C & D)
Number
Average Value
Number
Average Value
Number
Average Value
Number
Average Value
Number
Average Value
LOANS ORIGINATED
67
$221,044
156
$205,933
791
$187,698
40
$47,974
14
$153,949
APPLICATIONS APPROVED, NOT ACCEPTED
3
$164,880
14
$205,876
101
$175,792
10
$27,461
2
$98,970
APPLICATIONS DENIED
5
$217,996
13
$200,725
129
$186,882
14
$34,945
1
$91,940
APPLICATIONS WITHDRAWN
6
$222,580
20
$181,560
136
$195,213
5
$23,536
1
$290,370
FILES CLOSED FOR INCOMPLETENESS
1
$316,760
3
$280,133
25
$207,953
1
$64,680
0
$0
Aggregated Statistics For Year 2002 (Based on 4 partial tracts)
A) FHA, FSA/RHS & VA Home Purchase Loans
B) Conventional Home Purchase Loans
C) Refinancings
D) Home Improvement Loans
F) Non-occupant Loans on < 5 Family Dwellings (A B C & D)
Number
Average Value
Number
Average Value
Number
Average Value
Number
Average Value
Number
Average Value
LOANS ORIGINATED
119
$203,427
157
$175,710
465
$172,108
28
$27,892
9
$131,761
APPLICATIONS APPROVED, NOT ACCEPTED
5
$205,496
16
$177,291
59
$183,354
3
$49,193
1
$55,640
APPLICATIONS DENIED
9
$183,510
17
$165,484
100
$159,808
19
$17,125
1
$87,910
APPLICATIONS WITHDRAWN
8
$187,365
18
$156,324
89
$171,420
3
$18,617
1
$153,980
FILES CLOSED FOR INCOMPLETENESS
1
$255,390
3
$167,290
20
$171,607
0
$0
0
$0
Aggregated Statistics For Year 2001 (Based on 4 partial tracts)
A) FHA, FSA/RHS & VA Home Purchase Loans
B) Conventional Home Purchase Loans
C) Refinancings
D) Home Improvement Loans
F) Non-occupant Loans on < 5 Family Dwellings (A B C & D)
Number
Average Value
Number
Average Value
Number
Average Value
Number
Average Value
Number
Average Value
LOANS ORIGINATED
141
$183,837
135
$154,490
327
$158,442
28
$22,962
6
$109,113
APPLICATIONS APPROVED, NOT ACCEPTED
3
$178,427
8
$149,174
39
$139,465
5
$51,326
1
$31,160
APPLICATIONS DENIED
9
$173,112
19
$155,728
106
$119,957
19
$21,695
1
$84,500
APPLICATIONS WITHDRAWN
14
$167,137
16
$181,444
76
$137,421
7
$29,390
2
$84,575
FILES CLOSED FOR INCOMPLETENESS
1
$86,240
1
$48,960
16
$155,998
1
$11,130
0
$0
Aggregated Statistics For Year 2000 (Based on 4 partial tracts)
A) FHA, FSA/RHS & VA Home Purchase Loans
B) Conventional Home Purchase Loans
C) Refinancings
D) Home Improvement Loans
F) Non-occupant Loans on < 5 Family Dwellings (A B C & D)
Number
Average Value
Number
Average Value
Number
Average Value
Number
Average Value
Number
Average Value
LOANS ORIGINATED
78
$178,276
110
$152,412
60
$124,347
38
$20,378
5
$97,438
APPLICATIONS APPROVED, NOT ACCEPTED
3
$182,543
16
$159,770
10
$89,261
14
$27,486
0
$0
APPLICATIONS DENIED
7
$161,697
20
$160,232
68
$100,216
26
$24,825
3
$66,443
APPLICATIONS WITHDRAWN
12
$175,659
19
$138,137
19
$106,670
6
$19,160
1
$8,350
FILES CLOSED FOR INCOMPLETENESS
1
$115,480
2
$167,140
4
$97,280
1
$13,910
0
$0
Aggregated Statistics For Year 1999 (Based on 1 partial tract)
A) FHA, FSA/RHS & VA Home Purchase Loans
B) Conventional Home Purchase Loans
C) Refinancings
D) Home Improvement Loans
F) Non-occupant Loans on < 5 Family Dwellings (A B C & D)
Detailed PMIC statistics for the following Tracts:8506.00
, 8507.01
2002 - 2018 National Fire Incident Reporting System (NFIRS) incidents
According to the data from the years 2002 - 2018 the average number of fire incidents per year is 10. The highest number of fires - 26 took place in 2015, and the least - 1 in 2007. The data has an increasing trend.
When looking into fire subcategories, the most incidents belonged to: Structure Fires (61.2%), and Outside Fires (27.9%).
Fire incident types reported to NFIRS in Zip Code 20675


 Nearest zip codes: 20695, 20646, 20603, 20677, 20607, 20616.


 According to the data from the years 2002 - 2018 the average number of fire incidents per year is 10. The highest number of fires - 26 took place in 2015, and the least - 1 in 2007. The data has an increasing trend.
 When looking into fire subcategories, the most incidents belonged to: Structure Fires (61.2%), and Outside Fires (27.9%).