Estimated zip code population in 2022: 4,101 Zip code population in 2010: 4,063 Zip code population in 2000: 3,497
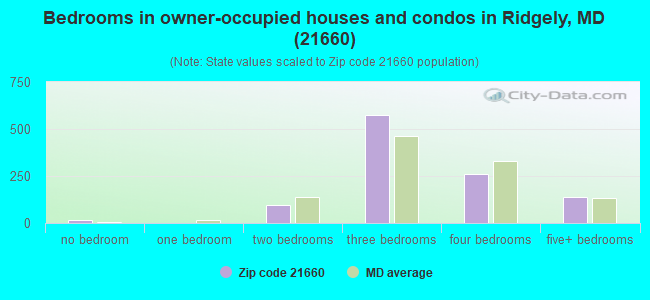
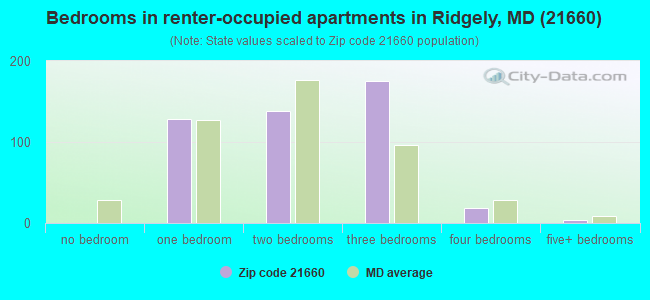
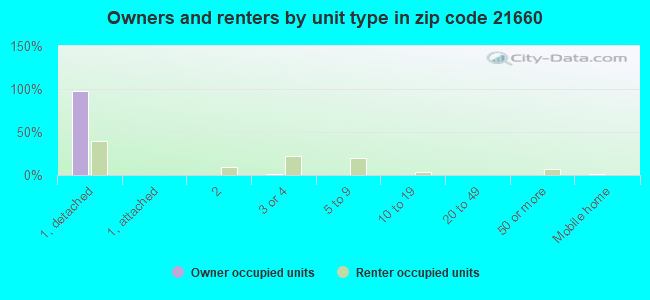
Houses and condos: 1,619 Renter-occupied apartments: 471
% of renters here:
30%
State:
32%
March 2022 cost of living index in zip code 21660: 91.5 (less than average, U.S. average is 100)
Land area: 33.1 sq. mi. Water area: 0.1 sq. mi.
Population density: 124 people per square mile
(very low).
OSM Map
General Map
Google Map
MSN Map
OSM Map
General Map
Google Map
MSN Map
OSM Map
General Map
Google Map
MSN Map
OSM Map
General Map
Google Map
MSN Map
Please wait while loading the map...
Real estate property taxes paid for housing units in 2022:
This zip code:
0.9% ($2,717)
Maryland:
0.9% ($3,777)
Median real estate property taxes paid for housing units with mortgages in 2022: $2,830 (0.9%) Median real estate property taxes paid for housing units with no mortgage in 2022: $2,452 (0.9%)
Business Search- 14 Million verified businesses
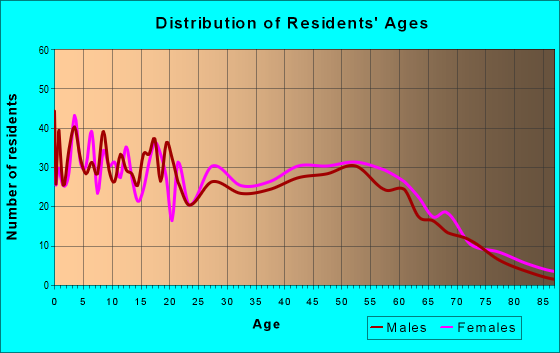
Males: 1,793
(43.7%)
Females: 2,308
(56.3%)
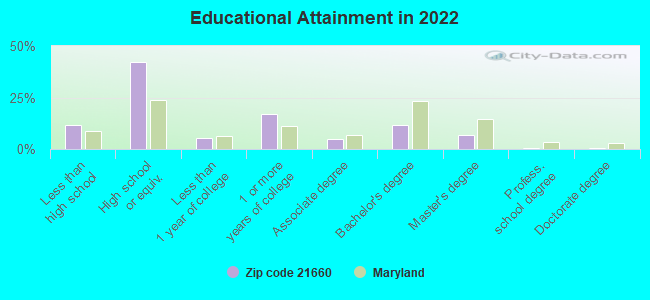
For population 25 years and over in 21660:
High school or higher: 85.8%
Bachelor's degree or higher: 18.7%
Graduate or professional degree: 7.4%
Unemployed: 4.1%
Mean travel time to work (commute): 36.7 minutes
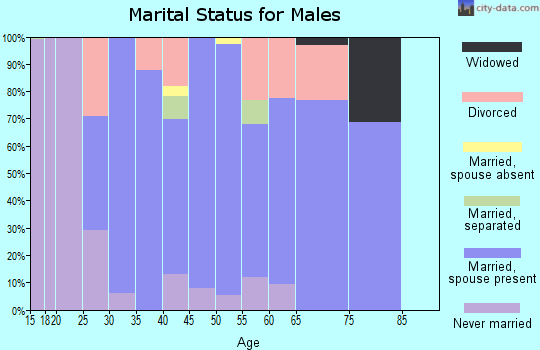
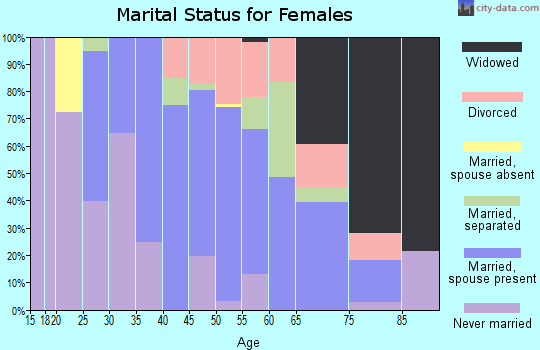
For population 15 years and over in 21660:
Never married: 34.2%
Now married: 49.0%
Separated: 0.8%
Widowed: 7.4%
Divorced: 8.7%
Zip code 21660 compared to state average:
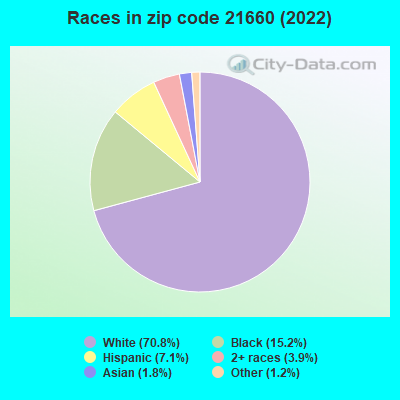
Black race population percentage below state average.
Foreign-born population percentage significantly below state average.
Length of stay since moving in above state average.
Percentage of population with a bachelor's degree or higher significantly below state average.
Averages for the 2020 tax year for zip code 21660, filed in 2021:
Average Adjusted Gross Income (AGI) in 2020: $59,255 (Individual Income Tax Returns)
Here:
$59,255
State:
$86,905
Salary/wage: $53,054 (reported on 84.4% of returns)
Here:
$53,054
State:
$73,953
(% of AGI for various income ranges: 1194.5% for AGIs below $25k, 3786.3% for AGIs $25k-50k, 7123.9% for AGIs $50k-75k, 10354.2% for AGIs $75k-100k, 17600.5% for AGIs $100k-200k)
Taxable interest for individuals: $470 (reported on 30.2% of returns)
This zip code:
$470
Maryland:
$1,528
(% of AGI for various income ranges: 6.6% for AGIs below $25k, 10.5% for AGIs $25k-50k, 19.6% for AGIs $50k-75k, 19.2% for AGIs $75k-100k, 62.6% for AGIs $100k-200k)
Ordinary dividends: $2,635 (reported on 11.6% of returns)
Here:
$2,635
State:
$8,028
(% of AGI for various income ranges: 15.9% for AGIs below $25k, 25.8% for AGIs $25k-50k, 27.4% for AGIs $50k-75k, 43.3% for AGIs $75k-100k, 170.0% for AGIs $100k-200k)
Net capital gain/loss in AGI: +$5,143 (reported on 10.6% of returns)
Here:
+$5,143
State:
+$25,238
(% of AGI for various income ranges: 7.0% for AGIs below $25k, 21.1% for AGIs $25k-50k, 6.5% for AGIs $50k-75k, 40.8% for AGIs $75k-100k, 476.3% for AGIs $100k-200k)
Profit/loss from business: +$7,908 (reported on 18.1% of returns)
Here:
+$7,908
State:
+$11,398
(% of AGI for various income ranges: 76.1% for AGIs below $25k, 144.7% for AGIs $25k-50k, 240.4% for AGIs $50k-75k, 368.3% for AGIs $75k-100k, 508.9% for AGIs $100k-200k)
Taxable individual retirement arrangement distribution: $16,221 (reported on 7.0% of returns)
21660:
$16,221
Maryland:
$20,944
(% of AGI for various income ranges: 34.5% for AGIs below $25k, 53.7% for AGIs $25k-50k, 291.3% for AGIs $50k-75k, 655.3% for AGIs $100k-200k)
Total itemized deductions: $24,046 (reported on 13.1% of returns)
Here:
$24,046
State:
$30,672
(% of AGI for various income ranges: 228.2% for AGIs $25k-50k, 453.9% for AGIs $50k-75k, 884.2% for AGIs $75k-100k, 1243.7% for AGIs $100k-200k)
Charity contributions: $5,021 (reported on 9.5% of returns)
Here:
$5,021
State:
$9,065
(% of AGI for various income ranges: 25.3% for AGIs $25k-50k, 52.6% for AGIs $50k-75k, 94.2% for AGIs $75k-100k, 328.4% for AGIs $100k-200k)
Taxes paid: $7,658 (reported on 13.1% of returns)
21660:
$7,658
State:
$8,475
(% of AGI for various income ranges: 54.2% for AGIs $25k-50k, 166.5% for AGIs $50k-75k, 321.7% for AGIs $75k-100k, 424.2% for AGIs $100k-200k)
Earned income credit: $2,126 (reported on 15.6% of returns)
Here:
$2,126
State:
$2,151
(% of AGI for various income ranges: 101.1% for AGIs below $25k, 56.3% for AGIs $25k-50k)
Percentage of individuals using paid preparers for their 2020 taxes: 92.0%
Here:
92%
State:
90%
(% for various income ranges: 90.2% for AGIs below $25k, 93.9% for AGIs $25k-50k, 94.1% for AGIs $50k-75k, 89.5% for AGIs $75k-100k, 93.5% for AGIs $100k-200k, 80.0% for AGIs over 200k)
Averages for the 2012 tax year for zip code 21660, filed in 2013:
Average Adjusted Gross Income (AGI) in 2012: $47,495 (Individual Income Tax Returns)
Here:
$47,495
State:
$72,703
Salary/wage: $41,991 (reported on 88.4% of returns)
Here:
$41,991
State:
$62,228
(% of AGI for various income ranges: 78.3% for AGIs below $25k, 81.6% for AGIs $25k-50k, 77.4% for AGIs $50k-75k, 79.8% for AGIs $75k-100k, 75.7% for AGIs $100k-200k)
Taxable interest for individuals: $507 (reported on 33.7% of returns)
This zip code:
$507
Maryland:
$1,413
(% of AGI for various income ranges: 0.6% for AGIs below $25k, 0.5% for AGIs $25k-50k, 0.5% for AGIs $50k-75k, 0.1% for AGIs $75k-100k, 0.2% for AGIs $100k-200k)
Ordinary dividends: $1,689 (reported on 10.5% of returns)
Here:
$1,689
State:
$6,933
(% of AGI for various income ranges: 0.8% for AGIs below $25k, 0.5% for AGIs $25k-50k, 0.3% for AGIs $50k-75k, 0.4% for AGIs $75k-100k, 0.2% for AGIs $100k-200k)
Net capital gain/loss in AGI: +$1,717 (reported on 7.0% of returns)
Here:
+$1,717
State:
+$14,830
(% of AGI for various income ranges: 0.8% for AGIs $100k-200k)
Profit/loss from business: +$10,069 (reported on 16.9% of returns)
Here:
+$10,069
State:
+$12,606
(% of AGI for various income ranges: 6.1% for AGIs below $25k, 3.1% for AGIs $25k-50k, 5.2% for AGIs $50k-75k, 2.9% for AGIs $75k-100k, 2.5% for AGIs $100k-200k)
Taxable individual retirement arrangement distribution: $9,736 (reported on 8.1% of returns)
21660:
$9,736
Maryland:
$17,065
(% of AGI for various income ranges: 2.6% for AGIs below $25k, 1.4% for AGIs $25k-50k, 1.6% for AGIs $50k-75k, 2.4% for AGIs $100k-200k)
Total itemized deductions: $20,567 (26% of AGI, reported on 40.1% of returns)
Here:
$20,567
State:
$27,886
Here:
26.2% of AGI
State:
22.8% of AGI
(% of AGI for various income ranges: 9.1% for AGIs below $25k, 14.1% for AGIs $25k-50k, 18.2% for AGIs $50k-75k, 21.1% for AGIs $75k-100k, 19.4% for AGIs $100k-200k)
Charity contributions: $2,294 (reported on 28.5% of returns)
Here:
$2,294
State:
$4,452
(% of AGI for various income ranges: 0.5% for AGIs below $25k, 1.2% for AGIs $25k-50k, 1.5% for AGIs $50k-75k, 2.0% for AGIs $75k-100k, 1.3% for AGIs $100k-200k)
Taxes paid: $7,701 (reported on 40.1% of returns)
21660:
$7,701
State:
$11,690
(% of AGI for various income ranges: 2.2% for AGIs below $25k, 4.0% for AGIs $25k-50k, 6.0% for AGIs $50k-75k, 8.3% for AGIs $75k-100k, 8.6% for AGIs $100k-200k)
Earned income credit: $1,997 (reported on 19.8% of returns)
Here:
$1,997
State:
$2,199
(% of AGI for various income ranges: 6.2% for AGIs below $25k, 1.0% for AGIs $25k-50k)
Percentage of individuals using paid preparers for their 2012 taxes: 52.3%
Here:
52%
State:
52%
(% for various income ranges: 47.0% for AGIs below $25k, 52.3% for AGIs $25k-50k, 57.7% for AGIs $50k-75k, 56.2% for AGIs $75k-100k, 60.0% for AGIs $100k-200k)
Averages for the 2004 tax year for zip code 21660, filed in 2005:
Average Adjusted Gross Income (AGI) in 2004: $40,360 (Individual Income Tax Returns)
Here:
$40,360
State:
$60,339
Salary/wage: $36,150 (reported on 88.1% of returns)
Here:
$36,150
State:
$52,211
(% of AGI for various income ranges: 87.7% for AGIs below $10k, 81.2% for AGIs $10k-25k, 83.5% for AGIs $25k-50k, 83.4% for AGIs $50k-75k, 88.4% for AGIs $75k-100k, 58.9% for AGIs over 100k)
Taxable interest for individuals: $1,098 (reported on 41.2% of returns)
This zip code:
$1,098
Maryland:
$1,701
(% of AGI for various income ranges: 3.4% for AGIs below $10k, 2.1% for AGIs $10k-25k, 1.4% for AGIs $25k-50k, 0.8% for AGIs $50k-75k, 0.7% for AGIs $75k-100k, 0.7% for AGIs over 100k)
Taxable dividends: $986 (reported on 13.8% of returns)
Here:
$986
State:
$4,235
(% of AGI for various income ranges: 1.9% for AGIs below $10k, 0.2% for AGIs $10k-25k, 0.1% for AGIs $25k-50k, 0.6% for AGIs $50k-75k, 0.2% for AGIs $75k-100k, 0.3% for AGIs over 100k)
Net capital gain/loss: +$19,361 (reported on 9.2% of returns)
Here:
+$19,361
State:
+$15,888
(% of AGI for various income ranges: -0.3% for AGIs below $10k, -0.2% for AGIs $10k-25k, -0.1% for AGIs $25k-50k, 1.6% for AGIs $50k-75k, 0.2% for AGIs $75k-100k, 19.1% for AGIs over 100k)
Profit/loss from business: +$6,707 (reported on 17.9% of returns)
Here:
+$6,707
State:
+$12,221
(% of AGI for various income ranges: 3.8% for AGIs below $10k, 5.7% for AGIs $10k-25k, 4.2% for AGIs $25k-50k, 1.9% for AGIs $50k-75k, 1.2% for AGIs $75k-100k, 2.5% for AGIs over 100k)
IRA payment deduction: $2,600 (reported on 2.2% of returns)
21660:
$2,600
Maryland:
$2,968
Total itemized deductions: $16,297 (24% of AGI, reported on 40.5% of returns)
Here:
$16,297
State:
$22,960
Here:
24.5% of AGI
State:
23.3% of AGI
(% of AGI for various income ranges: 12.1% for AGIs below $10k, 8.7% for AGIs $10k-25k, 17.4% for AGIs $25k-50k, 19.1% for AGIs $50k-75k, 19.1% for AGIs $75k-100k, 14.6% for AGIs over 100k)
Charity contributions deductions: $1,947 (3% of AGI, reported on 31.7% of returns)
Here:
$1,947
State:
$4,031
Here:
2.8% of AGI
State:
3.9% of AGI
(% of AGI for various income ranges: 0.6% for AGIs below $10k, 1.0% for AGIs $10k-25k, 1.7% for AGIs $25k-50k, 1.7% for AGIs $50k-75k, 1.4% for AGIs $75k-100k, 1.7% for AGIs over 100k)
Total tax: $4,814 (reported on 75.6% of returns)
21660:
$4,814
State:
$10,167
(% of AGI for various income ranges: 4.0% for AGIs below $10k, 3.9% for AGIs $10k-25k, 6.5% for AGIs $25k-50k, 7.8% for AGIs $50k-75k, 9.6% for AGIs $75k-100k, 16.2% for AGIs over 100k)
Earned income credit: $1,763 (reported on 19.2% of returns)
Here:
$1,763
State:
$1,700
Percentage of individuals using paid preparers for their 2004 taxes: 60.6%
Here:
61%
State:
55%
(% for various income ranges: 51.6% for AGIs below $10k, 63.6% for AGIs $10k-25k, 60.9% for AGIs $25k-50k, 60.6% for AGIs $50k-75k, 66.9% for AGIs $75k-100k, 60.8% for AGIs over 100k)
Household received Food Stamps/SNAP in the past 12 months: 202 Household did not receive Food Stamps/SNAP in the past 12 months: 1,356
Women who had a birth in the past 12 months: 36 (33 now married, 3 unmarried) Women who did not have a birth in the past 12 months: 966 (355 now married, 611 unmarried)
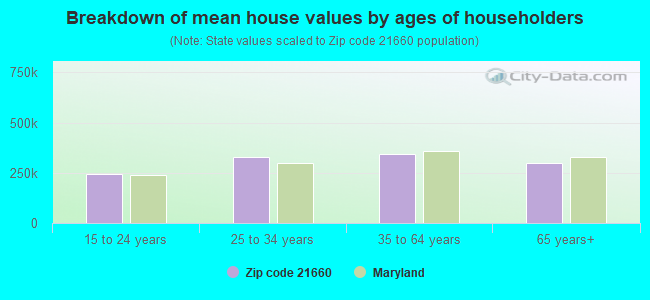
Housing units in zip code 21660 with a mortgage: 856 (77 second mortgage, 6 home equity loan, 56 both second mortgage and home equity loan) Median monthly owner costs for units with a mortgage: $1,723 Median monthly owner costs for units without a mortgage: $714
Residents with income below the poverty level in 2022:
This zip code:
6.2%
Whole state:
9.6%
Residents with income below 50% of the poverty level in 2022:
This zip code:
2.1%
Whole state:
4.7%
Median number of rooms in houses and condos:
Here:
6.8
State:
7.3
Median number of rooms in apartments:
Here:
4.4
State:
4.2
Notable locations in this zip code not listed on our city pages
Notable locations in zip code 21660: Ja-Mar (A), Mitchell Corner (B), Oasis (C), Obers Corner (D), Ridgely Branch Library (E), Ridgely Town Hall (F), The Caroline Center (G), Ridgely Volunteer Fire Department (H), Ridgely Police Department (I). Display/hide their locations on the map
Churches in zip code 21660 include: New Hope Baptist Church (A), The Church of Jesus Christ of Latter Day Saints (B), Saint Gertrudes Convent (C), Trinity Church (D). Display/hide their locations on the map
In group quarters: 116 (-1 institutionalized population)
Size of family households: 546 2-persons, 264 3-persons, 195 4-persons, 75 5-persons, 12 6-persons, 13 7-or-more-persons
Size of nonfamily households: 381 1-person, 68 2-persons
545 married couples with children.
287 single-parent households (90 men, 197 women).
93.1% of residents of 21660 zip code speak English at home.
4.3% of residents speak Spanish at home (49% very well, 14% well, 37% not well).
0.7% of residents speak other Indo-European language at home (92% very well, 8% well).
0.9% of residents speak Asian or Pacific Island language at home (91% very well, 9% well).
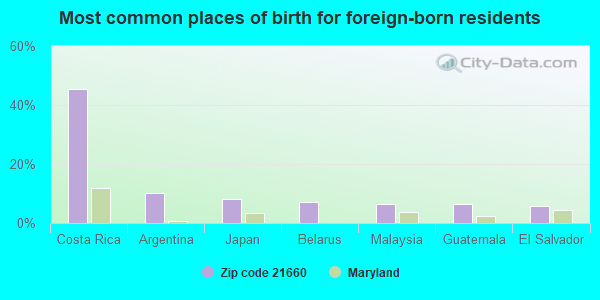
Foreign born population: 213 (5.2%) (33.1% of them are naturalized citizens)
This zip code:
5.2%
Whole state:
16.7%
46%Costa Rica
10%Argentina
8%Japan
7%Belarus
7%Malaysia
7%Guatemala
6%El Salvador
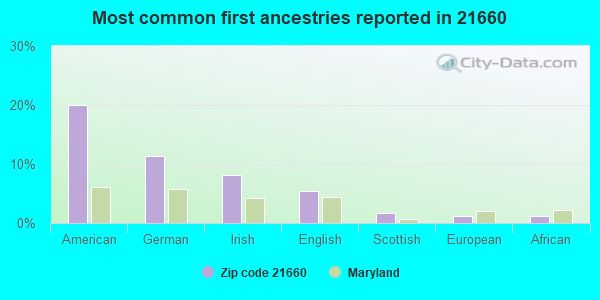
20%American
11%German
8%Irish
5%English
2%Scottish
1%European
1%African
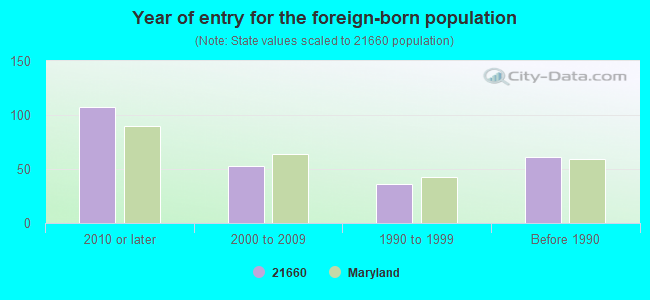
Year of entry for the foreign-born population
1072010 or later
532000 to 2009
361990 to 1999
61Before 1990
Facilities with environmental interests located in this zip code:
NORTH CAROLINE HIGH SCHOOL (10990 RIVER ROAD in RIDGELY, MD)
AIR MINOR (AIRS/AFS) (Geographic Names Information System) STATE MASTER (Maryland Permits tracking) - NPDES NON-MAJOR STATE MASTER (Maryland Air Emissions Database) - AIR MINOR (National Center for Education Statistics) - STATE ID-050703 National Pollutant Discharge Elimination System NON-MAJOR (Tracking pollutant discharge elimination systems) - permit Conditionally Exempt Small Quantity Generators, less than 100 kg/month of hazardous waste (Resource Conservation and Recovery Act (tracking hazardous waste)) - notification Business SIC classification: SEWERAGE SYSTEMS; ELEMENTARY AND SECONDARY SCHOOLS Organizations: CAROLINE COUNTY PUBLIC SCHOOLS (CONTACT/OWNER)
, CAROLINE COUNTY BOARD OF EDUCATION (SCHOOL DISTRICT)
Alternative names: CAROLINE CO BD OF ED-N CAROLIN, NORTH CAROLINE HIGH SCHOOL WWTP, NORTH CAROLINE HS WWTP
BENEDICTING SCHOOL (14299 BENEDICTINE LANE in RIDGELY, MD)
AIR MINOR (AIRS/AFS) STATE MASTER (Maryland Permits tracking) - NPDES NON-MAJOR COMPLIANCE ACTIVITY (Tracking inspections of insecticide, fungicide, and rodenticide, and toxic substances) National Pollutant Discharge Elimination System NON-MAJOR (Tracking pollutant discharge elimination systems) - permit COMMUNITY WATER SYSTEM (SDWIS) - SDWIS-MD0050201 1, WATER TREATMENT PLANT, SDWIS-MD0050201 2T, Business SIC classification: AMUSEMENT AND RECREATION SERVICES; ELEMENTARY AND SECONDARY SCHOOLS Alternative names: BENEDICTINE PROGRAMS- SERVICES, BENEDICTINE SCHOOL, BENEDICTINE SCHOOL WWTP, THE BENEDICTINE SCHOOL
BRIDGETOWN SAND / GRAVEL (MD ROUTE 312 AT CHERRY LANE in RIDGELY, MD)
STATE MASTER (Maryland Permits tracking) - National Pollutant Discharge Elimination System Permit National Pollutant Discharge Elimination System NON-MAJOR (Tracking pollutant discharge elimination systems) - permit Business SIC classification: CONSTRUCTION SAND AND GRAVEL Alternative names: DAVID A. BRAMBLE, INC. - BRIDGETOWN SAND & GRAVEL, LANE PIT
CARMEAN GRAIN (23501 HENRY ROAD in RIDGELY, MD)
AIR MINOR (AIRS/AFS) STATE MASTER (Maryland Air Emissions Database) - AIR MINOR Business SIC classification: CROP PREPARATION SERVICES FOR MARKET, EXCEPT COTTON GINNING
CAROLINE CAREER & TECHNOLOGY CENTER (10855 CENTRAL AVE in RIDGELY, MD)
(National Center for Education Statistics) - STATE ID-050704 Organizations: CAROLINE COUNTY BOARD OF EDUCATION (SCHOOL DISTRICT)
CAROLINE COUNTY HUMANE SOCIETY (407 WEST BELL STREET in RIDGELY, MD)
AIR MINOR (AIRS/AFS) Business SIC classification: MEMBERSHIP ORGANIZATIONS
REDLAND GENSTAR - MID-SHORE (421 W. BELLE ROAD in RIDGELY, MD)
AIR MINOR (AIRS/AFS) Business SIC classification: ASPHALT PAVING MIXTURES AND BLOCKS
LEONARD WH & SONS (120 MAIN STREET in SEWARD, MD)
AIR MINOR (AIRS/AFS) Business SIC classification: CANNED FRUITS, VEGETABLES, PRESERVES, JAMS, AND JELLIES Alternative names: LEONARD W.H. & SONS
BRAMBLE, DAVID A. - MID-SHORE (421 BELL STREET, WEST in RIDGELY, MD)
CRITERIA AND HAZARDOUS AIR POLLUTANT INVENTORY (Inventory of air pollution sources) Business SIC classification: ASPHALT PAVING MIXTURES AND BLOCKS Business NAICS classification: ASPHALT PAVING MIXTURE AND BLOCK MANUFACTURING.
Housing units lacking complete plumbing facilities: 1.5% Housing units lacking complete kitchen facilities: 1.6%
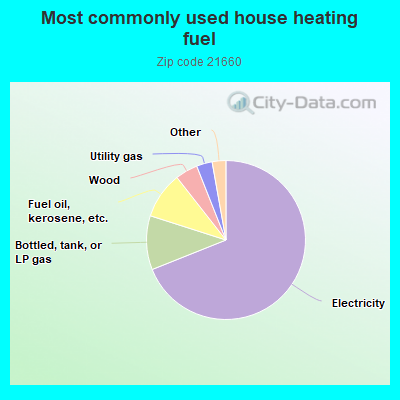
69.1%Electricity
11.0%Bottled, tank, or LP gas
9.5%Fuel oil, kerosene, etc.
4.6%Wood
3.2%Utility gas
1.0%Other fuel
0.7%Solar energy
0.6%Coal or coke
0.5%No fuel used
Population in 1990: 2,754. Population change in the 1990s: +743 (+27.0%).
Place of birth for U.S.-born residents:
This state: 2,891
Northeast: 251
Midwest: 78
South: 435
West: 181
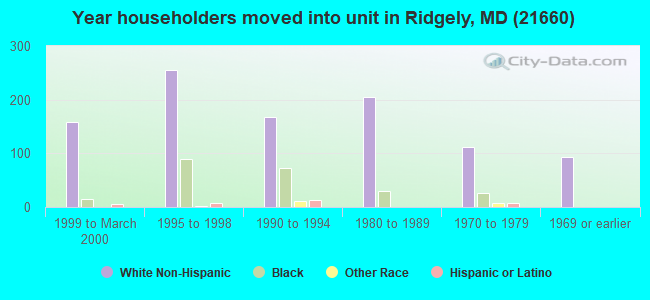
57% of the 21660 zip code residents lived in the same house 5 years ago. Out of people who lived in different houses, 45% lived in this county. Out of people who lived in different counties, 50% lived in Maryland.
92% of the 21660 zip code residents lived in the same house 1 year ago. Out of people who lived in different houses, 41% moved from this county. Out of people who lived in different houses, 43% moved from different county within same state. Out of people who lived in different houses, 16% moved from different state. Out of people who lived in different houses, 4% moved from abroad.
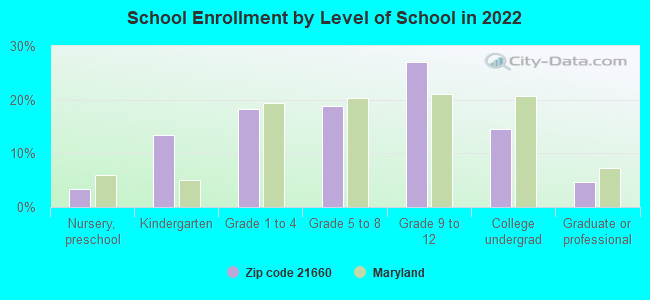
Private vs. public school enrollment:
Students in private schools in grades 1 to 8 (elementary and middle school): 33
Here:
9.5%
Maryland:
15.2%
Students in private schools in grades 9 to 12 (high school): 64
Here:
25.2%
Maryland:
14.4%
Students in private undergraduate colleges: 13
Here:
9.5%
Maryland:
20.2%
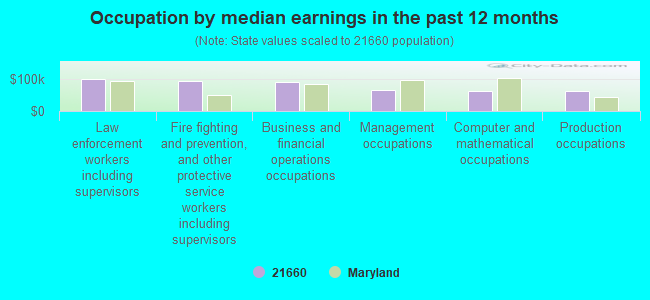
Occupation by median earnings in the past 12 months ($)
100,403Law enforcement workers including supervisors
94,006Fire fighting and prevention, and other protective service workers including supervisors
90,042Business and financial operations occupations
64,834Management occupations
64,258Computer and mathematical occupations
63,844Production occupations
Top industries in this zip code by the number of employees in 2005:
Educational Services: Elementary and Secondary Schools (250-499 employees: 1 establishment)
Health Care and Social Assistance: Services for the Elderly and Persons with Disabilities (50-99: 1)
Other Services (except Public Administration): Religious Organizations (10-19: 2, 5-9: 1)
Accommodation and Food Services: Full-Service Restaurants (20-49: 1, 1-4: 1)
Construction: Plumbing, Heating, and Air-Conditioning Contractors (10-19: 1, 1-4: 3)
Wholesale Trade: Other Construction Material Merchant Wholesalers (10-19: 1)
Other Services (except Public Administration): Environment, Conservation and Wildlife Organizations (10-19: 1)
Finance and Insurance: Commercial Banking (5-9: 2)
People in group quarters in 2010:
75 people in group homes for juveniles (non-correctional)
33 people in other noninstitutional facilities
11 people in workers' group living quarters and job corps centers
People in group quarters in 2000:
33 people in religious group quarters
9 people in agriculture workers' dormitories on farms
Fatal accident statistics in 2014:
Fatal accident count: 3
Vehicles involved in fatal accidents: 5
Fatal accidents caused by drunken drivers: 3
Fatalities: 3
Persons involved in fatal accidents: 6
Pedestrians involved in fatal accidents: 0
Fatal accident statistics in 2013:
Fatal accident count: 1
Vehicles involved in fatal accidents: 1
Fatal accidents caused by drunken drivers: 1
Fatalities: 1
Persons involved in fatal accidents: 1
Pedestrians involved in fatal accidents: 0
2002 - 2018 National Fire Incident Reporting System (NFIRS) incidents
According to the data from the years 2002 - 2018 the average number of fires per year is 45. The highest number of reported fire incidents - 62 took place in 2007, and the least - 24 in 2017. The data has a decreasing trend.
When looking into fire subcategories, the most incidents belonged to: Structure Fires (63.8%), and Outside Fires (25.7%).
Fire incident types reported to NFIRS in Zip Code 21660


 Nearest zip codes: 21641, 21657, 21639, 21636, 21629, 21640.


 According to the data from the years 2002 - 2018 the average number of fires per year is 45. The highest number of reported fire incidents - 62 took place in 2007, and the least - 24 in 2017. The data has a decreasing trend.
 When looking into fire subcategories, the most incidents belonged to: Structure Fires (63.8%), and Outside Fires (25.7%).