Estimated zip code population in 2022: 864 Zip code population in 2010: 1,029 Zip code population in 2000: 1,055
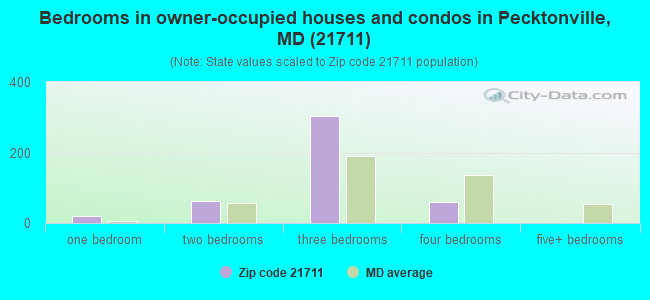
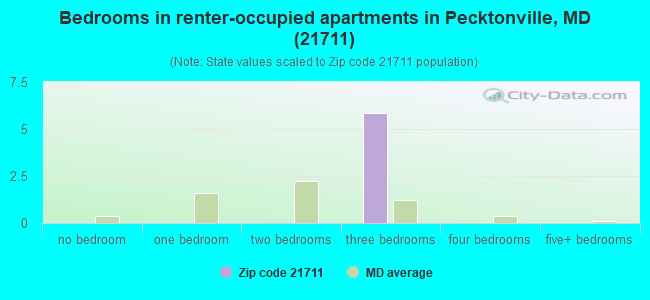
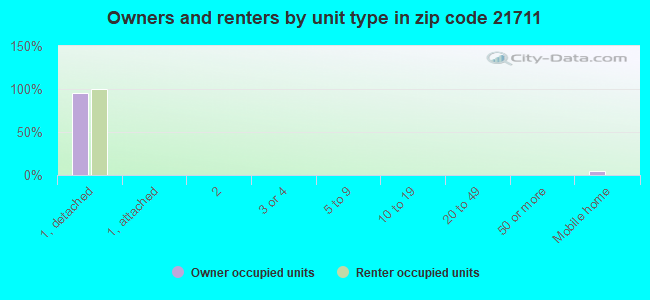
Houses and condos: 496 Renter-occupied apartments: 6
% of renters here:
1%
State:
32%
March 2022 cost of living index in zip code 21711: 129.6 (high, U.S. average is 100)
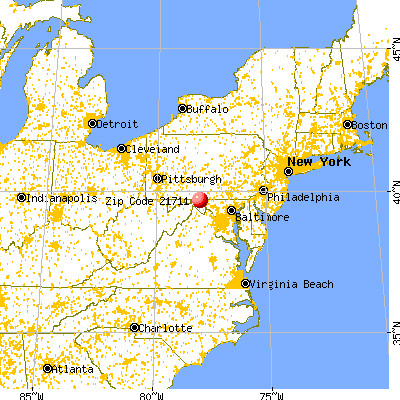
Land area: 23.9 sq. mi. Water area: 0.7 sq. mi.
Population density: 36 people per square mile
(very low).
OSM Map
General Map
Google Map
MSN Map
OSM Map
General Map
Google Map
MSN Map
OSM Map
General Map
Google Map
MSN Map
OSM Map
General Map
Google Map
MSN Map
Please wait while loading the map...
Real estate property taxes paid for housing units in 2022:
This zip code:
1.0% ($2,845)
Maryland:
0.9% ($3,777)
Median real estate property taxes paid for housing units with mortgages in 2022: $2,650 (0.9%) Median real estate property taxes paid for housing units with no mortgage in 2022: $3,031 (1.3%)
Business Search- 14 Million verified businesses
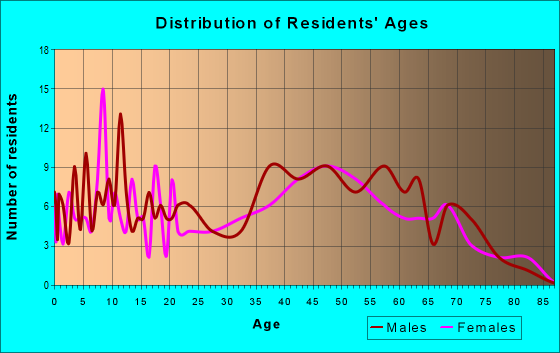
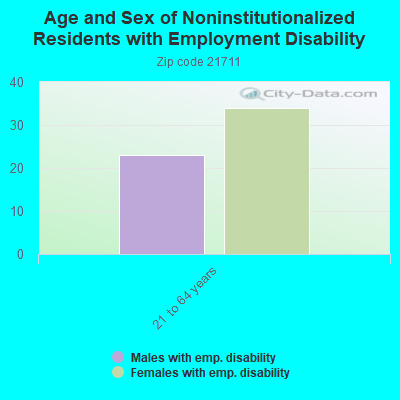
Males: 395
(45.7%)
Females: 469
(54.3%)
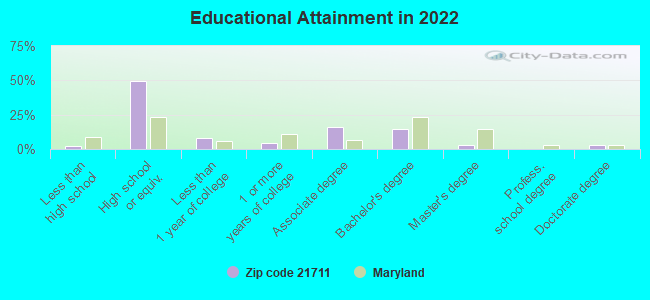
For population 25 years and over in 21711:
High school or higher: 97.3%
Bachelor's degree or higher: 20.1%
Graduate or professional degree: 5.8%
Unemployed: 4.1%
Mean travel time to work (commute): 30.5 minutes
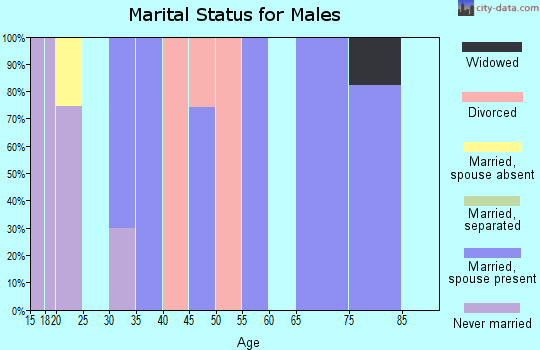
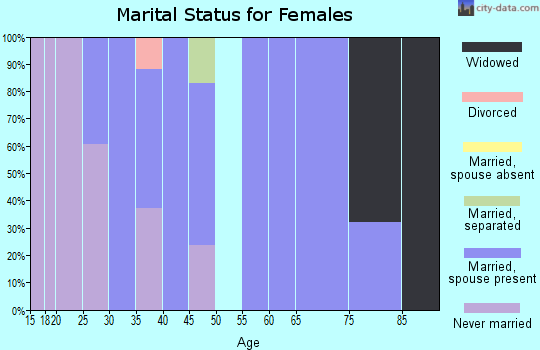
For population 15 years and over in 21711:
Never married: 13.7%
Now married: 67.7%
Separated: 9.2%
Widowed: 7.4%
Divorced: 2.0%
Zip code 21711 compared to state average:
Black race population percentage significantly below state average.
Hispanic race population percentage significantly below state average.
Median age significantly above state average.
Foreign-born population percentage significantly below state average.
Renting percentage significantly below state average.
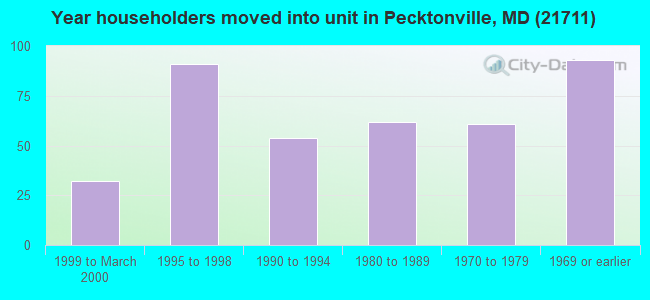
Length of stay since moving in significantly above state average.
Number of rooms per house above state average.
House age below state average.
Number of college students below state average.
Percentage of population with a bachelor's degree or higher below state average.
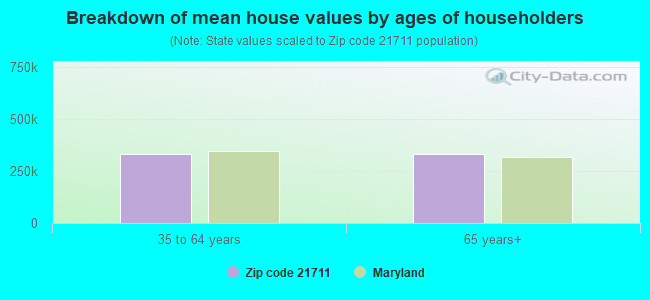
Estimated median house/condo value in 2022: $277,467
21711:
$277,467
Maryland:
$398,100
Median resident age:
This zip code:
53.4 years
Maryland median age:
39.7 years
Average household size:
This zip code:
1.9 people
Maryland:
2.5 people
Averages for the 2020 tax year for zip code 21711, filed in 2021:
Average Adjusted Gross Income (AGI) in 2020: $66,276 (Individual Income Tax Returns)
Here:
$66,276
State:
$86,905
Salary/wage: $56,968 (reported on 83.7% of returns)
Here:
$56,968
State:
$73,953
(% of AGI for various income ranges: 1138.2% for AGIs below $25k, 2860.0% for AGIs $25k-50k, 6898.3% for AGIs $50k-75k, 10012.5% for AGIs $75k-100k, 18501.7% for AGIs $100k-200k)
Taxable interest for individuals: $506 (reported on 34.7% of returns)
This zip code:
$506
Maryland:
$1,528
(% of AGI for various income ranges: 10.0% for AGIs below $25k, 34.0% for AGIs $25k-50k, 21.7% for AGIs $50k-75k, 5.0% for AGIs $75k-100k, 43.3% for AGIs $100k-200k)
Ordinary dividends: $1,050 (reported on 12.2% of returns)
Here:
$1,050
State:
$8,028
(% of AGI for various income ranges: 37.0% for AGIs $25k-50k, 43.3% for AGIs $100k-200k)
Net capital gain/loss in AGI: +$2,520 (reported on 10.2% of returns)
Here:
+$2,520
State:
+$25,238
(% of AGI for various income ranges: 28.0% for AGIs $25k-50k, 163.3% for AGIs $100k-200k)
Profit/loss from business: +$2,633 (reported on 12.2% of returns)
Here:
+$2,633
State:
+$11,398
(% of AGI for various income ranges: 106.4% for AGIs below $25k, 68.3% for AGIs $50k-75k)
Taxable individual retirement arrangement distribution: $10,850 (reported on 8.2% of returns)
21711:
$10,850
Maryland:
$20,944
(% of AGI for various income ranges: 434.0% for AGIs $25k-50k)
Total itemized deductions: $28,300 (reported on 6.1% of returns)
Here:
$28,300
State:
$30,672
(% of AGI for various income ranges: 2122.5% for AGIs $75k-100k)
Charity contributions: $9,400 (reported on 4.1% of returns)
Here:
$9,400
State:
$9,065
(% of AGI for various income ranges: 313.3% for AGIs $50k-75k)
Taxes paid: $8,800 (reported on 6.1% of returns)
21711:
$8,800
State:
$8,475
(% of AGI for various income ranges: 660.0% for AGIs $75k-100k)
Earned income credit: $1,829 (reported on 14.3% of returns)
Here:
$1,829
State:
$2,151
(% of AGI for various income ranges: 69.1% for AGIs below $25k, 52.0% for AGIs $25k-50k)
Percentage of individuals using paid preparers for their 2020 taxes: 98.0%
Here:
98%
State:
90%
(% for various income ranges: 93.8% for AGIs below $25k, 100.0% for AGIs $25k-50k, 100.0% for AGIs $50k-75k, 100.0% for AGIs $75k-100k, 100.0% for AGIs $100k-200k)
Averages for the 2012 tax year for zip code 21711, filed in 2013:
Average Adjusted Gross Income (AGI) in 2012: $50,870 (Individual Income Tax Returns)
Here:
$50,870
State:
$72,703
Salary/wage: $45,545 (reported on 87.0% of returns)
Here:
$45,545
State:
$62,228
(% of AGI for various income ranges: 77.6% for AGIs below $25k, 81.0% for AGIs $25k-50k, 80.3% for AGIs $50k-75k, 82.2% for AGIs $75k-100k, 71.4% for AGIs $100k-200k)
Taxable interest for individuals: $459 (reported on 37.0% of returns)
This zip code:
$459
Maryland:
$1,413
(% of AGI for various income ranges: 0.5% for AGIs below $25k, 0.9% for AGIs $25k-50k, 0.1% for AGIs $50k-75k, 0.2% for AGIs $75k-100k, 0.1% for AGIs $100k-200k)
Ordinary dividends: $1,457 (reported on 15.2% of returns)
Here:
$1,457
State:
$6,933
Net capital gain/loss in AGI: +$5,667 (reported on 6.5% of returns)
Here:
+$5,667
State:
+$14,830
Profit/loss from business: +$2,317 (reported on 13.0% of returns)
Here:
+$2,317
State:
+$12,606
Taxable individual retirement arrangement distribution: $5,200 (reported on 8.7% of returns)
21711:
$5,200
Maryland:
$17,065
Total itemized deductions: $20,269 (24% of AGI, reported on 34.8% of returns)
Here:
$20,269
State:
$27,886
Here:
23.7% of AGI
State:
22.8% of AGI
(% of AGI for various income ranges: 8.6% for AGIs $25k-50k, 12.8% for AGIs $50k-75k, 16.1% for AGIs $75k-100k, 20.0% for AGIs $100k-200k)
Charity contributions: $2,655 (reported on 23.9% of returns)
Here:
$2,655
State:
$4,452
(% of AGI for various income ranges: 1.1% for AGIs $50k-75k, 1.9% for AGIs $75k-100k, 2.0% for AGIs $100k-200k)
Taxes paid: $8,262 (reported on 34.8% of returns)
21711:
$8,262
State:
$11,690
(% of AGI for various income ranges: 2.5% for AGIs $25k-50k, 4.5% for AGIs $50k-75k, 6.9% for AGIs $75k-100k, 9.1% for AGIs $100k-200k)
Earned income credit: $2,129 (reported on 15.2% of returns)
Here:
$2,129
State:
$2,199
(% of AGI for various income ranges: 5.7% for AGIs below $25k, 1.1% for AGIs $25k-50k)
Percentage of individuals using paid preparers for their 2012 taxes: 58.7%
Here:
59%
State:
52%
(% for various income ranges: 50.0% for AGIs below $25k, 61.5% for AGIs $25k-50k, 66.7% for AGIs $50k-75k, 60.0% for AGIs $75k-100k, 60.0% for AGIs $100k-200k)
Averages for the 2004 tax year for zip code 21711, filed in 2005:
Average Adjusted Gross Income (AGI) in 2004: $41,169 (Individual Income Tax Returns)
Here:
$41,169
State:
$60,339
Salary/wage: $38,352 (reported on 89.4% of returns)
Here:
$38,352
State:
$52,211
(% of AGI for various income ranges: 91.3% for AGIs below $10k, 79.0% for AGIs $10k-25k, 83.2% for AGIs $25k-50k, 86.0% for AGIs $50k-75k, 86.2% for AGIs $75k-100k, 72.7% for AGIs over 100k)
Taxable interest for individuals: $585 (reported on 45.9% of returns)
This zip code:
$585
Maryland:
$1,701
(% of AGI for various income ranges: 1.2% for AGIs below $10k, 2.1% for AGIs $10k-25k, 0.4% for AGIs $25k-50k, 0.8% for AGIs $50k-75k, 0.2% for AGIs $75k-100k, 0.3% for AGIs over 100k)
Taxable dividends: $439 (reported on 14.6% of returns)
Here:
$439
State:
$4,235
(% of AGI for various income ranges: 0.8% for AGIs below $10k, 0.1% for AGIs $25k-50k, 0.2% for AGIs $50k-75k, 0.3% for AGIs $75k-100k)
Net capital gain/loss: +$8,239 (reported on 10.2% of returns)
Here:
+$8,239
State:
+$15,888
Profit/loss from business: +$5,724 (reported on 12.9% of returns)
Here:
+$5,724
State:
+$12,221
(% of AGI for various income ranges: 2.8% for AGIs $10k-25k, 4.1% for AGIs $25k-50k, 0.8% for AGIs $50k-75k, 1.1% for AGIs $75k-100k)
Total itemized deductions: $15,291 (24% of AGI, reported on 32.8% of returns)
Here:
$15,291
State:
$22,960
Here:
24.0% of AGI
State:
23.3% of AGI
(% of AGI for various income ranges: 7.9% for AGIs $10k-25k, 10.3% for AGIs $25k-50k, 12.4% for AGIs $50k-75k, 16.3% for AGIs $75k-100k, 12.5% for AGIs over 100k)
Charity contributions deductions: $2,017 (3% of AGI, reported on 26.8% of returns)
Here:
$2,017
State:
$4,031
Here:
3.1% of AGI
State:
3.9% of AGI
(% of AGI for various income ranges: 0.9% for AGIs $10k-25k, 0.8% for AGIs $25k-50k, 1.0% for AGIs $50k-75k, 2.1% for AGIs $75k-100k, 2.1% for AGIs over 100k)
Total tax: $4,225 (reported on 80.9% of returns)
21711:
$4,225
State:
$10,167
(% of AGI for various income ranges: 3.5% for AGIs below $10k, 4.3% for AGIs $10k-25k, 6.8% for AGIs $25k-50k, 8.1% for AGIs $50k-75k, 10.0% for AGIs $75k-100k, 12.7% for AGIs over 100k)
Earned income credit: $1,707 (reported on 9.1% of returns)
Here:
$1,707
State:
$1,700
Percentage of individuals using paid preparers for their 2004 taxes: 64.7%
Here:
65%
State:
55%
(% for various income ranges: 50.0% for AGIs below $10k, 67.9% for AGIs $10k-25k, 58.3% for AGIs $25k-50k, 78.0% for AGIs $50k-75k, 64.0% for AGIs $75k-100k, 75.0% for AGIs over 100k)
Household received Food Stamps/SNAP in the past 12 months: 20 Household did not receive Food Stamps/SNAP in the past 12 months: 427
Women who had a birth in the past 12 months: 3 (3 now married, 0 unmarried) Women who did not have a birth in the past 12 months: 100 (76 now married, 23 unmarried)
Housing units in zip code 21711 with a mortgage: 201 (3 second mortgage, 3 both second mortgage and home equity loan) Houses without a mortgage: 14
Median monthly owner costs for units with a mortgage: $1,530 Median monthly owner costs for units without a mortgage: $506
Residents with income below the poverty level in 2022:
This zip code:
11.3%
Whole state:
9.6%
Residents with income below 50% of the poverty level in 2022:
This zip code:
11.3%
Whole state:
4.7%
Median number of rooms in houses and condos:
Here:
8.2
State:
7.3
Notable locations in this zip code not listed on our city pages
Churches in zip code 21711 include: Parkhead United Methodist Church (A), Saint Paul United Methodist Church (B), Mooresville Church (C), Mount Carmel Evangelical Lutheran Church (D). Display/hide their locations on the map
Parks in zip code 21711 include: Fort Frederick State Park (1), Indian Springs Wildlife Demonstration Area (2), Indian Springs Wildlife Management Area (3). Display/hide their locations on the map
Size of family households: 220 2-persons, 35 3-persons, 23 4-persons, 20 5-persons, 4 7-or-more-persons
Size of nonfamily households: 150 1-person
90 married couples with children.
24 single-parent households (24 men).
99.3% of residents of 21711 zip code speak English at home.
Foreign born population: 0 (0.0%)
:
0.0%
Whole state:
16.7%
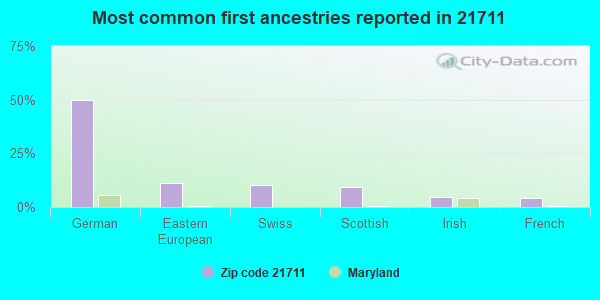
50%German
11%Eastern European
10%Swiss
9%Scottish
5%Irish
4%French
Facilities with environmental interests located in this zip code:
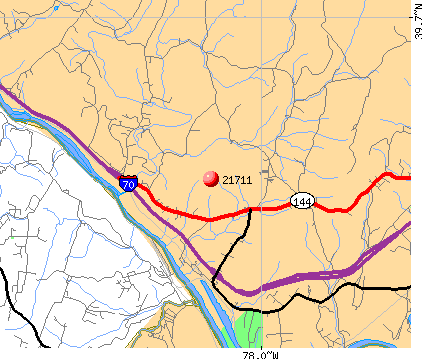
EXXON - I-70 & RT 56 - BIG POOL (I-70 & ROUTE 56 in BIG POOL, MD)
AIR MINOR (AIRS/AFS) STATE MASTER (Maryland Air Emissions Database) - AIR MINOR Business SIC classification: GASOLINE SERVICE STATIONS Alternative names: EXXON I-70 & RT 65 - HAGERSTOWN
EXXON RAS26147 (11079 BIG POOL RD AT I 70 in BIG POOL, MD)
STATE MASTER (Maryland Air Emissions Database) - AIR MINOR Conditionally Exempt Small Quantity Generators, less than 100 kg/month of hazardous waste (Resource Conservation and Recovery Act (tracking hazardous waste)) - notification Business SIC classification: GASOLINE SERVICE STATIONS Organizations: OPERNAME (CONTACT/OPERATOR)
, EXXONMOBIL CORP (CONTACT/OWNER)
Alternative names: EXXON - 11079 BIG POOL ROAD, EXXON ras 26147
MARYLAND STATE HIGHWAY ADMINISTRATION (RTE 40 @ I-70 in PARKHEAD, MD)
(Resource Conservation and Recovery Act (tracking hazardous waste)) Organizations: OPERNAME (CONTACT/OPERATOR)
, STATE OF MARYLAND (CONTACT/OWNER)
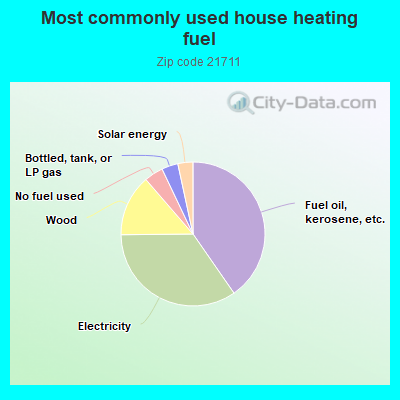
40.6%Fuel oil, kerosene, etc.
34.7%Electricity
13.9%Wood
4.3%No fuel used
3.7%Bottled, tank, or LP gas
3.4%Solar energy
Population in 1990: 1,083.
Place of birth for U.S.-born residents:
This state: 683
Northeast: 122
Midwest: 15
South: 36
71% of the 21711 zip code residents lived in the same house 5 years ago. Out of people who lived in different houses, 81% lived in this county. Out of people who lived in different counties, 50% lived in Maryland.
101% of the 21711 zip code residents lived in the same house 1 year ago.
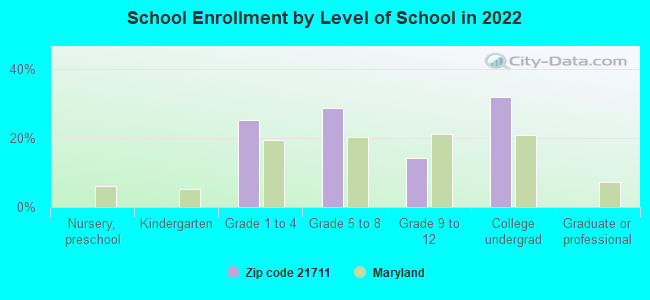
Private vs. public school enrollment:
Students in private schools in grades 1 to 8 (elementary and middle school): 38
Here:
76.4%
Maryland:
15.2%
Students in private schools in grades 9 to 12 (high school):
Here:
0.0%
Maryland:
14.4%
Students in private undergraduate colleges:
Here:
0.0%
Maryland:
20.2%
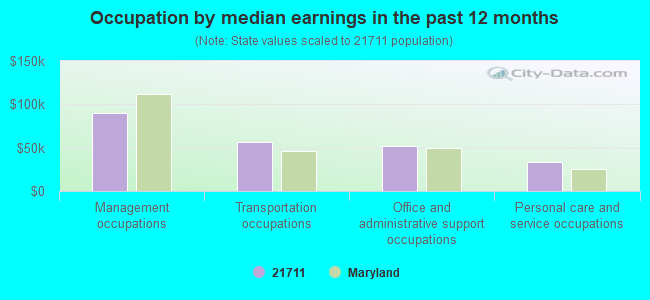
Occupation by median earnings in the past 12 months ($)
89,984Management occupations
56,917Transportation occupations
52,008Office and administrative support occupations
33,652Personal care and service occupations
Top industries in this zip code by the number of employees in 2005:
Accommodation and Food Services: Limited-Service Restaurants (50-99 employees: 1 establishment)
Accommodation and Food Services: Food Service Contractors (10-19: 1)
Administrative and Support and Waste Management and Remediation Services: Landscaping Services (5-9: 1, 1-4: 2)
Health Care and Social Assistance: Offices of Dentists (5-9: 1)
Construction: All Other Specialty Trade Contractors (1-4: 2)
Construction: Land Subdivision (1-4: 1)
Construction: Highway, Street, and Bridge Construction (1-4: 1)
Fatal accident statistics in 2014:
Fatal accident count: 1
Vehicles involved in fatal accidents: 1
Fatal accidents caused by drunken drivers: 1
Fatalities: 1
Persons involved in fatal accidents: 1
Pedestrians involved in fatal accidents: 0
Fatal accident statistics in 2013:
Fatal accident count: 2
Vehicles involved in fatal accidents: 4
Fatal accidents caused by drunken drivers: 0
Fatalities: 3
Persons involved in fatal accidents: 6
Pedestrians involved in fatal accidents: 0
Home Mortgage Disclosure Act Aggregated Statistics For Year 2009 (Based on 2 partial tracts)
A) FHA, FSA/RHS & VA Home Purchase Loans
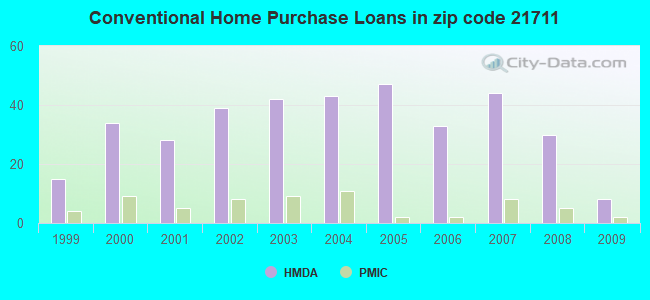
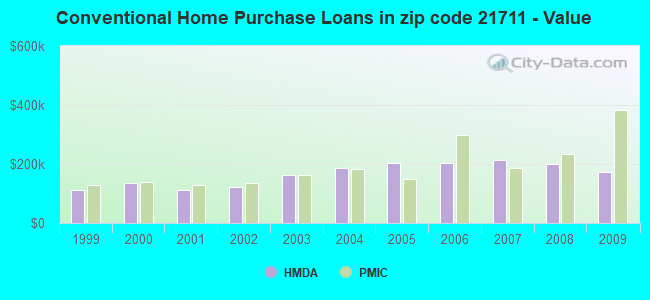
B) Conventional Home Purchase Loans
C) Refinancings
D) Home Improvement Loans
F) Non-occupant Loans on < 5 Family Dwellings (A B C & D)
G) Loans On Manufactured Home Dwelling (A B C & D)
Number
Average Value
Number
Average Value
Number
Average Value
Number
Average Value
Number
Average Value
Number
Average Value
LOANS ORIGINATED
12
$190,645
8
$172,812
113
$180,554
7
$109,200
6
$109,537
2
$148,265
APPLICATIONS APPROVED, NOT ACCEPTED
0
$0
0
$0
9
$194,643
0
$0
0
$0
0
$0
APPLICATIONS DENIED
2
$189,730
1
$71,980
40
$202,368
5
$41,154
1
$195,600
0
$0
APPLICATIONS WITHDRAWN
1
$131,440
2
$266,015
18
$206,814
1
$199,510
0
$0
1
$215,940
FILES CLOSED FOR INCOMPLETENESS
0
$0
0
$0
5
$206,084
0
$0
0
$0
0
$0
Aggregated Statistics For Year 2008 (Based on 2 partial tracts)
A) FHA, FSA/RHS & VA Home Purchase Loans
B) Conventional Home Purchase Loans
C) Refinancings
D) Home Improvement Loans
F) Non-occupant Loans on < 5 Family Dwellings (A B C & D)
G) Loans On Manufactured Home Dwelling (A B C & D)
Number
Average Value
Number
Average Value
Number
Average Value
Number
Average Value
Number
Average Value
Number
Average Value
LOANS ORIGINATED
4
$187,972
30
$201,468
74
$200,464
17
$64,065
5
$223,140
3
$148,657
APPLICATIONS APPROVED, NOT ACCEPTED
1
$281,660
3
$184,123
5
$141,928
3
$12,257
0
$0
2
$60,245
APPLICATIONS DENIED
0
$0
5
$140,832
59
$259,399
9
$78,936
5
$47,100
5
$89,506
APPLICATIONS WITHDRAWN
3
$193,513
2
$216,335
17
$214,562
2
$93,890
0
$0
0
$0
FILES CLOSED FOR INCOMPLETENESS
0
$0
0
$0
4
$159,805
1
$43,030
0
$0
1
$74,330
Aggregated Statistics For Year 2007 (Based on 2 partial tracts)
A) FHA, FSA/RHS & VA Home Purchase Loans
B) Conventional Home Purchase Loans
C) Refinancings
D) Home Improvement Loans
F) Non-occupant Loans on < 5 Family Dwellings (A B C & D)
G) Loans On Manufactured Home Dwelling (A B C & D)
Number
Average Value
Number
Average Value
Number
Average Value
Number
Average Value
Number
Average Value
Number
Average Value
LOANS ORIGINATED
2
$234,720
44
$212,137
98
$192,542
30
$93,288
12
$158,828
4
$60,832
APPLICATIONS APPROVED, NOT ACCEPTED
0
$0
5
$155,384
15
$203,789
4
$77,652
3
$197,163
2
$37,555
APPLICATIONS DENIED
1
$211,250
7
$237,514
77
$184,514
16
$46,552
2
$64,155
3
$134,050
APPLICATIONS WITHDRAWN
2
$213,985
2
$172,520
36
$212,269
2
$99,755
1
$117,360
0
$0
FILES CLOSED FOR INCOMPLETENESS
0
$0
1
$189,340
12
$191,949
1
$78,240
0
$0
0
$0
Aggregated Statistics For Year 2006 (Based on 2 partial tracts)
A) FHA, FSA/RHS & VA Home Purchase Loans
B) Conventional Home Purchase Loans
C) Refinancings
D) Home Improvement Loans
F) Non-occupant Loans on < 5 Family Dwellings (A B C & D)
G) Loans On Manufactured Home Dwelling (A B C & D)
Number
Average Value
Number
Average Value
Number
Average Value
Number
Average Value
Number
Average Value
Number
Average Value
LOANS ORIGINATED
3
$227,940
33
$204,396
122
$169,165
33
$88,719
5
$161,488
2
$70,805
APPLICATIONS APPROVED, NOT ACCEPTED
0
$0
5
$149,438
19
$164,510
4
$14,475
1
$175,260
0
$0
APPLICATIONS DENIED
1
$35,210
8
$191,199
68
$177,789
20
$89,546
3
$225,070
6
$82,543
APPLICATIONS WITHDRAWN
0
$0
4
$168,608
80
$164,705
7
$110,319
2
$97,410
2
$75,895
FILES CLOSED FOR INCOMPLETENESS
0
$0
0
$0
16
$186,994
0
$0
2
$176,040
0
$0
Aggregated Statistics For Year 2005 (Based on 2 partial tracts)
A) FHA, FSA/RHS & VA Home Purchase Loans
B) Conventional Home Purchase Loans
C) Refinancings
D) Home Improvement Loans
F) Non-occupant Loans on < 5 Family Dwellings (A B C & D)
G) Loans On Manufactured Home Dwelling (A B C & D)
Number
Average Value
Number
Average Value
Number
Average Value
Number
Average Value
Number
Average Value
Number
Average Value
LOANS ORIGINATED
5
$220,794
47
$202,142
128
$166,621
34
$67,010
5
$170,564
5
$119,550
APPLICATIONS APPROVED, NOT ACCEPTED
0
$0
5
$217,976
18
$140,354
4
$125,770
1
$111,100
1
$67,290
APPLICATIONS DENIED
0
$0
10
$195,131
56
$153,546
15
$77,979
1
$143,960
2
$113,450
APPLICATIONS WITHDRAWN
0
$0
9
$173,693
82
$154,543
4
$117,750
2
$38,340
1
$146,310
FILES CLOSED FOR INCOMPLETENESS
0
$0
0
$0
16
$184,989
2
$75,500
1
$103,280
0
$0
Aggregated Statistics For Year 2004 (Based on 2 partial tracts)
A) FHA, FSA/RHS & VA Home Purchase Loans
B) Conventional Home Purchase Loans
C) Refinancings
D) Home Improvement Loans
F) Non-occupant Loans on < 5 Family Dwellings (A B C & D)
G) Loans On Manufactured Home Dwelling (A B C & D)
Number
Average Value
Number
Average Value
Number
Average Value
Number
Average Value
Number
Average Value
Number
Average Value
LOANS ORIGINATED
5
$165,868
43
$187,157
137
$132,111
23
$58,918
4
$83,325
8
$85,281
APPLICATIONS APPROVED, NOT ACCEPTED
0
$0
9
$129,791
32
$147,360
5
$70,416
2
$76,675
1
$34,430
APPLICATIONS DENIED
2
$101,710
9
$117,447
59
$117,174
11
$70,701
0
$0
5
$61,654
APPLICATIONS WITHDRAWN
0
$0
9
$155,698
91
$140,987
6
$99,103
0
$0
1
$124,400
FILES CLOSED FOR INCOMPLETENESS
0
$0
2
$364,990
9
$125,184
1
$62,590
0
$0
0
$0
Aggregated Statistics For Year 2003 (Based on 2 partial tracts)
A) FHA, FSA/RHS & VA Home Purchase Loans
B) Conventional Home Purchase Loans
C) Refinancings
D) Home Improvement Loans
F) Non-occupant Loans on < 5 Family Dwellings (A B C & D)
Number
Average Value
Number
Average Value
Number
Average Value
Number
Average Value
Number
Average Value
LOANS ORIGINATED
13
$144,865
42
$163,950
221
$119,035
13
$19,500
5
$191,532
APPLICATIONS APPROVED, NOT ACCEPTED
2
$121,665
5
$136,450
23
$129,572
2
$26,995
0
$0
APPLICATIONS DENIED
1
$70,420
8
$123,032
72
$114,708
5
$30,358
2
$142,790
APPLICATIONS WITHDRAWN
1
$81,370
3
$117,100
84
$126,106
1
$40,680
0
$0
FILES CLOSED FOR INCOMPLETENESS
0
$0
0
$0
5
$94,358
1
$2,350
0
$0
Aggregated Statistics For Year 2002 (Based on 2 partial tracts)
A) FHA, FSA/RHS & VA Home Purchase Loans
B) Conventional Home Purchase Loans
C) Refinancings
D) Home Improvement Loans
F) Non-occupant Loans on < 5 Family Dwellings (A B C & D)
Number
Average Value
Number
Average Value
Number
Average Value
Number
Average Value
Number
Average Value
LOANS ORIGINATED
9
$110,840
39
$122,095
148
$106,613
11
$22,832
9
$96,843
APPLICATIONS APPROVED, NOT ACCEPTED
0
$0
4
$131,640
19
$103,853
5
$22,064
2
$39,900
APPLICATIONS DENIED
0
$0
5
$83,404
55
$94,386
5
$36,304
3
$77,197
APPLICATIONS WITHDRAWN
0
$0
7
$146,086
54
$112,753
2
$93,890
2
$106,015
FILES CLOSED FOR INCOMPLETENESS
0
$0
1
$101,710
6
$133,530
0
$0
0
$0
Aggregated Statistics For Year 2001 (Based on 2 partial tracts)
A) FHA, FSA/RHS & VA Home Purchase Loans
B) Conventional Home Purchase Loans
C) Refinancings
D) Home Improvement Loans
F) Non-occupant Loans on < 5 Family Dwellings (A B C & D)
Number
Average Value
Number
Average Value
Number
Average Value
Number
Average Value
Number
Average Value
LOANS ORIGINATED
9
$120,838
28
$110,877
108
$94,540
19
$10,295
5
$122,368
APPLICATIONS APPROVED, NOT ACCEPTED
2
$99,365
4
$107,385
12
$76,936
2
$46,945
2
$121,270
APPLICATIONS DENIED
2
$84,500
6
$108,623
53
$78,565
5
$14,866
2
$47,335
APPLICATIONS WITHDRAWN
0
$0
3
$40,947
38
$88,864
1
$11,740
0
$0
FILES CLOSED FOR INCOMPLETENESS
1
$87,630
0
$0
5
$115,482
0
$0
0
$0
Aggregated Statistics For Year 2000 (Based on 2 partial tracts)
A) FHA, FSA/RHS & VA Home Purchase Loans
B) Conventional Home Purchase Loans
C) Refinancings
D) Home Improvement Loans
F) Non-occupant Loans on < 5 Family Dwellings (A B C & D)
Number
Average Value
Number
Average Value
Number
Average Value
Number
Average Value
Number
Average Value
LOANS ORIGINATED
13
$93,527
34
$134,711
57
$78,981
18
$24,472
0
$0
APPLICATIONS APPROVED, NOT ACCEPTED
3
$116,840
2
$35,210
20
$78,358
3
$33,120
0
$0
APPLICATIONS DENIED
0
$0
8
$51,345
51
$65,154
17
$17,075
2
$107,190
APPLICATIONS WITHDRAWN
0
$0
2
$79,020
26
$62,562
2
$52,810
2
$14,475
FILES CLOSED FOR INCOMPLETENESS
1
$103,280
1
$27,380
6
$95,843
0
$0
0
$0
Aggregated Statistics For Year 1999 (Based on 1 partial tract)
A) FHA, FSA/RHS & VA Home Purchase Loans
B) Conventional Home Purchase Loans
C) Refinancings
D) Home Improvement Loans
F) Non-occupant Loans on < 5 Family Dwellings (A B C & D)
Detailed PMIC statistics for the following Tracts:0106.00
2002 - 2018 National Fire Incident Reporting System (NFIRS) incidents
Based on the data from the years 2002 - 2018 the average number of fire incidents per year is 7. The highest number of reported fires - 14 took place in 2013, and the least - 1 in 2003. The data has a growing trend.
When looking into fire subcategories, the most incidents belonged to: Outside Fires (37.3%), and Structure Fires (36.4%).
Fire incident types reported to NFIRS in Zip Code 21711


 Nearest zip codes: 21722, 17236, 17212, 25419, 25427, 25403.
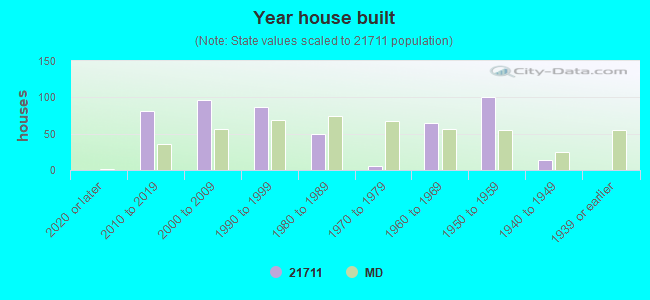


 Based on the data from the years 2002 - 2018 the average number of fire incidents per year is 7. The highest number of reported fires - 14 took place in 2013, and the least - 1 in 2003. The data has a growing trend.
 When looking into fire subcategories, the most incidents belonged to: Outside Fires (37.3%), and Structure Fires (36.4%).