Estimated zip code population in 2022: 28,276 Zip code population in 2010: 22,543 Zip code population in 2000: 16,389
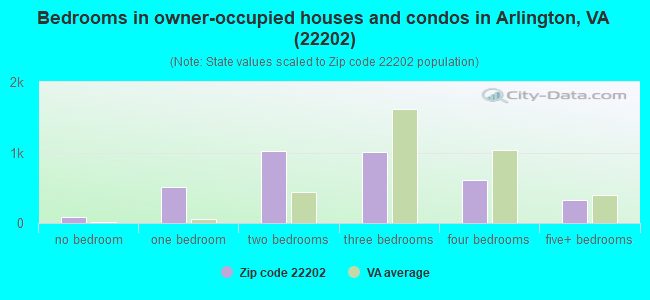
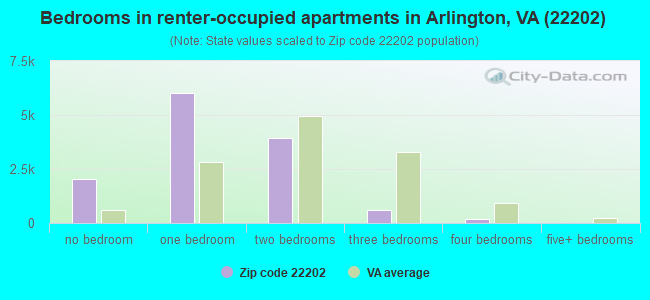
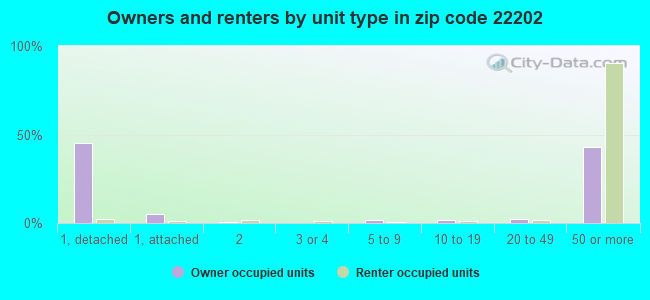
Houses and condos: 18,197 Renter-occupied apartments: 12,505
% of renters here:
78%
State:
33%
March 2022 cost of living index in zip code 22202: 169.4 (very high, U.S. average is 100)
Land area: 3.9 sq. mi. Water area: 0.1 sq. mi.
Population density: 7,306 people per square mile
(high).
OSM Map
General Map
Google Map
MSN Map
OSM Map
General Map
Google Map
MSN Map
OSM Map
General Map
Google Map
MSN Map
OSM Map
General Map
Google Map
MSN Map
Please wait while loading the map...
Real estate property taxes paid for housing units in 2022:
This zip code:
0.8% ($7,182)
Virginia:
0.7% ($2,617)
Median real estate property taxes paid for housing units with mortgages in 2022: $6,987 (0.8%) Median real estate property taxes paid for housing units with no mortgage in 2022: $7,734 (0.9%)
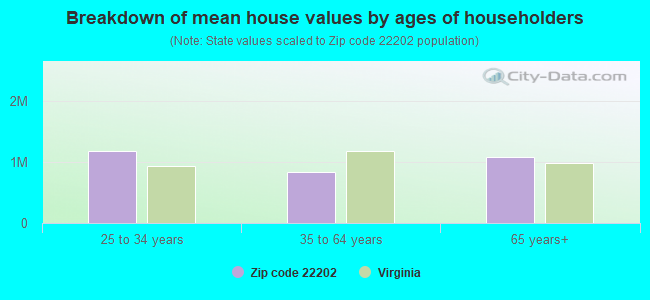
Estimated median house/condo value in 2022: $846,340
22202:
$846,340
Virginia:
$365,700
According to our research of Virginia and other state lists, there were 5 registered sex offenders living in 22202 zip code as of April 17, 2024. The ratio of all residents to sex offenders in zip code 22202 is 4,743 to 1. The ratio of registered sex offenders to all residents in this zip code is much lower than the state average.
Median resident age:
This zip code:
35.7 years
Virginia median age:
39.0 years
Average household size:
This zip code:
1.7 people
Virginia:
2.5 people
Averages for the 2020 tax year for zip code 22202, filed in 2021:
Average Adjusted Gross Income (AGI) in 2020: $114,536 (Individual Income Tax Returns)
Here:
$114,536
State:
$86,446
Salary/wage: $99,827 (reported on 88.7% of returns)
Here:
$99,827
State:
$71,185
(% of AGI for various income ranges: 1261.3% for AGIs below $25k, 4192.2% for AGIs $25k-50k, 7414.5% for AGIs $50k-75k, 11087.8% for AGIs $75k-100k, 19674.1% for AGIs $100k-200k, 71826.4% for AGIs over 200k)
Taxable interest for individuals: $1,499 (reported on 42.2% of returns)
This zip code:
$1,499
Virginia:
$1,805
(% of AGI for various income ranges: 18.3% for AGIs below $25k, 21.2% for AGIs $25k-50k, 27.5% for AGIs $50k-75k, 51.2% for AGIs $75k-100k, 130.3% for AGIs $100k-200k, 719.5% for AGIs over 200k)
Ordinary dividends: $6,182 (reported on 35.1% of returns)
Here:
$6,182
State:
$8,327
(% of AGI for various income ranges: 49.1% for AGIs below $25k, 38.6% for AGIs $25k-50k, 66.1% for AGIs $50k-75k, 116.6% for AGIs $75k-100k, 359.1% for AGIs $100k-200k, 3186.4% for AGIs over 200k)
Net capital gain/loss in AGI: +$16,644 (reported on 33.1% of returns)
Here:
+$16,644
State:
+$24,644
(% of AGI for various income ranges: 21.6% for AGIs below $25k, 55.9% for AGIs $25k-50k, 65.6% for AGIs $50k-75k, 166.0% for AGIs $75k-100k, 386.6% for AGIs $100k-200k, 11249.5% for AGIs over 200k)
Profit/loss from business: +$18,014 (reported on 14.5% of returns)
Here:
+$18,014
State:
+$12,836
(% of AGI for various income ranges: 149.8% for AGIs below $25k, 151.3% for AGIs $25k-50k, 95.7% for AGIs $50k-75k, 176.8% for AGIs $75k-100k, 323.5% for AGIs $100k-200k, 3624.6% for AGIs over 200k)
Taxable individual retirement arrangement distribution: $22,793 (reported on 6.0% of returns)
22202:
$22,793
Virginia:
$21,535
(% of AGI for various income ranges: 35.6% for AGIs below $25k, 27.5% for AGIs $25k-50k, 56.8% for AGIs $50k-75k, 100.8% for AGIs $75k-100k, 304.1% for AGIs $100k-200k, 1541.5% for AGIs over 200k)
Self-employed (Keogh) retirement plans: $30,639 (reported on 1.2% of returns)
22202:
$30,639
Virginia:
$31,172
(% of AGI for various income ranges: 17.6% for AGIs $25k-50k, 30.5% for AGIs $100k-200k, 732.5% for AGIs over 200k)
Total itemized deductions: $32,048 (reported on 16.3% of returns)
Here:
$32,048
State:
$33,287
(% of AGI for various income ranges: 65.3% for AGIs below $25k, 93.3% for AGIs $25k-50k, 186.3% for AGIs $50k-75k, 404.4% for AGIs $75k-100k, 1150.1% for AGIs $100k-200k, 6268.5% for AGIs over 200k)
Charity contributions: $9,443 (reported on 13.8% of returns)
Here:
$9,443
State:
$10,381
(% of AGI for various income ranges: 4.9% for AGIs below $25k, 15.4% for AGIs $25k-50k, 33.5% for AGIs $50k-75k, 73.7% for AGIs $75k-100k, 261.8% for AGIs $100k-200k, 1822.3% for AGIs over 200k)
Taxes paid: $9,243 (reported on 16.2% of returns)
22202:
$9,243
State:
$8,284
(% of AGI for various income ranges: 13.3% for AGIs below $25k, 20.6% for AGIs $25k-50k, 50.3% for AGIs $50k-75k, 116.6% for AGIs $75k-100k, 377.9% for AGIs $100k-200k, 1652.1% for AGIs over 200k)
Earned income credit: $1,093 (reported on 3.6% of returns)
Here:
$1,093
State:
$2,214
(% of AGI for various income ranges: 28.4% for AGIs below $25k, 11.1% for AGIs $25k-50k)
Percentage of individuals using paid preparers for their 2020 taxes: 92.8%
Here:
93%
State:
92%
(% for various income ranges: 90.3% for AGIs below $25k, 93.5% for AGIs $25k-50k, 94.3% for AGIs $50k-75k, 93.6% for AGIs $75k-100k, 92.7% for AGIs $100k-200k, 91.9% for AGIs over 200k)
Averages for the 2012 tax year for zip code 22202, filed in 2013:
Average Adjusted Gross Income (AGI) in 2012: $99,866 (Individual Income Tax Returns)
Here:
$99,866
State:
$71,192
Salary/wage: $88,232 (reported on 89.4% of returns)
Here:
$88,232
State:
$59,229
(% of AGI for various income ranges: 85.7% for AGIs below $25k, 90.8% for AGIs $25k-50k, 90.9% for AGIs $50k-75k, 89.2% for AGIs $75k-100k, 83.0% for AGIs $100k-200k, 63.6% for AGIs over 200k)
Taxable interest for individuals: $1,776 (reported on 49.5% of returns)
This zip code:
$1,776
Virginia:
$1,600
(% of AGI for various income ranges: 1.5% for AGIs below $25k, 0.5% for AGIs $25k-50k, 0.5% for AGIs $50k-75k, 0.5% for AGIs $75k-100k, 0.7% for AGIs $100k-200k, 1.5% for AGIs over 200k)
Ordinary dividends: $6,269 (reported on 33.5% of returns)
Here:
$6,269
State:
$6,959
(% of AGI for various income ranges: 2.8% for AGIs below $25k, 1.0% for AGIs $25k-50k, 1.0% for AGIs $50k-75k, 1.2% for AGIs $75k-100k, 1.8% for AGIs $100k-200k, 3.4% for AGIs over 200k)
Net capital gain/loss in AGI: +$10,146 (reported on 27.1% of returns)
Here:
+$10,146
State:
+$16,672
(% of AGI for various income ranges: 0.7% for AGIs below $25k, 0.3% for AGIs $50k-75k, 0.4% for AGIs $75k-100k, 1.0% for AGIs $100k-200k, 7.0% for AGIs over 200k)
Profit/loss from business: +$21,412 (reported on 12.4% of returns)
Here:
+$21,412
State:
+$14,116
(% of AGI for various income ranges: 9.7% for AGIs below $25k, 3.0% for AGIs $25k-50k, 1.4% for AGIs $50k-75k, 1.1% for AGIs $75k-100k, 2.0% for AGIs $100k-200k, 3.9% for AGIs over 200k)
Taxable individual retirement arrangement distribution: $17,825 (reported on 7.7% of returns)
22202:
$17,825
Virginia:
$16,667
(% of AGI for various income ranges: 2.3% for AGIs below $25k, 0.9% for AGIs $25k-50k, 0.9% for AGIs $50k-75k, 1.0% for AGIs $75k-100k, 1.3% for AGIs $100k-200k, 1.8% for AGIs over 200k)
Self-employment retirement plans: $25,795 (reported on 1.4% of returns)
22202:
$25,795
Virginia:
$25,373
(% of AGI for various income ranges: 0.2% for AGIs $25k-50k, 0.2% for AGIs $100k-200k, 0.9% for AGIs over 200k)
Total itemized deductions: $27,112 (17% of AGI, reported on 41.4% of returns)
Here:
$27,112
State:
$26,596
Here:
16.8% of AGI
State:
20.1% of AGI
(% of AGI for various income ranges: 13.0% for AGIs below $25k, 6.0% for AGIs $25k-50k, 6.4% for AGIs $50k-75k, 8.2% for AGIs $75k-100k, 12.4% for AGIs $100k-200k, 14.0% for AGIs over 200k)
Charity contributions: $4,202 (reported on 33.8% of returns)
Here:
$4,202
State:
$4,443
(% of AGI for various income ranges: 0.8% for AGIs below $25k, 0.8% for AGIs $25k-50k, 1.0% for AGIs $50k-75k, 1.1% for AGIs $75k-100k, 1.6% for AGIs $100k-200k, 1.7% for AGIs over 200k)
Taxes paid: $12,006 (reported on 41.2% of returns)
22202:
$12,006
State:
$9,951
(% of AGI for various income ranges: 2.3% for AGIs below $25k, 1.4% for AGIs $25k-50k, 2.0% for AGIs $50k-75k, 3.2% for AGIs $75k-100k, 5.7% for AGIs $100k-200k, 6.8% for AGIs over 200k)
Earned income credit: $1,105 (reported on 2.8% of returns)
Here:
$1,105
State:
$2,211
(% of AGI for various income ranges: 1.4% for AGIs below $25k)
Percentage of individuals using paid preparers for their 2012 taxes: 36.0%
Here:
36%
State:
46%
(% for various income ranges: 34.4% for AGIs below $25k, 31.9% for AGIs $25k-50k, 29.4% for AGIs $50k-75k, 32.6% for AGIs $75k-100k, 40.6% for AGIs $100k-200k, 54.2% for AGIs over 200k)
Averages for the 2004 tax year for zip code 22202, filed in 2005:
Average Adjusted Gross Income (AGI) in 2004: $83,753 (Individual Income Tax Returns)
Here:
$83,753
State:
$56,704
Salary/wage: $67,185 (reported on 86.9% of returns)
Here:
$67,185
State:
$48,441
(% of AGI for various income ranges: 186.0% for AGIs below $10k, 84.2% for AGIs $10k-25k, 89.0% for AGIs $25k-50k, 84.5% for AGIs $50k-75k, 83.8% for AGIs $75k-100k, 58.2% for AGIs over 100k)
Taxable interest for individuals: $1,816 (reported on 58.0% of returns)
This zip code:
$1,816
Virginia:
$1,688
(% of AGI for various income ranges: 9.6% for AGIs below $10k, 2.0% for AGIs $10k-25k, 1.1% for AGIs $25k-50k, 1.2% for AGIs $50k-75k, 1.4% for AGIs $75k-100k, 1.2% for AGIs over 100k)
Taxable dividends: $4,369 (reported on 37.8% of returns)
Here:
$4,369
State:
$4,028
(% of AGI for various income ranges: 9.9% for AGIs below $10k, 1.9% for AGIs $10k-25k, 1.0% for AGIs $25k-50k, 1.5% for AGIs $50k-75k, 1.8% for AGIs $75k-100k, 2.3% for AGIs over 100k)
Net capital gain/loss: +$12,113 (reported on 31.5% of returns)
Here:
+$12,113
State:
+$14,375
(% of AGI for various income ranges: -5.9% for AGIs below $10k, -0.1% for AGIs $10k-25k, 0.3% for AGIs $25k-50k, 0.0% for AGIs $50k-75k, 0.8% for AGIs $75k-100k, 7.5% for AGIs over 100k)
Profit/loss from business: +$19,611 (reported on 12.0% of returns)
Here:
+$19,611
State:
+$13,342
(% of AGI for various income ranges: 0.8% for AGIs below $10k, 5.0% for AGIs $10k-25k, 2.0% for AGIs $25k-50k, 2.2% for AGIs $50k-75k, 1.3% for AGIs $75k-100k, 3.3% for AGIs over 100k)
IRA payment deduction: $2,905 (reported on 2.6% of returns)
22202:
$2,905
Virginia:
$2,943
(% of AGI for various income ranges: 0.3% for AGIs $10k-25k, 0.2% for AGIs $25k-50k, 0.1% for AGIs $50k-75k, 0.1% for AGIs $75k-100k, 0.1% for AGIs over 100k)
Self-employed pension: $15,957 (reported on 1.9% of returns)
Here:
$15,957
Virginia:
$17,430
(% of AGI for various income ranges: 0.1% for AGIs $25k-50k, 0.1% for AGIs $50k-75k, 0.2% for AGIs $75k-100k, 0.5% for AGIs over 100k)
Total itemized deductions: $26,956 (18% of AGI, reported on 38.6% of returns)
Here:
$26,956
State:
$21,492
Here:
18.2% of AGI
State:
21.0% of AGI
(% of AGI for various income ranges: 21.2% for AGIs below $10k, 9.5% for AGIs $10k-25k, 6.2% for AGIs $25k-50k, 9.0% for AGIs $50k-75k, 10.7% for AGIs $75k-100k, 15.0% for AGIs over 100k)
Charity contributions deductions: $4,020 (3% of AGI, reported on 34.0% of returns)
Here:
$4,020
State:
$3,794
Here:
3.0% of AGI
State:
3.5% of AGI
(% of AGI for various income ranges: 0.9% for AGIs below $10k, 0.7% for AGIs $10k-25k, 0.9% for AGIs $25k-50k, 1.5% for AGIs $50k-75k, 1.8% for AGIs $75k-100k, 1.8% for AGIs over 100k)
Total tax: $14,727 (reported on 91.4% of returns)
22202:
$14,727
State:
$9,537
(% of AGI for various income ranges: 5.7% for AGIs below $10k, 5.6% for AGIs $10k-25k, 10.5% for AGIs $25k-50k, 14.0% for AGIs $50k-75k, 15.3% for AGIs $75k-100k, 18.3% for AGIs over 100k)
Earned income credit: $777 (reported on 2.6% of returns)
Here:
$777
State:
$1,734
Percentage of individuals using paid preparers for their 2004 taxes: 37.4%
Here:
37%
State:
52%
(% for various income ranges: 32.5% for AGIs below $10k, 41.4% for AGIs $10k-25k, 34.0% for AGIs $25k-50k, 34.7% for AGIs $50k-75k, 35.5% for AGIs $75k-100k, 44.7% for AGIs over 100k)
Likely homosexual households (counted as self-reported same-sex unmarried-partner households)
Lesbian couples: 0.1% of all households
Gay men: 0.6% of all households
Household received Food Stamps/SNAP in the past 12 months: 209 Household did not receive Food Stamps/SNAP in the past 12 months: 15,801
Women who had a birth in the past 12 months: 209 (187 now married, 25 unmarried) Women who did not have a birth in the past 12 months: 9,473 (2,995 now married, 6,521 unmarried)
Housing units in zip code 22202 with a mortgage: 2,318 (215 second mortgage, 208 both second mortgage and home equity loan) Median monthly owner costs for units with a mortgage: $3,516 Median monthly owner costs for units without a mortgage: $1,189
Residents with income below the poverty level in 2022:
This zip code:
8.7%
Whole state:
10.6%
Residents with income below 50% of the poverty level in 2022:
This zip code:
3.5%
Whole state:
5.2%
Median number of rooms in houses and condos:
Here:
5.6
State:
7.0
Median number of rooms in apartments:
Here:
3.0
State:
4.3
Notable locations in this zip code not listed on our city pages
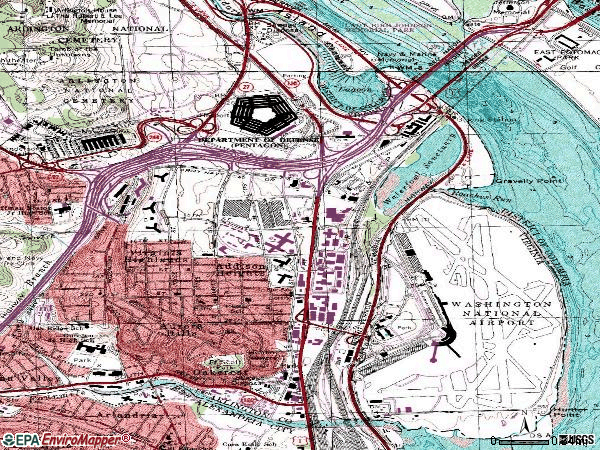
Notable locations in zip code 22202: Fashion Centre at Pentagon City (A), National 9/11 Pentagon Memorial (B), Arlington County Water Pollution Control Facility (C), Pentagon City Metro Station (D), Pentagon Metro Station (E), Reagan Washington National Airport Metro Station (F), Crystal City Metro Station (G), Hume Museum (H), Arlington County Fire Department Station 5 (I), Aurora Hills Community Center (J), Gunston Community Center (K), Arlington Historical Museum (L), Pentagon (M), Metropolitan Washington Airport Authority Fire and Rescue Department Station 301 (N), United States Drug Enforcement Administration Museum and Visitors Center (O), Aurora Hills Library (P). Display/hide their locations on the map
Churches in zip code 22202 include: Advent Lutheran Church (A), Calvary Methodist Church (B), Mount Vernon Baptist Church (C), Our Lady of Lourdes Catholic Church (D). Display/hide their locations on the map
2,262 married couples with children.
437 single-parent households (167 men, 270 women).
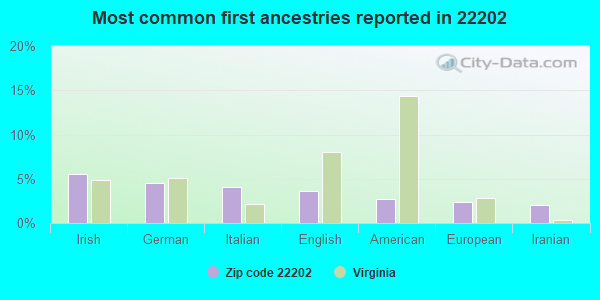
66.8% of residents of 22202 zip code speak English at home.
9.9% of residents speak Spanish at home (77% very well, 11% well, 9% not well, 3% not at all).
8.0% of residents speak other Indo-European language at home (79% very well, 18% well, 2% not well, 1% not at all).
8.9% of residents speak Asian or Pacific Island language at home (56% very well, 36% well, 6% not well, 3% not at all).
6.9% of residents speak other language at home (68% very well, 25% well, 6% not well, 1% not at all).
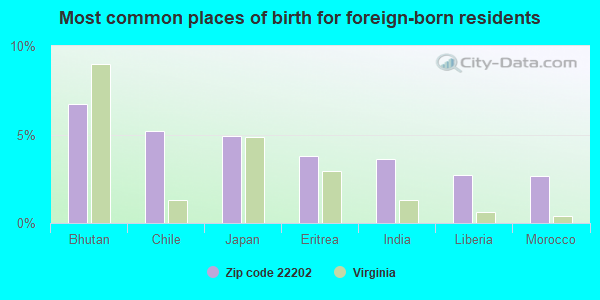
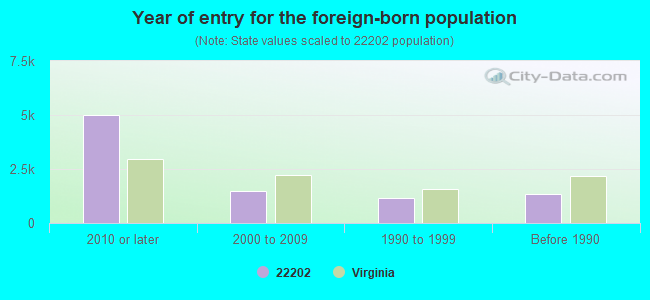
Foreign born population: 7,348 (26.0%) (42.6% of them are naturalized citizens)
Major facilities with environmental interests located in this zip code:
AIRPORT HYATT HOTEL (2799 JEFFERSON DAVIS HIGHWAY in ARLINGTON, VA)
AIR MINOR (AIRS/AFS) STATE MASTER (Virginia pollutants databases) - CEDS-71842, AIR PROGRAM Conditionally Exempt Small Quantity Generators, less than 100 kg/month of hazardous waste (Resource Conservation and Recovery Act (tracking hazardous waste)) - notification Business SIC classification: HOTELS AND MOTELS Business NAICS classification: HOTELS (EXCEPT CASINO HOTELS) AND MOTELS. Organizations: OPERNAME (CONTACT/OPERATOR)
, AIRPORT PLAZA ASSOC (CONTACT/OWNER)
Alternative names: HYATT REGENCY CRYSTAL CITY
CITY CLEANERS (1425 SOUTH EADS ST in ARLINGTON, VA)
AIR MINOR (AIRS/AFS) STATE MASTER (Virginia pollutants databases) - CEDS-72063, AIR PROGRAM Small Quantity Generators, between 100 kg and 1000 kg of hazardous waste/month (Resource Conservation and Recovery Act (tracking hazardous waste)) - notification Business SIC classification: DRYCLEANING PLANTS, EXCEPT RUG CLEANING Business NAICS classification: DRYCLEANING AND LAUNDRY SERVICES (EXCEPT COIN-OPERATED). Organizations: OPERNAME (CONTACT/OPERATOR)
, KIM, TONY (CONTACT/OWNER)
ARLINGTON CLEANERS (3409 WILSON BOULEVARD in ARLINGTON, VA)
AIR MINOR (AIRS/AFS) STATE MASTER (Virginia pollutants databases) - CEDS-72211, AIR PROGRAM Business SIC classification: DRYCLEANING PLANTS, EXCEPT RUG CLEANING Business NAICS classification: DRYCLEANING AND LAUNDRY SERVICES (EXCEPT COIN-OPERATED).
BERKLEY APARTMENTS (2900 S GLEBE RD in ARLINGTON, VA)
AIR MINOR (AIRS/AFS) STATE MASTER (Virginia pollutants databases) - CEDS-70592, AIR PROGRAM Business SIC classification: OPERATORS OF APARTMENT BUILDINGS Business NAICS classification: LESSORS OF RESIDENTIAL BUILDINGS AND DWELLINGS.
CARLTON CONDOMINIUM (4600 SOUTH FOUR MILE RUN in ARLINGTON, VA)
AIR MINOR (AIRS/AFS) STATE MASTER (Virginia pollutants databases) - CEDS-70565, AIR PROGRAM Business SIC classification: OPERATORS OF APARTMENT BUILDINGS Business NAICS classification: LESSORS OF RESIDENTIAL BUILDINGS AND DWELLINGS.
CLARIDGE HOUSE ASSOCIATES (1500 S. FERN ST. in ARLINGTON, VA)
AIR MINOR (AIRS/AFS) STATE MASTER (Virginia pollutants databases) - CEDS-71796, AIR PROGRAM Business SIC classification: SKILLED NURSING CARE FACILITIES Business NAICS classification: CONTINUING CARE RETIREMENT COMMUNITIES.
BUSY BEE CHILD CARE (913 SOUTH 23RD STREET in ARLINGTON, VA)
(Integrated Compliance Information System) - ICIS-03-1989-0230, FORMAL ENFORCEMENT ACTION COMPLIANCE ACTIVITY (Tracking inspections of insecticide, fungicide, and rodenticide, and toxic substances) Business SIC classification: CHILD DAY CARE SERVICES Alternative names: BUSY BEE CHILD CARE CENTER
CHESAPEAKE & POTOMAC TELEPHONE CO (1201 S HAYES ST in ARLINGTON, VA)
Small Quantity Generators, between 100 kg and 1000 kg of hazardous waste/month (Resource Conservation and Recovery Act (tracking hazardous waste)) - notification (Resource Conservation and Recovery Act (tracking hazardous waste)) Organizations: OPERNAME (CONTACT/OPERATOR)
, CHESAPEAKE & POTOMAC TELEPHONE COMPANY (CONTACT/OWNER)
, AT&T (CONTACT/OWNER)
Alternative names: WESTERN ELEC CO
ALUMINUM FINISHING CO (300 S 10TH ST in ARLINGTON, VA)
(Resource Conservation and Recovery Act (tracking hazardous waste)) Business NAICS classification: ELECTROPLATING, PLATING, POLISHING, ANODIZING, AND COLORING. Organizations: OPERNAME (CONTACT/OPERATOR)
1ST CHOICE BODY SHOP (525 31ST ST SOUTH in ARLINGTON, VA)
AIR MINOR (AIRS/AFS) Business SIC classification: TOP, BODY, AND UPHOLSTERY REPAIR SHOPS AND PAINT SHOPS
ACEND INC PENTAGON PHASE 1 (100 BOUNDARY CHANNEL DR in ARLINGTON, VA) . Federal Facility. UNDETERMINED OR UNKNOWN AGENCY AFFILIATION
(Resource Conservation and Recovery Act (tracking hazardous waste))
ANALYSIS & TECHNOLOGY INC (2121 CRYSTAL DR in ARLINGTON, VA)
Small Quantity Generators, between 100 kg and 1000 kg of hazardous waste/month (Resource Conservation and Recovery Act (tracking hazardous waste)) - notification Organizations: OPERNAME (CONTACT/OPERATOR)
BUDGET RENT A CAR (1200 S EADS ST in ARLINGTON, VA)
Conditionally Exempt Small Quantity Generators, less than 100 kg/month of hazardous waste (Resource Conservation and Recovery Act (tracking hazardous waste)) - notification Organizations: OPERNAME (CONTACT/OPERATOR)
, NOT ON APPLICATION (CONTACT/OWNER)
Housing units lacking complete plumbing facilities: 0.3% Housing units lacking complete kitchen facilities: 1.1%
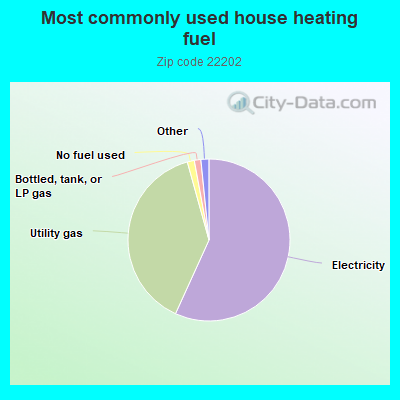
56.8%Electricity
38.9%Utility gas
1.4%No fuel used
1.3%Bottled, tank, or LP gas
0.8%Fuel oil, kerosene, etc.
0.7%Other fuel
Population in 1990: 17,453.
Place of birth for U.S.-born residents:
This state: 4,026
Northeast: 4,671
Midwest: 2,798
South: 6,010
West: 2,392
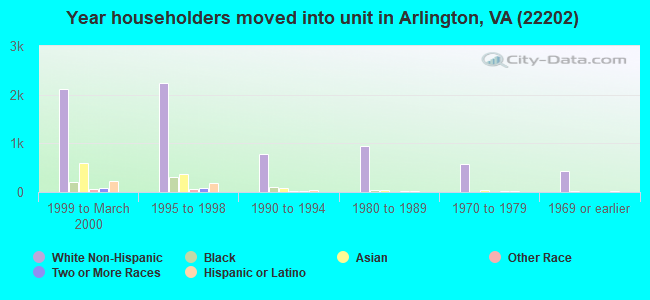
37% of the 22202 zip code residents lived in the same house 5 years ago. Out of people who lived in different houses, 18% lived in this county. Out of people who lived in different counties, 50% lived in Virginia.
72% of the 22202 zip code residents lived in the same house 1 year ago. Out of people who lived in different houses, 19% moved from this county. Out of people who lived in different houses, 17% moved from different county within same state. Out of people who lived in different houses, 50% moved from different state. Out of people who lived in different houses, 14% moved from abroad.
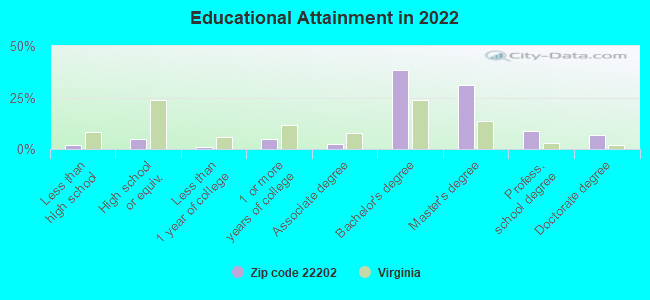
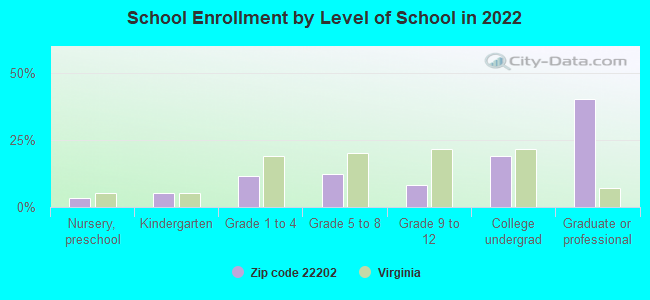
Private vs. public school enrollment:
Students in private schools in grades 1 to 8 (elementary and middle school): 198
Here:
16.9%
Virginia:
13.2%
Students in private schools in grades 9 to 12 (high school): 5
Here:
1.4%
Virginia:
10.2%
Students in private undergraduate colleges: 251
Here:
27.2%
Virginia:
18.7%
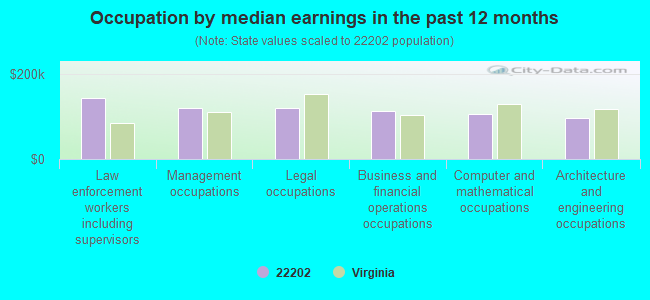
Occupation by median earnings in the past 12 months ($)
143,452Law enforcement workers including supervisors
121,333Management occupations
119,664Legal occupations
114,472Business and financial operations occupations
105,633Computer and mathematical occupations
95,939Architecture and engineering occupations
Companies with biggest federal contracts located in this zip code (ARLINGTON, VA):
GPC SMALL BUSINESS (2011 CRYSTAL DR STE 911; small business) : $543,629,739 in 2698 contractsfrom 2003 to 2006
Contracts for Miscellaneous Items, Office Supplies, ADPE System Configuration, Non-Food Items For Resale, and moreby Army, Agricultural Research Service, Air Force, Defense Logistics Agency, and others Signed by year:2000: $0; 2001: $0; 2002: $0; 2003: $17,659,083; 2004: $123,102,564; 2005: $302,676,888; 2006: $100,191,204.
Biggest contracts:
$5,297,714 with Army for Miscellaneous Items. Taking place in AL. Signed on 2004-08-01. Completion date: 2004-08-31.
$5,294,000 with Agricultural Research Service for Miscellaneous Items. Taking place in MD. Signed on 2006-01-01. Completion date: 2006-09-30.
$5,211,243 with Army for Miscellaneous Items. Taking place in AL. Signed on 2004-04-01. Completion date: 2004-04-30.
$4,886,191 with Air Force for Miscellaneous Items. Taking place in FL. Signed on 2005-07-01. Completion date: 2005-09-30.
GPC LARGE BUSINESS (2011 CRYSTAL DR STE 911) : $417,991,250 in 1827 contractsfrom 2003 to 2006
Contracts for Miscellaneous Items, Office Supplies, Airframe Structural Components, Invalid code: AT17, and moreby Army, Air Force, Defense Logistics Agency, Agricultural Research Service, and others Signed by year:2000: $0; 2001: $0; 2002: $0; 2003: $11,582,779; 2004: $89,520,754; 2005: $231,326,111; 2006: $85,561,606.
Biggest contracts:
$16,230,165 with Army for Miscellaneous Items. Taking place in TX. Signed on 2005-09-01. Completion date: 2005-09-30.
$7,220,309 with Army for Miscellaneous Items. Taking place in AL. Signed on 2006-04-30. Completion date: 2006-05-01.
$6,231,535, same as above.Signed on 2004-04-01. Completion date: 2004-04-30.
$5,931,806 with Air Force for Miscellaneous Items. Taking place in FL. Signed on 2005-07-01. Completion date: 2005-09-30.
BELL HELICOPTER TEXTRON INC (1235 JEFFERSON DAVIS HWY) : $190,639,787 in 105 contractsfrom 2000 to 2005
Contracts for Defense Aircraft -- Basic Research (R&D), Defense Aircraft -- Operational Systems Development (R&D), Aircraft Ground Servicing Equipment, Aircraft, Rotary Wing, and moreby Navy Signed by year:2000: $40,524,348; 2001: $24,118,582; 2002: $8,243,631; 2003: $1,490,369; 2004: $59,019,798; 2005: $57,243,059; 2006: $0.
Biggest contracts:
$32,000,000 with Navy for Defense Aircraft -- Basic Research (R&D). Taking place in MD. Signed on 2005-03-30. Completion date: 2006-04-30.
$22,000,000 with Navy for Defense Aircraft -- Operational Systems Development (R&D). Taking place in PA. Signed on 2004-12-01. Completion date: 2005-09-30.
$17,288,923 with Navy for Aircraft Ground Servicing Equipment. Taking place in MD. Signed on 2000-06-29. Completion date: 2001-06-09.
$16,266,894 with Navy for Aircraft, Rotary Wing. Taking place in MD. Signed on 2005-03-15. Completion date: 2005-12-01.
CHEROKEE INFORMATION SERVICES (1215 JEFFERSON DAVIS HWY; small business) : $180,439,360 in 761 contractsfrom 1999 to 2006
Contracts for Other ADP and Telecommunications Services (includes data storage on tapes, compact disks, etc.), Computer Aided Design/Computer Aided Manufacturing (CAD/CAM) Services, Other Professional Services, Maintenance, Repair and Rebuilding of Equipment -- Miscellaneous, and moreby Defense Logistics Agency, Defense Threat Reduction Agency, Department of Defense, Indian Affairs (Assistant Secretary), and others Signed by year:2000: $8,980,986; 2001: $17,216,581; 2002: $25,463,242; 2003: $14,687,101; 2004: $49,848,843; 2005: $52,364,136; 2006: $11,713,471.
Biggest contracts:
$3,946,945 with Defense Logistics Agency for Other ADP and Telecommunications Services (includes data storage on tapes, compact disks, etc.). Taking place in PA. Signed on 2005-03-09. Completion date: 2005-09-30.
$3,100,871 with Defense Threat Reduction Agency for Computer Aided Design/Computer Aided Manufacturing (CAD/CAM) Services. Signed on 2006-03-30. Completion date: 2010-04-14.
$2,953,883 with Defense Logistics Agency for Other Professional Services. Taking place in PA. Signed on 2004-04-01. Completion date: 2004-09-30.
$2,924,564 with Defense Threat Reduction Agency for Computer Aided Design/Computer Aided Manufacturing (CAD/CAM) Services. Signed on 2004-03-29. Completion date: 2010-04-14.
HJ FORD ASSOCIATES INCORPORATE (1111 JEFFERSON DAVIS HIGHW; small business) : $161,584,588 in 645 contractsfrom 1999 to 2006
Contracts for Program Review/Development Services, Program Management/Support Services, Engineering and Technical Services, Technical Assistance, and moreby Air Force, Navy, Army, United States Coast Guard (disused code: now 7008), and others Signed by year:2000: $15,290,706; 2001: $4,446,225; 2002: $2,832,462; 2003: $15,895,753; 2004: $40,401,671; 2005: $50,976,169; 2006: $25,429,915.
Biggest contracts:
$10,199,970 with Air Force for Program Review/Development Services. Signed on 2005-11-29. Completion date: 2006-11-30.
$9,082,867 with Air Force for Program Management/Support Services. Signed on 2004-11-22. Completion date: 2005-11-30.
$8,295,387 with Air Force for Engineering and Technical Services. Signed on 2003-11-28. Completion date: 2004-11-30.
$4,604,400 with Air Force for Program Management/Support Services. Taking place in OH. Signed on 2005-12-29. Completion date: 2006-11-30.
WASHINGTON DEMILITARIZATION CO (2345 CRYSTAL DRIVE, SUITE) : $121,723,362 in 63 contractsfrom 1999 to 2006
Contracts for Well Drilling/Exploratory Services, Logistics Support Services, Other Defense -- Applied Research and Exploratory Development (R&D), Architect - Engineer Services (including landscaping, interior layout, and designing) by Army Signed by year:2000: $76,578,730; 2001: $0; 2002: $1,108,812; 2003: $80,305; 2004: $2,883,092; 2005: $4,023,123; 2006: $3,049,300.
Biggest contracts:
$40,055,000 with Army for Well Drilling/Exploratory Services. Taking place in AR. Signed on 2000-02-22. Completion date: 2001-12-07.
$34,000,000, same as above.Signed on 1999-12-02. Completion date: 2000-07-28.
$22,500,000, same as above.Signed on 2000-05-19. Completion date: 2001-06-08.
$5,168,000, same as above.Signed on 2000-09-26. Completion date: 2001-09-30.
PHOENIX MARINE INC (2361 JEFFERSON DAVIS HIGHW; small business) : $112,555,044 in 677 contractsfrom 1999 to 2006
Contracts for Other Salvage Services, Geophysical Instruments, Services -- Advanced Development (R&D), Oil Spill Response including Cleanup, Removal, Disposal and Operational Support, and moreby Navy, National Oceanic and Atmospheric Administration/Under Secretary for Oceans and Atmosphere, U.S. Coast Guard Signed by year:2000: $6,814,393; 2001: $10,525,578; 2002: $20,743,863; 2003: $25,743,503; 2004: $13,825,073; 2005: $21,888,821; 2006: $12,987,067.
Biggest contracts:
$11,132,597 with Navy for Other Salvage Services. Taking place in MD. Signed on 2003-02-21. Completion date: 2004-03-31.
$5,181,818, same as above.Signed on 2002-03-20. Completion date: 2003-06-30.
$3,327,132, same as above.Signed on 2006-03-07. Completion date: 2006-12-31.
$2,584,762, same as above.Signed on 2005-03-04. Completion date: 2007-09-30.
SYSTEMS INTEGRATION AND MANAGE (2611 JEFFERSON DAVIS HWY; small business) : $77,347,536 in 719 contractsfrom 1999 to 2006
Contracts for Automated Information System Design and Integration Services, ADP Systems Analysis Services, Video Recording and Reproducing Equipment, Other ADP and Telecommunications Services (includes data storage on tapes, compact disks, etc.), and moreby Navy, Federal Technology Service, Army, Department of Defense, and others Signed by year:2000: $11,345,444; 2001: $8,023,654; 2002: $14,449,909; 2003: $14,137,312; 2004: $12,270,861; 2005: $8,050,602; 2006: $8,406,517.
Biggest contracts:
$3,138,502 with Navy for Automated Information System Design and Integration Services. Signed on 2002-09-30. Completion date: 2003-09-29.
$2,156,000 with Federal Technology Service for ADP Systems Analysis Services. Signed on 2002-05-15. Completion date: 2003-05-15.
$1,176,887 with Navy for Video Recording and Reproducing Equipment. Taking place in SC. Signed on 2003-11-14. Completion date: 2004-01-30.
$1,171,404 with Navy for Other ADP and Telecommunications Services (includes data storage on tapes, compact disks, etc.). Taking place in TX. Signed on 2006-02-10. Completion date: 2006-09-30.
ENGINEERING SERVICES NETWORK, (2450 CRYSTAL DRIVE, STE 10; small business) 1000 employees, $0 revenue. Veteran Owned Business, Service Disabled Veteran Owned Firm: $75,605,789 in 593 contractsfrom 1999 to 2006
Contracts for Other ADP and Telecommunications Services (includes data storage on tapes, compact disks, etc.), Engineering and Technical Services, Other Professional Services, Program Management/Support Services, and moreby Army, Agency for Healthcare Research and Quality, Navy, Air Force, and others Signed by year:2000: $5,188,441; 2001: $6,010,650; 2002: $10,482,548; 2003: $9,700,152; 2004: $14,280,497; 2005: $17,700,508; 2006: $11,790,270.
Biggest contracts:
$2,104,967 with Army for Other ADP and Telecommunications Services (includes data storage on tapes, compact disks, etc.). Taking place in DC. Signed on 2006-02-23. Completion date: 2006-02-23.
$2,085,724, same as above.Signed on 2005-02-23. Effective on 2005-02-24. Completion date: 2006-02-23.
$1,979,593, same as above.Signed on 2004-02-24. Completion date: 2005-01-31.
$1,956,902 with Army for Engineering and Technical Services. Signed on 2002-05-26. Completion date: 2003-05-01.
VERIDIAN ENGINEERING, INC (1200 SOUTH HAYES STREET) : $72,401,553 in 415 contractsfrom 1999 to 2006
Contracts for Other Research and Development -- Basic Research (R&D), Other Research and Development -- Applied Research and Exploratory Development (R&D), Invalid code: AC17, Scientific and Management Education, and moreby Air Force, Navy, Army Signed by year:2000: $28,044,369; 2001: $12,658,400; 2002: $12,482,687; 2003: $1,032,517; 2004: $1,152,257; 2005: $5,557,472; 2006: $2,934,199.
Biggest contracts:
$2,235,000 with Air Force for Other Research and Development -- Basic Research (R&D). Taking place in NY. Signed on 2002-05-23. Completion date: 2007-03-31.
$1,629,000, same as above.Signed on 2002-03-26. Completion date: 2007-03-31.
$1,475,000, same as above.Signed on 2005-02-03. Completion date: 2007-03-31.
$1,300,000 with Air Force for Other Research and Development -- Applied Research and Exploratory Development (R&D). Taking place in NY. Signed on 1999-10-20. Completion date: 2001-01-10.
Top industries in this zip code by the number of employees in 2005:
Administrative and Support and Waste Management and Remediation Services: Facilities Support Services (over 1000: 1, 500-999: 1, 100-249: 1, 20-49: 1, 10-19: 1, 1-4: 1)
Professional, Scientific, and Technical Services: Research and Development in the Physical, Engineering, and Life Sciences (250-499: 1, 100-249: 1, 50-99: 4, 20-49: 9, 10-19: 4, 5-9: 4, 1-4: 8)
2003 - 2018 National Fire Incident Reporting System (NFIRS) incidents
Based on the data from the years 2003 - 2018 the average number of fire incidents per year is 65. The highest number of reported fires - 105 took place in 2006, and the least - 7 in 2003. The data has an increasing trend.
When looking into fire subcategories, the most incidents belonged to: Structure Fires (57.2%), and Outside Fires (27.4%).
Fire incident types reported to NFIRS in Zip Code 22202

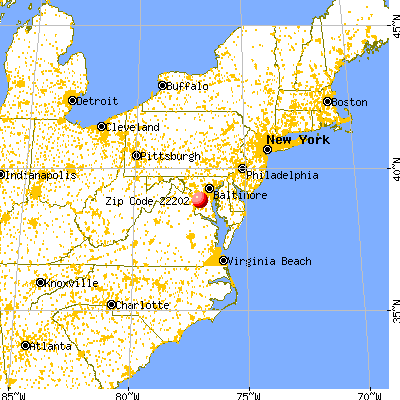


 Nearest zip codes: 22305, 22214, 22211, 20024, 20319, 20418.


 Based on the data from the years 2003 - 2018 the average number of fire incidents per year is 65. The highest number of reported fires - 105 took place in 2006, and the least - 7 in 2003. The data has an increasing trend.
 When looking into fire subcategories, the most incidents belonged to: Structure Fires (57.2%), and Outside Fires (27.4%).