Estimated zip code population in 2022: 10,147 Zip code population in 2010: 8,927 Zip code population in 2000: 8,424
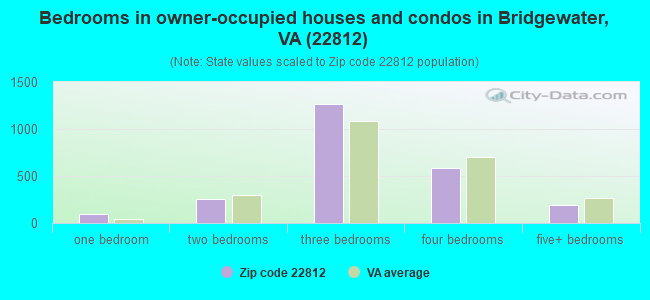
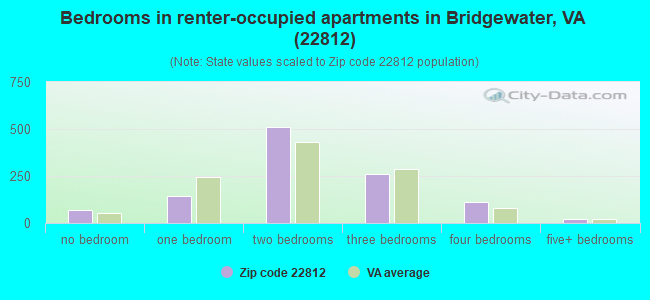
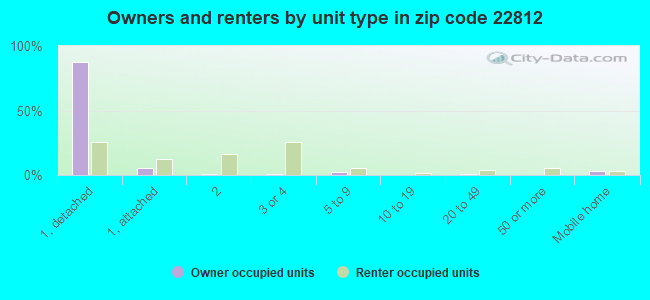
Houses and condos: 3,715 Renter-occupied apartments: 1,119
% of renters here:
32%
State:
33%
March 2022 cost of living index in zip code 22812: 87.9 (less than average, U.S. average is 100)
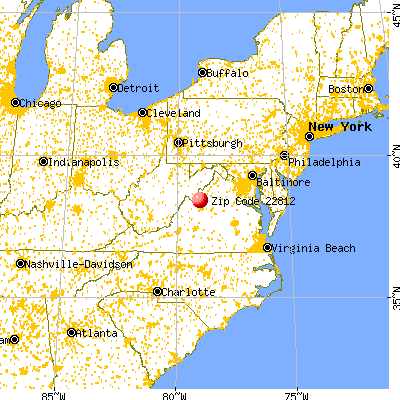
Land area: 43.1 sq. mi. Water area: 0.5 sq. mi.
Population density: 236 people per square mile
(very low).
OSM Map
General Map
Google Map
MSN Map
OSM Map
General Map
Google Map
MSN Map
OSM Map
General Map
Google Map
MSN Map
OSM Map
General Map
Google Map
MSN Map
Please wait while loading the map...
Real estate property taxes paid for housing units in 2022:
This zip code:
0.5% ($1,786)
Virginia:
0.7% ($2,617)
Median real estate property taxes paid for housing units with mortgages in 2022: $1,865 (0.5%) Median real estate property taxes paid for housing units with no mortgage in 2022: $1,696 (0.6%)
Business Search- 14 Million verified businesses
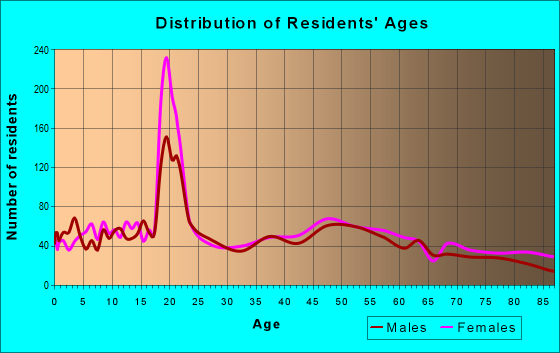
Males: 4,535
(44.7%)
Females: 5,611
(55.3%)
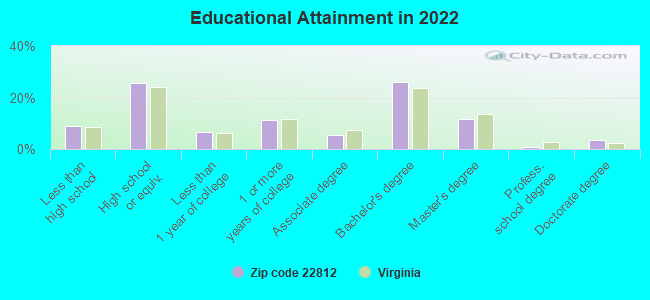
For population 25 years and over in 22812:
High school or higher: 91.0%
Bachelor's degree or higher: 41.9%
Graduate or professional degree: 16.1%
Unemployed: 4.3%
Mean travel time to work (commute): 17.3 minutes
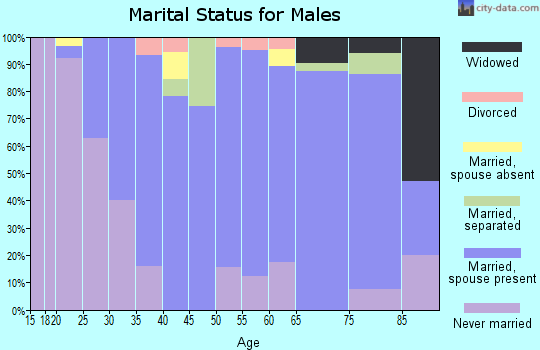
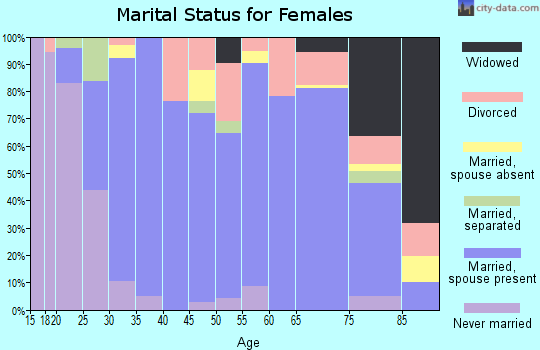
For population 15 years and over in 22812:
Never married: 37.4%
Now married: 47.0%
Separated: 1.1%
Widowed: 6.3%
Divorced: 8.2%
Zip code 22812 compared to state average:
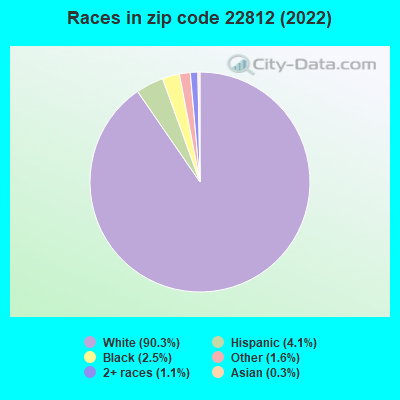
Black race population percentage significantly below state average.
Hispanic race population percentage below state average.
Median age below state average.
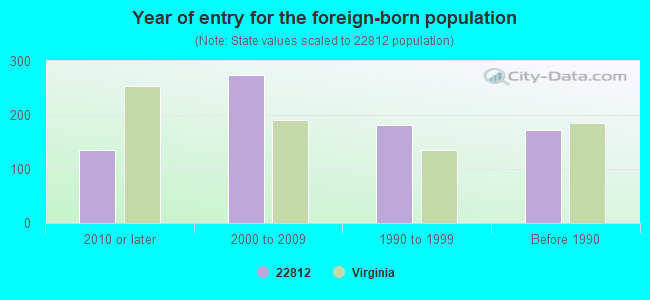
Foreign-born population percentage below state average.
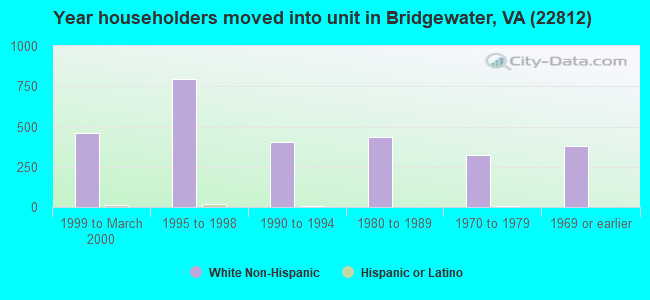
Length of stay since moving in significantly above state average.
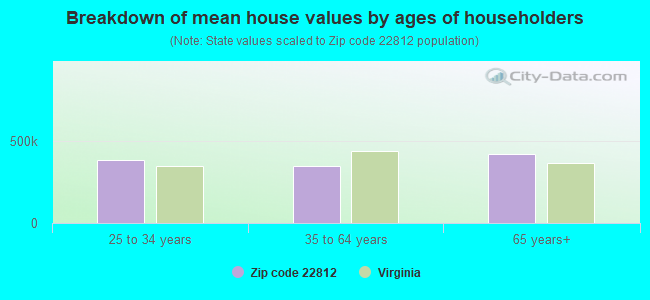
Estimated median house/condo value in 2022: $339,117
22812:
$339,117
Virginia:
$365,700
According to our research of Virginia and other state lists, there were 6 registered sex offenders living in 22812 zip code as of April 24, 2024. The ratio of all residents to sex offenders in zip code 22812 is 1,492 to 1. The ratio of registered sex offenders to all residents in this zip code is much lower than the state average.
Median resident age:
This zip code:
35.0 years
Virginia median age:
39.0 years
Average household size:
This zip code:
2.4 people
Virginia:
2.5 people
Averages for the 2020 tax year for zip code 22812, filed in 2021:
Average Adjusted Gross Income (AGI) in 2020: $67,648 (Individual Income Tax Returns)
Here:
$67,648
State:
$86,446
Salary/wage: $52,760 (reported on 75.6% of returns)
Here:
$52,760
State:
$71,185
(% of AGI for various income ranges: 1124.6% for AGIs below $25k, 3629.4% for AGIs $25k-50k, 6183.3% for AGIs $50k-75k, 8735.8% for AGIs $75k-100k, 16619.7% for AGIs $100k-200k, 64780.0% for AGIs over 200k)
Taxable interest for individuals: $1,801 (reported on 41.2% of returns)
This zip code:
$1,801
Virginia:
$1,805
(% of AGI for various income ranges: 37.9% for AGIs below $25k, 39.3% for AGIs $25k-50k, 90.0% for AGIs $50k-75k, 147.1% for AGIs $75k-100k, 251.8% for AGIs $100k-200k, 2636.7% for AGIs over 200k)
Ordinary dividends: $6,489 (reported on 28.9% of returns)
Here:
$6,489
State:
$8,327
(% of AGI for various income ranges: 64.6% for AGIs below $25k, 92.8% for AGIs $25k-50k, 234.3% for AGIs $50k-75k, 310.0% for AGIs $75k-100k, 765.2% for AGIs $100k-200k, 6650.0% for AGIs over 200k)
Net capital gain/loss in AGI: +$14,831 (reported on 26.7% of returns)
Here:
+$14,831
State:
+$24,644
(% of AGI for various income ranges: 29.0% for AGIs below $25k, 71.4% for AGIs $25k-50k, 210.7% for AGIs $50k-75k, 300.6% for AGIs $75k-100k, 1030.0% for AGIs $100k-200k, 33603.3% for AGIs over 200k)
Profit/loss from business: +$17,286 (reported on 15.8% of returns)
Here:
+$17,286
State:
+$12,836
(% of AGI for various income ranges: 168.2% for AGIs below $25k, 168.8% for AGIs $25k-50k, 365.0% for AGIs $50k-75k, 498.4% for AGIs $75k-100k, 711.8% for AGIs $100k-200k, 10756.7% for AGIs over 200k)
Taxable individual retirement arrangement distribution: $15,603 (reported on 14.3% of returns)
22812:
$15,603
Virginia:
$21,535
(% of AGI for various income ranges: 111.3% for AGIs below $25k, 113.6% for AGIs $25k-50k, 335.5% for AGIs $50k-75k, 489.7% for AGIs $75k-100k, 1102.7% for AGIs $100k-200k, 2920.0% for AGIs over 200k)
Self-employed (Keogh) retirement plans: $21,933 (reported on 0.7% of returns)
22812:
$21,933
Virginia:
$31,172
(% of AGI for various income ranges: 199.4% for AGIs $100k-200k)
Total itemized deductions: $39,524 (reported on 9.4% of returns)
Here:
$39,524
State:
$33,287
(% of AGI for various income ranges: 255.7% for AGIs $25k-50k, 436.7% for AGIs $50k-75k, 642.3% for AGIs $75k-100k, 1508.2% for AGIs $100k-200k, 14586.7% for AGIs over 200k)
Charity contributions: $16,284 (reported on 7.9% of returns)
Here:
$16,284
State:
$10,381
(% of AGI for various income ranges: 34.3% for AGIs $25k-50k, 70.0% for AGIs $50k-75k, 179.7% for AGIs $75k-100k, 523.0% for AGIs $100k-200k, 7956.7% for AGIs over 200k)
Taxes paid: $6,239 (reported on 9.4% of returns)
22812:
$6,239
State:
$8,284
(% of AGI for various income ranges: 22.1% for AGIs $25k-50k, 56.2% for AGIs $50k-75k, 105.8% for AGIs $75k-100k, 304.5% for AGIs $100k-200k, 2143.3% for AGIs over 200k)
Earned income credit: $1,937 (reported on 10.6% of returns)
Here:
$1,937
State:
$2,214
(% of AGI for various income ranges: 63.5% for AGIs below $25k, 53.1% for AGIs $25k-50k)
Percentage of individuals using paid preparers for their 2020 taxes: 92.6%
Here:
93%
State:
92%
(% for various income ranges: 89.4% for AGIs below $25k, 93.8% for AGIs $25k-50k, 93.9% for AGIs $50k-75k, 93.9% for AGIs $75k-100k, 94.0% for AGIs $100k-200k, 92.9% for AGIs over 200k)
Averages for the 2012 tax year for zip code 22812, filed in 2013:
Average Adjusted Gross Income (AGI) in 2012: $54,228 (Individual Income Tax Returns)
Here:
$54,228
State:
$71,192
Salary/wage: $44,793 (reported on 79.5% of returns)
Here:
$44,793
State:
$59,229
(% of AGI for various income ranges: 73.7% for AGIs below $25k, 71.7% for AGIs $25k-50k, 68.8% for AGIs $50k-75k, 64.6% for AGIs $75k-100k, 64.8% for AGIs $100k-200k, 50.6% for AGIs over 200k)
Taxable interest for individuals: $2,023 (reported on 43.4% of returns)
This zip code:
$2,023
Virginia:
$1,600
(% of AGI for various income ranges: 2.2% for AGIs below $25k, 1.6% for AGIs $25k-50k, 1.2% for AGIs $50k-75k, 1.6% for AGIs $75k-100k, 1.1% for AGIs $100k-200k, 3.1% for AGIs over 200k)
Ordinary dividends: $4,619 (reported on 30.1% of returns)
Here:
$4,619
State:
$6,959
(% of AGI for various income ranges: 2.5% for AGIs below $25k, 1.8% for AGIs $25k-50k, 2.4% for AGIs $50k-75k, 2.6% for AGIs $75k-100k, 3.3% for AGIs $100k-200k, 2.3% for AGIs over 200k)
Net capital gain/loss in AGI: +$5,991 (reported on 23.7% of returns)
Here:
+$5,991
State:
+$16,672
(% of AGI for various income ranges: 0.5% for AGIs below $25k, 1.0% for AGIs $25k-50k, 1.2% for AGIs $50k-75k, 2.1% for AGIs $75k-100k, 3.0% for AGIs $100k-200k, 8.6% for AGIs over 200k)
Profit/loss from business: +$11,712 (reported on 15.7% of returns)
Here:
+$11,712
State:
+$14,116
(% of AGI for various income ranges: 4.3% for AGIs below $25k, 3.6% for AGIs $25k-50k, 3.1% for AGIs $50k-75k, 3.3% for AGIs $75k-100k, 4.9% for AGIs $100k-200k)
Taxable individual retirement arrangement distribution: $11,309 (reported on 14.9% of returns)
22812:
$11,309
Virginia:
$16,667
(% of AGI for various income ranges: 3.8% for AGIs below $25k, 2.9% for AGIs $25k-50k, 3.1% for AGIs $50k-75k, 3.2% for AGIs $75k-100k, 4.5% for AGIs $100k-200k)
Self-employment retirement plans: $16,100 (reported on 0.8% of returns)
22812:
$16,100
Virginia:
$25,373
Total itemized deductions: $21,556 (24% of AGI, reported on 35.4% of returns)
Here:
$21,556
State:
$26,596
Here:
24.0% of AGI
State:
20.1% of AGI
(% of AGI for various income ranges: 12.6% for AGIs below $25k, 11.9% for AGIs $25k-50k, 13.1% for AGIs $50k-75k, 14.8% for AGIs $75k-100k, 16.6% for AGIs $100k-200k, 13.1% for AGIs over 200k)
Charity contributions: $6,145 (reported on 29.8% of returns)
Here:
$6,145
State:
$4,443
(% of AGI for various income ranges: 1.2% for AGIs below $25k, 1.9% for AGIs $25k-50k, 2.7% for AGIs $50k-75k, 2.9% for AGIs $75k-100k, 4.9% for AGIs $100k-200k, 5.4% for AGIs over 200k)
Taxes paid: $5,535 (reported on 35.4% of returns)
22812:
$5,535
State:
$9,951
(% of AGI for various income ranges: 1.0% for AGIs below $25k, 1.8% for AGIs $25k-50k, 2.8% for AGIs $50k-75k, 4.0% for AGIs $75k-100k, 5.2% for AGIs $100k-200k, 5.1% for AGIs over 200k)
Earned income credit: $1,854 (reported on 12.8% of returns)
Here:
$1,854
State:
$2,211
(% of AGI for various income ranges: 3.9% for AGIs below $25k, 0.8% for AGIs $25k-50k)
Percentage of individuals using paid preparers for their 2012 taxes: 59.6%
Here:
60%
State:
46%
(% for various income ranges: 52.4% for AGIs below $25k, 59.8% for AGIs $25k-50k, 60.0% for AGIs $50k-75k, 68.9% for AGIs $75k-100k, 67.5% for AGIs $100k-200k, 75.0% for AGIs over 200k)
Averages for the 2004 tax year for zip code 22812, filed in 2005:
Average Adjusted Gross Income (AGI) in 2004: $45,147 (Individual Income Tax Returns)
Here:
$45,147
State:
$56,704
Salary/wage: $37,576 (reported on 79.7% of returns)
Here:
$37,576
State:
$48,441
(% of AGI for various income ranges: 129.9% for AGIs below $10k, 72.0% for AGIs $10k-25k, 74.5% for AGIs $25k-50k, 73.2% for AGIs $50k-75k, 73.3% for AGIs $75k-100k, 46.6% for AGIs over 100k)
Taxable interest for individuals: $2,090 (reported on 51.4% of returns)
This zip code:
$2,090
Virginia:
$1,688
(% of AGI for various income ranges: 11.8% for AGIs below $10k, 4.1% for AGIs $10k-25k, 2.1% for AGIs $25k-50k, 2.1% for AGIs $50k-75k, 1.3% for AGIs $75k-100k, 2.5% for AGIs over 100k)
Taxable dividends: $3,221 (reported on 32.8% of returns)
Here:
$3,221
State:
$4,028
(% of AGI for various income ranges: 7.7% for AGIs below $10k, 2.8% for AGIs $10k-25k, 1.8% for AGIs $25k-50k, 2.0% for AGIs $50k-75k, 2.7% for AGIs $75k-100k, 2.5% for AGIs over 100k)
Net capital gain/loss: +$6,712 (reported on 26.4% of returns)
Here:
+$6,712
State:
+$14,375
(% of AGI for various income ranges: 2.0% for AGIs below $10k, 0.4% for AGIs $10k-25k, 1.2% for AGIs $25k-50k, 1.7% for AGIs $50k-75k, 2.5% for AGIs $75k-100k, 9.6% for AGIs over 100k)
Profit/loss from business: +$10,143 (reported on 15.6% of returns)
Here:
+$10,143
State:
+$13,342
(% of AGI for various income ranges: 8.8% for AGIs below $10k, 4.9% for AGIs $10k-25k, 2.8% for AGIs $25k-50k, 2.8% for AGIs $50k-75k, 2.6% for AGIs $75k-100k, 4.4% for AGIs over 100k)
Profit/loss from farming: +$4,427 (reported on 4.5% of returns)
Here:
+$4,427
State:
-$5,267
(% of AGI for various income ranges: -8.4% for AGIs below $10k, 0.6% for AGIs $10k-25k, 0.8% for AGIs $25k-50k, 1.3% for AGIs $50k-75k, 1.4% for AGIs $75k-100k, -0.8% for AGIs over 100k)
IRA payment deduction: $2,878 (reported on 2.4% of returns)
22812:
$2,878
Virginia:
$2,943
(% of AGI for various income ranges: 0.2% for AGIs $10k-25k, 0.3% for AGIs $25k-50k, 0.2% for AGIs $50k-75k, 0.1% for AGIs over 100k)
Self-employed pension: $13,486 (reported on 1.0% of returns)
Here:
$13,486
Virginia:
$17,430
Total itemized deductions: $18,244 (23% of AGI, reported on 34.3% of returns)
Here:
$18,244
State:
$21,492
Here:
22.6% of AGI
State:
21.0% of AGI
(% of AGI for various income ranges: 23.6% for AGIs below $10k, 11.8% for AGIs $10k-25k, 11.1% for AGIs $25k-50k, 14.6% for AGIs $50k-75k, 14.9% for AGIs $75k-100k, 15.0% for AGIs over 100k)
Charity contributions deductions: $5,804 (7% of AGI, reported on 29.4% of returns)
Here:
$5,804
State:
$3,794
Here:
6.8% of AGI
State:
3.5% of AGI
(% of AGI for various income ranges: 2.0% for AGIs below $10k, 1.7% for AGIs $10k-25k, 2.1% for AGIs $25k-50k, 3.4% for AGIs $50k-75k, 4.0% for AGIs $75k-100k, 5.9% for AGIs over 100k)
Total tax: $6,115 (reported on 78.9% of returns)
22812:
$6,115
State:
$9,537
(% of AGI for various income ranges: 4.5% for AGIs below $10k, 4.7% for AGIs $10k-25k, 6.7% for AGIs $25k-50k, 7.8% for AGIs $50k-75k, 9.8% for AGIs $75k-100k, 18.5% for AGIs over 100k)
Earned income credit: $1,616 (reported on 8.3% of returns)
Here:
$1,616
State:
$1,734
Percentage of individuals using paid preparers for their 2004 taxes: 64.2%
Here:
64%
State:
52%
(% for various income ranges: 54.9% for AGIs below $10k, 61.7% for AGIs $10k-25k, 66.2% for AGIs $25k-50k, 70.9% for AGIs $50k-75k, 62.1% for AGIs $75k-100k, 75.6% for AGIs over 100k)
Household received Food Stamps/SNAP in the past 12 months: 183 Household did not receive Food Stamps/SNAP in the past 12 months: 3,309
Women who had a birth in the past 12 months: 178 (183 now married, 0 unmarried) Women who did not have a birth in the past 12 months: 2,546 (875 now married, 1,679 unmarried)
Housing units in zip code 22812 with a mortgage: 1,336 (177 second mortgage, 167 both second mortgage and home equity loan) Houses without a mortgage: 57
Median monthly owner costs for units with a mortgage: $1,707 Median monthly owner costs for units without a mortgage: $435
Residents with income below the poverty level in 2022:
This zip code:
7.8%
Whole state:
10.6%
Residents with income below 50% of the poverty level in 2022:
This zip code:
1.8%
Whole state:
5.2%
Median number of rooms in houses and condos:
Here:
7.2
State:
7.0
Median number of rooms in apartments:
Here:
4.5
State:
4.3
Notable locations in this zip code not listed on our city pages
Notable locations in zip code 22812: Hillview Farm (A), Weaver Brothers Dairy (B), Willow Bend Dairy (C), Mossy Creek (D), Jopson Field (E), Mapp Field (F), Creekside Farms Number 2 (G), Mountain Brooke Dairy (H), Bridgewater Home of the Aged (I), Yount Hall (J), Wright Hall (K), Wakeman Hall (L), The Carter Center for Worship and Music (M), Strickler Apartments (N), Rebecca Hall (O), President's House - Bridgewater College (P), Old Gymnasium (Q), Nininger Health and Exercise Science Center (R), Moomaw Hall (S), Memorial Hall (T). Display/hide their locations on the map
Streams, rivers, and creeks: Long Glade Creek (A), Thorny Branch (B), Spring Creek (C), Silver Creek (D), Mossy Creek (E), Dry River (F), Briery Branch (G), Beaver Creek (H). Display/hide their locations on the map
In group quarters: 1,601 (-1 institutionalized population)
Size of family households: 840 2-persons, 473 3-persons, 549 4-persons, 219 5-persons, 54 6-persons, 34 7-or-more-persons
Size of nonfamily households: 1,157 1-person, 129 2-persons, 45 3-persons
1,640 married couples with children.
210 single-parent households (16 men, 194 women).
88.7% of residents of 22812 zip code speak English at home.
4.1% of residents speak Spanish at home (72% very well, 11% well, 17% not well).
5.2% of residents speak other Indo-European language at home (77% very well, 21% well, 2% not well).
0.3% of residents speak Asian or Pacific Island language at home (81% very well, 19% well).
1.7% of residents speak other language at home (65% very well, 17% well, 18% not well).
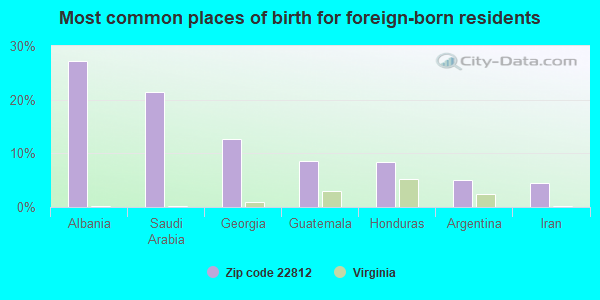
Foreign born population: 761 (7.5%) (67.7% of them are naturalized citizens)
This zip code:
7.5%
Whole state:
12.7%
27%Albania
22%Saudi Arabia
13%Georgia
9%Guatemala
8%Honduras
5%Argentina
5%Iran
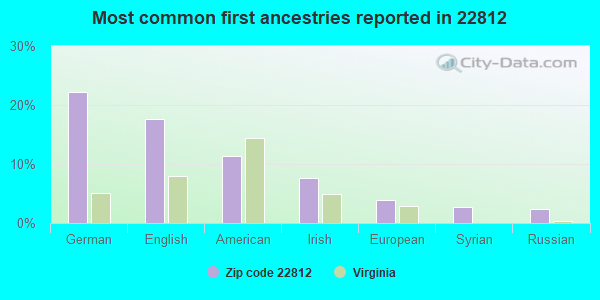
22%German
18%English
11%American
8%Irish
4%European
3%Syrian
2%Russian
Year of entry for the foreign-born population
1352010 or later
2742000 to 2009
1821990 to 1999
173Before 1990
Facilities with environmental interests located in this zip code:
BLUE RIDGE CHRISTIAN SCHOOL (100 DINKEL AVE in BRIDGEWATER, VA)
AIR MINOR (AIRS/AFS) STATE MASTER (Virginia pollutants databases) - CEDS-80179, AIR PROGRAM Business SIC and NAICS classification: ELEMENTARY AND SECONDARY SCHOOLS
BRIDGEWATER COLLEGE (402 EAST COLLEGE STREET in BRIDGEWATER, VA)
AIR SYNTHETIC MINOR (AIRS/AFS) STATE MASTER (Virginia pollutants databases) - CEDS-80476, AIR PROGRAM Conditionally Exempt Small Quantity Generators, less than 100 kg/month of hazardous waste (Resource Conservation and Recovery Act (tracking hazardous waste)) Business SIC and NAICS classification: COLLEGES, UNIVERSITIES, AND PROFESSIONAL SCHOOLS Organizations: OPERNAME (CONTACT/OPERATOR)
CHERRY HILL FARM - BRIDGEWATER (8955 WISE HOLLOW ROAD in BRIDGEWATER, VA)
AIR MINOR (AIRS/AFS) STATE MASTER (Virginia pollutants databases) - CEDS-81473, AIR PROGRAM Business SIC classification: TURKEYS AND TURKEY EGGS Business NAICS classification: TURKEY PRODUCTION.
BORDEN CHEMICAL SMITH-DOU (PO BOX 11 in BRIDGEWATER, VA)
BRIDGEWATER WTP (700 GREEN STREET in BRIDGEWATER, VA)
National Pollutant Discharge Elimination System NON-MAJOR (Tracking pollutant discharge elimination systems) - permit Business SIC classification: WATER SUPPLY Alternative names: BRIDGEWATER WATER TREAT PLANT
Housing units lacking complete kitchen facilities: 1.6%
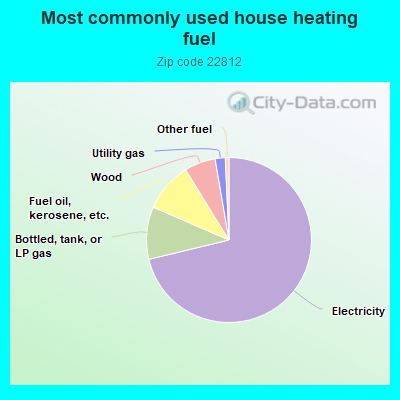
71.3%Electricity
10.3%Bottled, tank, or LP gas
9.7%Fuel oil, kerosene, etc.
6.1%Wood
2.0%Utility gas
0.7%Other fuel
Population in 1990: 7,160. Population change in the 1990s: +1,264 (+17.7%).
Place of birth for U.S.-born residents:
This state: 6,410
Northeast: 800
Midwest: 379
South: 1,299
West: 446
54% of the 22812 zip code residents lived in the same house 5 years ago. Out of people who lived in different houses, 50% lived in this county. Out of people who lived in different counties, 50% lived in Virginia.
91% of the 22812 zip code residents lived in the same house 1 year ago. Out of people who lived in different houses, 38% moved from this county. Out of people who lived in different houses, 23% moved from different county within same state. Out of people who lived in different houses, 40% moved from different state.
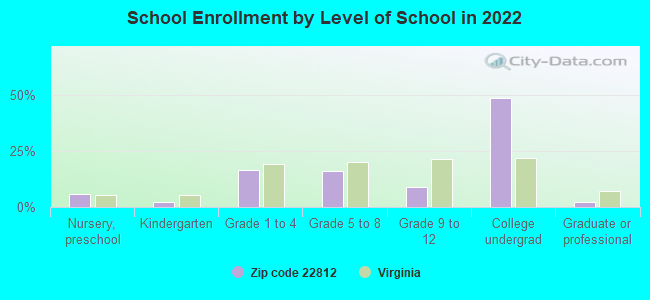
Private vs. public school enrollment:
Students in private schools in grades 1 to 8 (elementary and middle school): 240
Here:
23.0%
Virginia:
13.2%
Students in private schools in grades 9 to 12 (high school): 71
Here:
25.5%
Virginia:
10.2%
Students in private undergraduate colleges: 1,087
Here:
75.1%
Virginia:
18.7%
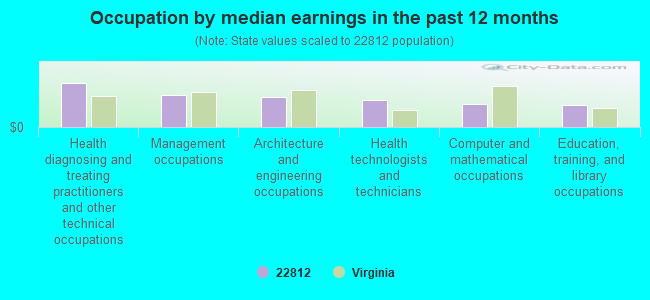
Occupation by median earnings in the past 12 months ($)
103,351Health diagnosing and treating practitioners and other technical occupations
76,257Management occupations
70,863Architecture and engineering occupations
63,181Health technologists and technicians
54,273Computer and mathematical occupations
51,087Education, training, and library occupations
Companies with federal contracts located in this zip code:
BRIDGEWATER COLLEGE (402 E COLLEGE ST in BRIDGEWATER, VA)
$4,000 with Army for Educational Studies and Analyses. Signed on 2006-02-21. Completion date: 2006-02-22.
Top industries in this zip code by the number of employees in 2005:
Health Care and Social Assistance: Nursing Care Facilities (250-499 employees: 1 establishment)
Educational Services: Colleges, Universities, and Professional Schools (250-499: 1)
2002 - 2018 National Fire Incident Reporting System (NFIRS) incidents
Based on the data from the years 2002 - 2018 the average number of fire incidents per year is 36. The highest number of reported fires - 72 took place in 2007, and the least - 13 in 2002. The data has a growing trend.
When looking into fire subcategories, the most reports belonged to: Structure Fires (61.5%), and Outside Fires (21.0%).
Fire incident types reported to NFIRS in Zip Code 22812


+$4,427
-$5,267
(% of AGI for various income ranges: -8.4% for AGIs below $10k, 0.6% for AGIs $10k-25k, 0.8% for AGIs $25k-50k, 1.3% for AGIs $50k-75k, 1.4% for AGIs $75k-100k, -0.8% for AGIs over 100k) Nearest zip codes: 22843, 24486, 24467, 22841, 22821, 22801.


 Based on the data from the years 2002 - 2018 the average number of fire incidents per year is 36. The highest number of reported fires - 72 took place in 2007, and the least - 13 in 2002. The data has a growing trend.
 When looking into fire subcategories, the most reports belonged to: Structure Fires (61.5%), and Outside Fires (21.0%).