Estimated zip code population in 2022: 679 Zip code population in 2010: 1,444 Zip code population in 2000: 1,331
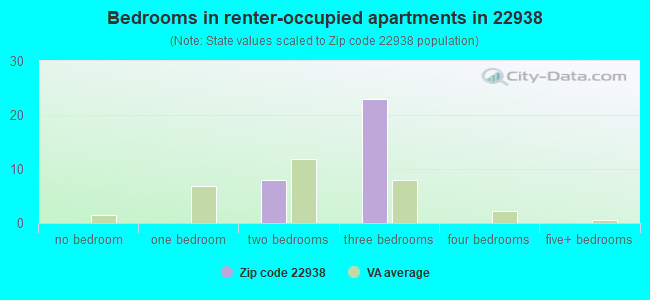
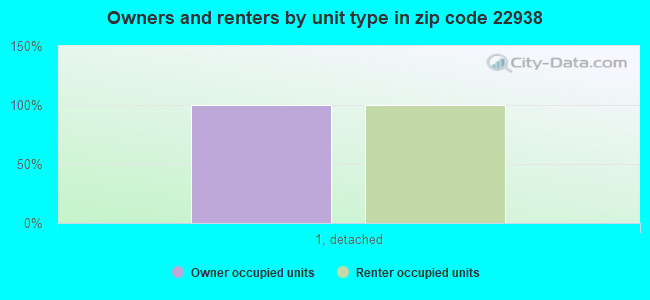
Houses and condos: 417 Renter-occupied apartments: 31
% of renters here:
9%
State:
33%
March 2022 cost of living index in zip code 22938: 86.5 (less than average, U.S. average is 100)
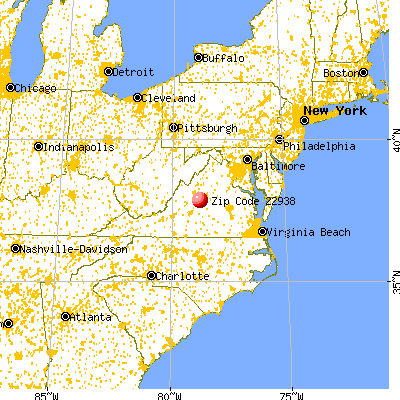
Land area: 42.5 sq. mi. Water area: 0.1 sq. mi.
Population density: 16 people per square mile
(very low).
OSM Map
General Map
Google Map
MSN Map
OSM Map
General Map
Google Map
MSN Map
OSM Map
General Map
Google Map
MSN Map
OSM Map
General Map
Google Map
MSN Map
Please wait while loading the map...
Real estate property taxes paid for housing units in 2022:
This zip code:
0.5% ($1,931)
Virginia:
0.7% ($2,617)
Median real estate property taxes paid for housing units with mortgages in 2022: $1,956 (0.4%) Median real estate property taxes paid for housing units with no mortgage in 2022: $1,898 (0.5%)
Business Search- 14 Million verified businesses
Males: 312
(45.9%)
Females: 367
(54.1%)
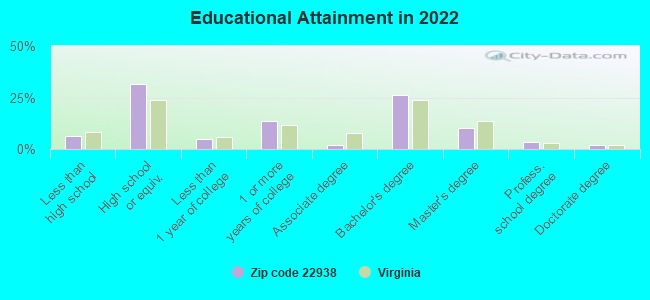
For population 25 years and over in 22938:
High school or higher: 93.1%
Bachelor's degree or higher: 41.7%
Graduate or professional degree: 15.7%
Unemployed: 3.1%
Mean travel time to work (commute): 28.6 minutes
For population 15 years and over in 22938:
Never married: 12.4%
Now married: 63.0%
Separated: 1.3%
Widowed: 7.4%
Divorced: 15.8%
Zip code 22938 compared to state average:
Median household income below state average.
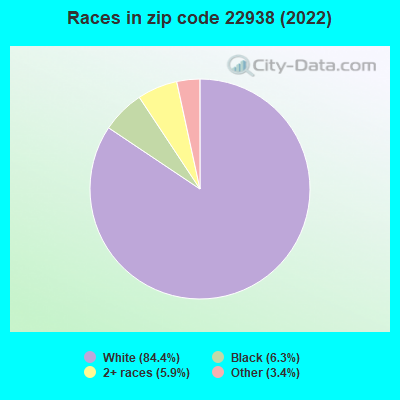
Black race population percentage significantly below state average.
Hispanic race population percentage significantly below state average.
Median age significantly above state average.
Foreign-born population percentage significantly below state average.
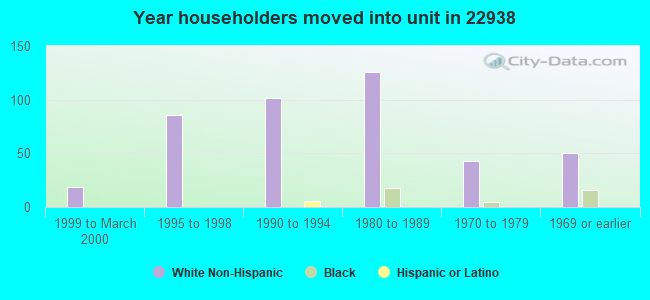
Renting percentage significantly below state average.
Length of stay since moving in significantly above state average.
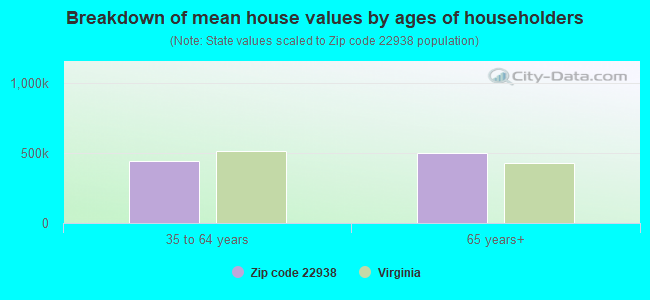
Estimated median house/condo value in 2022: $397,556
22938:
$397,556
Virginia:
$365,700
According to our research of Virginia and other state lists, there were 4 registered sex offenders living in 22938 zip code as of April 15, 2024. The ratio of all residents to sex offenders in zip code 22938 is 398 to 1. The ratio of registered sex offenders to all residents in this zip code is near the state average.
Median resident age:
This zip code:
57.0 years
Virginia median age:
39.0 years
Average household size:
This zip code:
2.0 people
Virginia:
2.5 people
Averages for the 2020 tax year for zip code 22938, filed in 2021:
Average Adjusted Gross Income (AGI) in 2020: $73,442 (Individual Income Tax Returns)
Here:
$73,442
State:
$86,446
Salary/wage: $50,983 (reported on 78.8% of returns)
Here:
$50,983
State:
$71,185
(% of AGI for various income ranges: 1073.6% for AGIs below $25k, 3676.9% for AGIs $25k-50k, 5302.5% for AGIs $50k-75k, 9822.5% for AGIs $75k-100k, 20095.0% for AGIs $100k-200k)
Taxable interest for individuals: $1,971 (reported on 31.8% of returns)
This zip code:
$1,971
Virginia:
$1,805
(% of AGI for various income ranges: 26.4% for AGIs below $25k, 14.6% for AGIs $25k-50k, 22.5% for AGIs $50k-75k, 22.5% for AGIs $75k-100k, 551.7% for AGIs $100k-200k)
Ordinary dividends: $6,087 (reported on 22.7% of returns)
Here:
$6,087
State:
$8,327
(% of AGI for various income ranges: 58.6% for AGIs below $25k, 23.8% for AGIs $25k-50k, 178.8% for AGIs $50k-75k, 1095.0% for AGIs $100k-200k)
Net capital gain/loss in AGI: +$11,025 (reported on 18.2% of returns)
Here:
+$11,025
State:
+$24,644
(% of AGI for various income ranges: 22.1% for AGIs below $25k, 252.5% for AGIs $50k-75k, 1816.7% for AGIs $100k-200k)
Profit/loss from business: +$14,008 (reported on 19.7% of returns)
Here:
+$14,008
State:
+$12,836
(% of AGI for various income ranges: 260.7% for AGIs below $25k, 248.5% for AGIs $25k-50k, 458.8% for AGIs $50k-75k, 1276.7% for AGIs $100k-200k)
Taxable individual retirement arrangement distribution: $15,743 (reported on 10.6% of returns)
22938:
$15,743
Virginia:
$21,535
(% of AGI for various income ranges: 330.8% for AGIs $25k-50k, 1120.0% for AGIs $100k-200k)
Total itemized deductions: $25,240 (reported on 7.6% of returns)
Here:
$25,240
State:
$33,287
(% of AGI for various income ranges: 608.8% for AGIs $50k-75k, 1291.7% for AGIs $100k-200k)
Charity contributions: $9,367 (reported on 4.5% of returns)
Here:
$9,367
State:
$10,381
(% of AGI for various income ranges: 702.5% for AGIs $75k-100k)
Taxes paid: $6,640 (reported on 7.6% of returns)
22938:
$6,640
State:
$8,284
(% of AGI for various income ranges: 172.5% for AGIs $50k-75k, 323.3% for AGIs $100k-200k)
Earned income credit: $1,900 (reported on 15.2% of returns)
Here:
$1,900
State:
$2,214
(% of AGI for various income ranges: 78.6% for AGIs below $25k, 61.5% for AGIs $25k-50k)
Percentage of individuals using paid preparers for their 2020 taxes: 92.4%
Here:
92%
State:
92%
(% for various income ranges: 90.5% for AGIs below $25k, 88.2% for AGIs $25k-50k, 90.9% for AGIs $50k-75k, 100.0% for AGIs $75k-100k, 100.0% for AGIs $100k-200k, 100.0% for AGIs over 200k)
Averages for the 2012 tax year for zip code 22938, filed in 2013:
Average Adjusted Gross Income (AGI) in 2012: $49,615 (Individual Income Tax Returns)
Here:
$49,615
State:
$71,192
Salary/wage: $43,534 (reported on 82.0% of returns)
Here:
$43,534
State:
$59,229
(% of AGI for various income ranges: 73.5% for AGIs below $25k, 79.3% for AGIs $25k-50k, 64.2% for AGIs $50k-75k, 70.8% for AGIs $75k-100k, 71.5% for AGIs $100k-200k)
Taxable interest for individuals: $774 (reported on 37.7% of returns)
This zip code:
$774
Virginia:
$1,600
(% of AGI for various income ranges: 1.5% for AGIs below $25k, 0.5% for AGIs $25k-50k, 0.8% for AGIs $50k-75k, 0.4% for AGIs $75k-100k, 0.4% for AGIs $100k-200k)
Ordinary dividends: $2,254 (reported on 21.3% of returns)
Here:
$2,254
State:
$6,959
(% of AGI for various income ranges: 1.3% for AGIs below $25k, 1.8% for AGIs $25k-50k, 2.1% for AGIs $50k-75k, 0.4% for AGIs $100k-200k)
Net capital gain/loss in AGI: +$3,362 (reported on 13.1% of returns)
Here:
+$3,362
State:
+$16,672
Profit/loss from business: +$7,808 (reported on 19.7% of returns)
Here:
+$7,808
State:
+$14,116
(% of AGI for various income ranges: 8.0% for AGIs below $25k, 10.2% for AGIs $25k-50k, 2.3% for AGIs $75k-100k)
Taxable individual retirement arrangement distribution: $7,960 (reported on 8.2% of returns)
22938:
$7,960
Virginia:
$16,667
Total itemized deductions: $18,661 (20% of AGI, reported on 29.5% of returns)
Here:
$18,661
State:
$26,596
Here:
20.4% of AGI
State:
20.1% of AGI
(% of AGI for various income ranges: 12.0% for AGIs $25k-50k, 12.6% for AGIs $50k-75k, 15.2% for AGIs $75k-100k, 11.4% for AGIs $100k-200k)
Charity contributions: $2,831 (reported on 21.3% of returns)
Here:
$2,831
State:
$4,443
(% of AGI for various income ranges: 0.9% for AGIs below $25k, 2.0% for AGIs $50k-75k, 1.5% for AGIs $75k-100k, 1.5% for AGIs $100k-200k)
Taxes paid: $6,383 (reported on 29.5% of returns)
22938:
$6,383
State:
$9,951
(% of AGI for various income ranges: 2.9% for AGIs $25k-50k, 3.4% for AGIs $50k-75k, 5.1% for AGIs $75k-100k, 4.9% for AGIs $100k-200k)
Earned income credit: $1,908 (reported on 19.7% of returns)
Here:
$1,908
State:
$2,211
(% of AGI for various income ranges: 5.0% for AGIs below $25k, 1.3% for AGIs $25k-50k)
Percentage of individuals using paid preparers for their 2012 taxes: 47.5%
Here:
48%
State:
46%
(% for various income ranges: 50.0% for AGIs below $25k, 37.5% for AGIs $25k-50k, 50.0% for AGIs $50k-75k, 50.0% for AGIs $75k-100k, 57.1% for AGIs $100k-200k)
Averages for the 2004 tax year for zip code 22938, filed in 2005:
Average Adjusted Gross Income (AGI) in 2004: $39,189 (Individual Income Tax Returns)
Here:
$39,189
State:
$56,704
Salary/wage: $35,918 (reported on 81.6% of returns)
Here:
$35,918
State:
$48,441
(% of AGI for various income ranges: 80.0% for AGIs below $10k, 70.2% for AGIs $10k-25k, 80.6% for AGIs $25k-50k, 74.1% for AGIs $50k-75k, 85.8% for AGIs $75k-100k, 65.0% for AGIs over 100k)
Taxable interest for individuals: $1,354 (reported on 45.0% of returns)
This zip code:
$1,354
Virginia:
$1,688
(% of AGI for various income ranges: 5.2% for AGIs below $10k, 2.4% for AGIs $10k-25k, 1.1% for AGIs $25k-50k, 1.8% for AGIs $50k-75k, 0.4% for AGIs $75k-100k, 1.7% for AGIs over 100k)
Taxable dividends: $1,757 (reported on 23.6% of returns)
Here:
$1,757
State:
$4,028
(% of AGI for various income ranges: 5.0% for AGIs below $10k, 0.8% for AGIs $10k-25k, 0.8% for AGIs $25k-50k, 1.5% for AGIs $50k-75k, 1.0% for AGIs $75k-100k, 0.7% for AGIs over 100k)
Net capital gain/loss: +$6,478 (reported on 15.1% of returns)
Here:
+$6,478
State:
+$14,375
(% of AGI for various income ranges: 1.9% for AGIs $10k-25k, -0.0% for AGIs $25k-50k, 1.9% for AGIs $50k-75k, -0.2% for AGIs $75k-100k, 7.8% for AGIs over 100k)
Profit/loss from business: +$10,746 (reported on 19.4% of returns)
Here:
+$10,746
State:
+$13,342
(% of AGI for various income ranges: 20.0% for AGIs below $10k, 9.0% for AGIs $10k-25k, 10.4% for AGIs $25k-50k, 4.1% for AGIs $50k-75k, 2.8% for AGIs $75k-100k)
IRA payment deduction: $2,889 (reported on 3.0% of returns)
22938:
$2,889
Virginia:
$2,943
Total itemized deductions: $15,165 (21% of AGI, reported on 29.9% of returns)
Here:
$15,165
State:
$21,492
Here:
21.2% of AGI
State:
21.0% of AGI
(% of AGI for various income ranges: 7.0% for AGIs $10k-25k, 9.4% for AGIs $25k-50k, 15.9% for AGIs $50k-75k, 14.0% for AGIs $75k-100k, 10.9% for AGIs over 100k)
Charity contributions deductions: $2,451 (3% of AGI, reported on 23.6% of returns)
Here:
$2,451
State:
$3,794
Here:
3.2% of AGI
State:
3.5% of AGI
(% of AGI for various income ranges: 3.5% for AGIs below $10k, 0.8% for AGIs $25k-50k, 2.5% for AGIs $50k-75k, 1.4% for AGIs $75k-100k, 1.6% for AGIs over 100k)
Total tax: $5,060 (reported on 79.5% of returns)
22938:
$5,060
State:
$9,537
(% of AGI for various income ranges: 4.2% for AGIs below $10k, 5.7% for AGIs $10k-25k, 8.0% for AGIs $25k-50k, 9.1% for AGIs $50k-75k, 11.5% for AGIs $75k-100k, 16.0% for AGIs over 100k)
Earned income credit: $1,437 (reported on 14.3% of returns)
Here:
$1,437
State:
$1,734
Percentage of individuals using paid preparers for their 2004 taxes: 54.5%
Here:
55%
State:
52%
(% for various income ranges: 48.7% for AGIs below $10k, 56.9% for AGIs $10k-25k, 50.7% for AGIs $25k-50k, 56.1% for AGIs $50k-75k, 72.5% for AGIs $75k-100k, 54.1% for AGIs over 100k)
Household received Food Stamps/SNAP in the past 12 months: 50 Household did not receive Food Stamps/SNAP in the past 12 months: 283
Women who did not have a birth in the past 12 months: 95 (39 now married, 56 unmarried)
Housing units in zip code 22938 with a mortgage: 201 (38 second mortgage, 7 home equity loan, 31 both second mortgage and home equity loan) Houses without a mortgage: 42
Median monthly owner costs for units with a mortgage: $1,943 Median monthly owner costs for units without a mortgage: $445
Residents with income below the poverty level in 2022:
This zip code:
7.3%
Whole state:
10.6%
Residents with income below 50% of the poverty level in 2022:
This zip code:
0.6%
Whole state:
5.2%
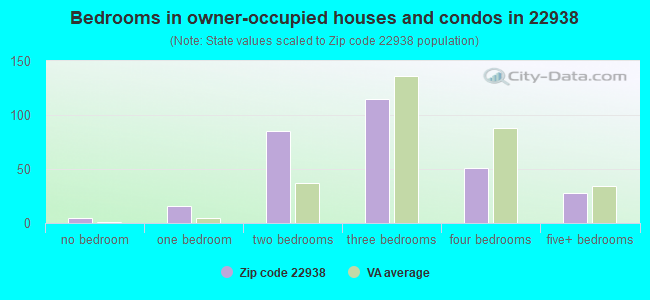
Median number of rooms in houses and condos:
Here:
6.7
State:
7.0
Notable locations in this zip code not listed on our city pages
Churches in zip code 22938 include: Adial Church (A), Rock Springs Church (B), Cedar Grove Church (C), Mount Eagle Church (D), Rockfish Church (E), Locust Grove Church (F), Mount Shiloh Church (G). Display/hide their locations on the map
Cemeteries: Rock Spring Cemetery (1), Mount Shiloh Cemetery (2), Locust Grove Cemetery (3), Cedar Grove Cemetery (4), Adial Cemetery (5). Display/hide their locations on the map
In group quarters: 10 (-1 institutionalized population)
Size of family households: 189 2-persons, 32 3-persons, 14 4-persons
Size of nonfamily households: 78 1-person, 7 2-persons, 8 3-persons
49 married couples with children.
27 single-parent households (27 women).
98.4% of residents of 22938 zip code speak English at home.
2.1% of residents speak Spanish at home (100% very well).
Foreign born population: 12 (1.8%) (0.0% of them are naturalized citizens)
:
1.8%
Whole state:
12.7%
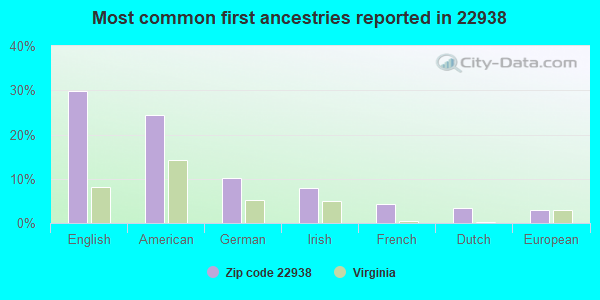
30%English
25%American
10%German
8%Irish
4%French
3%Dutch
3%European
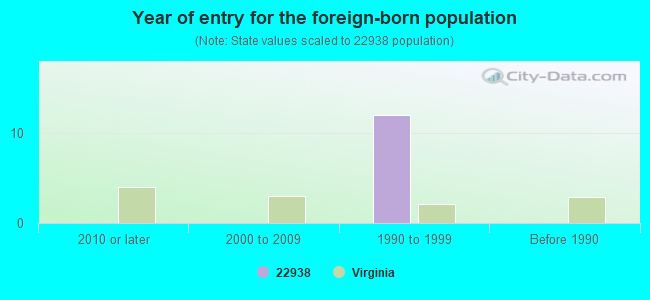
Year of entry for the foreign-born population
02010 or later
02000 to 2009
121990 to 1999
0Before 1990
Facilities with environmental interests located in this zip code:
BEVERLY DAVID ORCHARDS (ORCHARD LANE RD in FABER, VA)
(Integrated Compliance Information System) - ICIS-03-1988-0385, FORMAL ENFORCEMENT ACTION
Housing units lacking complete plumbing facilities: 5.9% Housing units lacking complete kitchen facilities: 7.0%
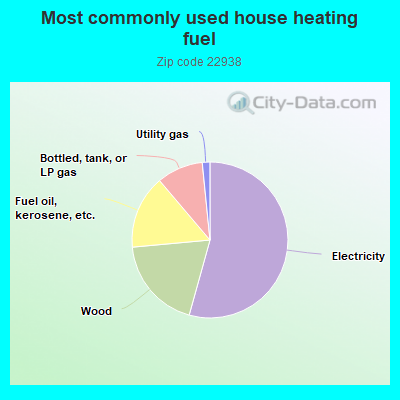
54.8%Electricity
19.4%Wood
15.4%Fuel oil, kerosene, etc.
9.7%Bottled, tank, or LP gas
1.6%Utility gas
Population in 1990: 958. Population change in the 1990s: +373 (+38.9%).
Place of birth for U.S.-born residents:
This state: 326
Northeast: 122
Midwest: 78
South: 113
West: 23
78% of the 22938 zip code residents lived in the same house 5 years ago. Out of people who lived in different houses, 54% lived in this county. Out of people who lived in different counties, 50% lived in Virginia.
99% of the 22938 zip code residents lived in the same house 1 year ago. Out of people who lived in different houses, 167% moved from different county within same state.
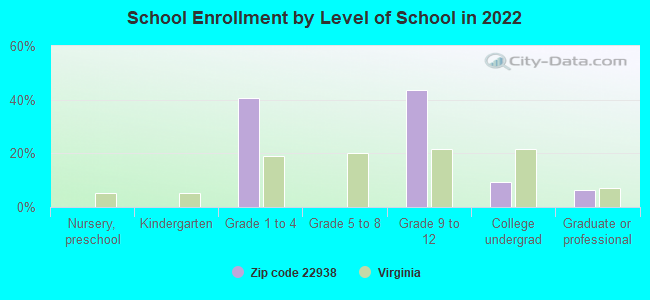
Private vs. public school enrollment:
Students in private schools in grades 1 to 8 (elementary and middle school):
Here:
0.0%
Virginia:
13.2%
Students in private schools in grades 9 to 12 (high school):
Here:
0.0%
Virginia:
10.2%
Students in private undergraduate colleges:
Here:
0.0%
Virginia:
18.7%
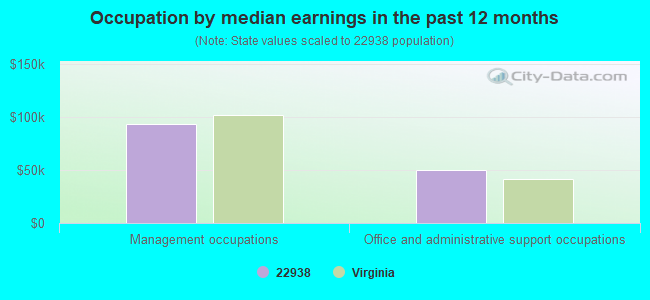
Occupation by median earnings in the past 12 months ($)
92,847Management occupations
50,217Office and administrative support occupations
Companies with federal contracts located in this zip code:
INTUITIVE INTELLIGENCE APPLICA (1530 ROBERTS MOUNTAIN RD in FABER, VA; small business)
$11,000 with Department of Defense for Educational Services. Signed on 2004-11-16. Completion date: 2004-11-16.
Top industries in this zip code by the number of employees in 2005:
Administrative and Support and Waste Management and Remediation Services: Landscaping Services (20-49 employees: 1 establishment, 10-19 employees: 1 establishment)
Professional, Scientific, and Technical Services: Research and Development in the Social Sciences and Humanities (20-49: 1)
Real Estate and Rental and Leasing: Video Tape and Disc Rental (10-19: 1)
Construction: New Single-Family Housing Construction (except Operative Builders) (5-9: 1, 1-4: 2)
Other Services (except Public Administration): Pet Care (except Veterinary) Services (5-9: 1)
Accommodation and Food Services: Bed-and-Breakfast Inns (1-4: 1)
Construction: Plumbing, Heating, and Air-Conditioning Contractors (1-4: 1)
People in group quarters in 2000:
80 people in other noninstitutional group quarters
8 people in religious group quarters
Fatal accident statistics in 2013:
Fatal accident count: 1
Vehicles involved in fatal accidents: 1
Fatal accidents caused by drunken drivers: 1
Fatalities: 1
Persons involved in fatal accidents: 1
Pedestrians involved in fatal accidents: 0
Fatal accident statistics in 2011:
Fatal accident count: 1
Vehicles involved in fatal accidents: 1
Fatal accidents caused by drunken drivers: 0
Fatalities: 1
Persons involved in fatal accidents: 2
Pedestrians involved in fatal accidents: 0
2004 - 2018 National Fire Incident Reporting System (NFIRS) incidents
According to the data from the years 2004 - 2018 the average number of fires per year is 12. The highest number of fire incidents - 22 took place in 2007, and the least - 2 in 2017. The data has a rising trend.
When looking into fire subcategories, the most reports belonged to: Outside Fires (47.2%), and Structure Fires (35.0%).
Fire incident types reported to NFIRS in Zip Code 22938


 Nearest zip codes: 22931, 22920, 22958, 22949, 22971, 22969.


 According to the data from the years 2004 - 2018 the average number of fires per year is 12. The highest number of fire incidents - 22 took place in 2007, and the least - 2 in 2017. The data has a rising trend.
 When looking into fire subcategories, the most reports belonged to: Outside Fires (47.2%), and Structure Fires (35.0%).