Estimated zip code population in 2022: 6,651 Zip code population in 2010: 5,175 Zip code population in 2000: 3,385
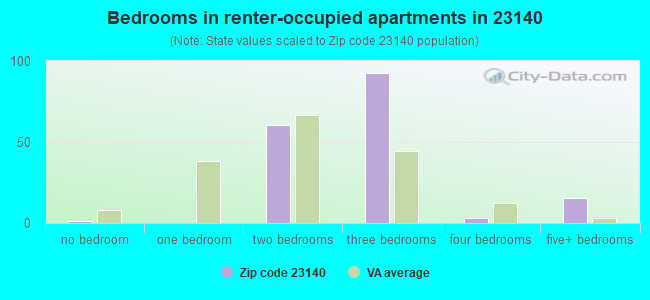
Houses and condos: 2,769 Renter-occupied apartments: 174
% of renters here:
7%
State:
33%
March 2022 cost of living index in zip code 23140: 85.4 (less than average, U.S. average is 100)
Land area: 74.9 sq. mi. Water area: 0.6 sq. mi.
Population density: 89 people per square mile
(very low).
OSM Map
General Map
Google Map
MSN Map
OSM Map
General Map
Google Map
MSN Map
OSM Map
General Map
Google Map
MSN Map
OSM Map
General Map
Google Map
MSN Map
Please wait while loading the map...
Real estate property taxes paid for housing units in 2022:
This zip code:
0.6% ($1,953)
Virginia:
0.7% ($2,617)
Median real estate property taxes paid for housing units with mortgages in 2022: $2,162 (0.6%) Median real estate property taxes paid for housing units with no mortgage in 2022: $1,595 (0.7%)
Business Search- 14 Million verified businesses
Males: 3,427
(51.5%)
Females: 3,224
(48.5%)
For population 25 years and over in 23140:
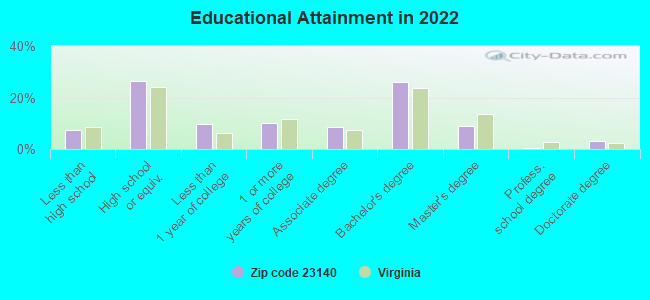
High school or higher: 92.6%
Bachelor's degree or higher: 38.3%
Graduate or professional degree: 12.3%
Unemployed: 3.1%
Mean travel time to work (commute): 33.9 minutes
For population 15 years and over in 23140:
Never married: 23.3%
Now married: 63.3%
Separated: 1.3%
Widowed: 5.2%
Divorced: 6.8%
Zip code 23140 compared to state average:
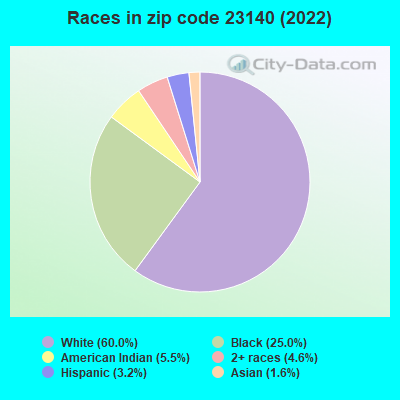
Hispanic race population percentage significantly below state average.
Median age significantly above state average.
Foreign-born population percentage significantly below state average.
Renting percentage significantly below state average.
Length of stay since moving in significantly above state average.
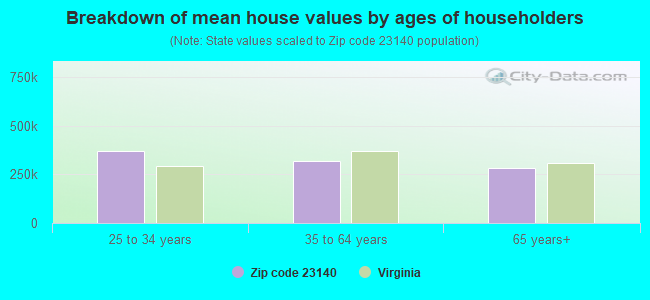
Estimated median house/condo value in 2022: $347,727
23140:
$347,727
Virginia:
$365,700
According to our research of Virginia and other state lists, there were 12 registered sex offenders living in 23140 zip code as of April 24, 2024. The ratio of all residents to sex offenders in zip code 23140 is 511 to 1. The ratio of registered sex offenders to all residents in this zip code is lower than the state average.
Median resident age:
This zip code:
48.5 years
Virginia median age:
39.0 years
Average household size:
This zip code:
2.5 people
Virginia:
2.5 people
Averages for the 2020 tax year for zip code 23140, filed in 2021:
Average Adjusted Gross Income (AGI) in 2020: $86,787 (Individual Income Tax Returns)
Here:
$86,787
State:
$86,446
Salary/wage: $68,902 (reported on 82.2% of returns)
Here:
$68,902
State:
$71,185
(% of AGI for various income ranges: 1066.1% for AGIs below $25k, 3384.3% for AGIs $25k-50k, 6320.3% for AGIs $50k-75k, 9223.2% for AGIs $75k-100k, 18306.3% for AGIs $100k-200k, 58621.4% for AGIs over 200k)
Taxable interest for individuals: $1,042 (reported on 34.2% of returns)
This zip code:
$1,042
Virginia:
$1,805
(% of AGI for various income ranges: 12.9% for AGIs below $25k, 14.0% for AGIs $25k-50k, 33.8% for AGIs $50k-75k, 65.3% for AGIs $75k-100k, 67.6% for AGIs $100k-200k, 641.4% for AGIs over 200k)
Ordinary dividends: $5,305 (reported on 21.7% of returns)
Here:
$5,305
State:
$8,327
(% of AGI for various income ranges: 10.4% for AGIs below $25k, 39.2% for AGIs $25k-50k, 98.1% for AGIs $50k-75k, 196.8% for AGIs $75k-100k, 346.8% for AGIs $100k-200k, 1755.7% for AGIs over 200k)
Net capital gain/loss in AGI: +$11,712 (reported on 18.8% of returns)
Here:
+$11,712
State:
+$24,644
(% of AGI for various income ranges: 13.8% for AGIs below $25k, 27.0% for AGIs $25k-50k, 64.7% for AGIs $50k-75k, 113.7% for AGIs $75k-100k, 672.6% for AGIs $100k-200k, 4967.1% for AGIs over 200k)
Profit/loss from business: +$6,315 (reported on 15.5% of returns)
Here:
+$6,315
State:
+$12,836
(% of AGI for various income ranges: 63.9% for AGIs below $25k, 24.7% for AGIs $25k-50k, 110.3% for AGIs $50k-75k, 125.8% for AGIs $75k-100k, 291.3% for AGIs $100k-200k, 1114.3% for AGIs over 200k)
Taxable individual retirement arrangement distribution: $22,692 (reported on 12.8% of returns)
23140:
$22,692
Virginia:
$21,535
(% of AGI for various income ranges: 53.2% for AGIs below $25k, 117.9% for AGIs $25k-50k, 296.9% for AGIs $50k-75k, 532.1% for AGIs $75k-100k, 917.9% for AGIs $100k-200k, 3540.0% for AGIs over 200k)
Total itemized deductions: $29,809 (reported on 15.1% of returns)
Here:
$29,809
State:
$33,287
(% of AGI for various income ranges: 210.0% for AGIs $25k-50k, 394.4% for AGIs $50k-75k, 756.8% for AGIs $75k-100k, 1404.2% for AGIs $100k-200k, 6518.6% for AGIs over 200k)
Charity contributions: $8,946 (reported on 12.8% of returns)
Here:
$8,946
State:
$10,381
(% of AGI for various income ranges: 35.1% for AGIs $25k-50k, 70.3% for AGIs $50k-75k, 150.0% for AGIs $75k-100k, 315.0% for AGIs $100k-200k, 2280.0% for AGIs over 200k)
Taxes paid: $7,757 (reported on 15.1% of returns)
23140:
$7,757
State:
$8,284
(% of AGI for various income ranges: 36.8% for AGIs $25k-50k, 96.2% for AGIs $50k-75k, 197.9% for AGIs $75k-100k, 423.2% for AGIs $100k-200k, 1544.3% for AGIs over 200k)
Earned income credit: $1,996 (reported on 9.2% of returns)
Here:
$1,996
State:
$2,214
(% of AGI for various income ranges: 58.6% for AGIs below $25k, 43.6% for AGIs $25k-50k)
Percentage of individuals using paid preparers for their 2020 taxes: 89.5%
Here:
89%
State:
92%
(% for various income ranges: 87.5% for AGIs below $25k, 89.4% for AGIs $25k-50k, 88.9% for AGIs $50k-75k, 90.0% for AGIs $75k-100k, 90.0% for AGIs $100k-200k, 95.2% for AGIs over 200k)
Averages for the 2012 tax year for zip code 23140, filed in 2013:
Average Adjusted Gross Income (AGI) in 2012: $69,822 (Individual Income Tax Returns)
Here:
$69,822
State:
$71,192
Salary/wage: $59,192 (reported on 85.2% of returns)
Here:
$59,192
State:
$59,229
(% of AGI for various income ranges: 74.2% for AGIs below $25k, 78.4% for AGIs $25k-50k, 76.1% for AGIs $50k-75k, 70.8% for AGIs $75k-100k, 74.5% for AGIs $100k-200k, 63.4% for AGIs over 200k)
Taxable interest for individuals: $1,206 (reported on 40.2% of returns)
This zip code:
$1,206
Virginia:
$1,600
(% of AGI for various income ranges: 0.8% for AGIs below $25k, 0.6% for AGIs $25k-50k, 0.4% for AGIs $50k-75k, 0.3% for AGIs $75k-100k, 0.8% for AGIs $100k-200k, 1.0% for AGIs over 200k)
Ordinary dividends: $4,295 (reported on 23.1% of returns)
Here:
$4,295
State:
$6,959
(% of AGI for various income ranges: 1.1% for AGIs below $25k, 1.6% for AGIs $25k-50k, 0.8% for AGIs $50k-75k, 1.2% for AGIs $75k-100k, 1.5% for AGIs $100k-200k, 1.8% for AGIs over 200k)
Net capital gain/loss in AGI: +$6,225 (reported on 18.2% of returns)
Here:
+$6,225
State:
+$16,672
(% of AGI for various income ranges: 0.6% for AGIs $25k-50k, 0.8% for AGIs $50k-75k, 0.5% for AGIs $75k-100k, 0.8% for AGIs $100k-200k, 5.1% for AGIs over 200k)
Profit/loss from business: +$8,200 (reported on 14.4% of returns)
Here:
+$8,200
State:
+$14,116
(% of AGI for various income ranges: 4.7% for AGIs below $25k, 1.7% for AGIs $25k-50k, 0.2% for AGIs $50k-75k, 1.2% for AGIs $75k-100k, 2.2% for AGIs $100k-200k, 1.5% for AGIs over 200k)
Taxable individual retirement arrangement distribution: $18,476 (reported on 12.9% of returns)
23140:
$18,476
Virginia:
$16,667
(% of AGI for various income ranges: 2.4% for AGIs below $25k, 2.3% for AGIs $25k-50k, 4.2% for AGIs $50k-75k, 5.3% for AGIs $75k-100k, 4.9% for AGIs $100k-200k)
Self-employment retirement plans: $13,650 (reported on 0.8% of returns)
23140:
$13,650
Virginia:
$25,373
Total itemized deductions: $23,968 (22% of AGI, reported on 47.0% of returns)
Here:
$23,968
State:
$26,596
Here:
21.5% of AGI
State:
20.1% of AGI
(% of AGI for various income ranges: 13.3% for AGIs below $25k, 12.8% for AGIs $25k-50k, 16.0% for AGIs $50k-75k, 18.0% for AGIs $75k-100k, 18.5% for AGIs $100k-200k, 13.7% for AGIs over 200k)
Charity contributions: $4,040 (reported on 38.6% of returns)
Here:
$4,040
State:
$4,443
(% of AGI for various income ranges: 1.0% for AGIs below $25k, 1.4% for AGIs $25k-50k, 2.3% for AGIs $50k-75k, 2.1% for AGIs $75k-100k, 2.3% for AGIs $100k-200k, 2.9% for AGIs over 200k)
Taxes paid: $7,961 (reported on 47.0% of returns)
23140:
$7,961
State:
$9,951
(% of AGI for various income ranges: 1.8% for AGIs below $25k, 2.9% for AGIs $25k-50k, 4.2% for AGIs $50k-75k, 5.1% for AGIs $75k-100k, 6.5% for AGIs $100k-200k, 6.6% for AGIs over 200k)
Earned income credit: $1,976 (reported on 12.9% of returns)
Here:
$1,976
State:
$2,211
(% of AGI for various income ranges: 4.8% for AGIs below $25k, 1.0% for AGIs $25k-50k)
Percentage of individuals using paid preparers for their 2012 taxes: 46.2%
Here:
46%
State:
46%
(% for various income ranges: 40.7% for AGIs below $25k, 44.4% for AGIs $25k-50k, 46.5% for AGIs $50k-75k, 48.3% for AGIs $75k-100k, 52.2% for AGIs $100k-200k, 63.6% for AGIs over 200k)
Averages for the 2004 tax year for zip code 23140, filed in 2005:
Average Adjusted Gross Income (AGI) in 2004: $49,784 (Individual Income Tax Returns)
Here:
$49,784
State:
$56,704
Salary/wage: $44,626 (reported on 88.6% of returns)
Here:
$44,626
State:
$48,441
(% of AGI for various income ranges: 105.5% for AGIs below $10k, 77.6% for AGIs $10k-25k, 83.9% for AGIs $25k-50k, 82.4% for AGIs $50k-75k, 77.3% for AGIs $75k-100k, 76.4% for AGIs over 100k)
Taxable interest for individuals: $927 (reported on 43.8% of returns)
This zip code:
$927
Virginia:
$1,688
(% of AGI for various income ranges: 1.7% for AGIs below $10k, 0.9% for AGIs $10k-25k, 0.5% for AGIs $25k-50k, 0.5% for AGIs $50k-75k, 0.8% for AGIs $75k-100k, 1.0% for AGIs over 100k)
Taxable dividends: $2,211 (reported on 22.9% of returns)
Here:
$2,211
State:
$4,028
(% of AGI for various income ranges: 0.5% for AGIs below $10k, 0.7% for AGIs $10k-25k, 0.7% for AGIs $25k-50k, 0.8% for AGIs $50k-75k, 1.2% for AGIs $75k-100k, 1.3% for AGIs over 100k)
Net capital gain/loss: +$8,639 (reported on 15.6% of returns)
Here:
+$8,639
State:
+$14,375
(% of AGI for various income ranges: 0.1% for AGIs $10k-25k, 0.6% for AGIs $25k-50k, 1.0% for AGIs $50k-75k, 1.0% for AGIs $75k-100k, 5.6% for AGIs over 100k)
Profit/loss from business: +$7,536 (reported on 13.8% of returns)
Here:
+$7,536
State:
+$13,342
(% of AGI for various income ranges: 6.4% for AGIs below $10k, 4.5% for AGIs $10k-25k, 3.3% for AGIs $25k-50k, 0.3% for AGIs $50k-75k, 3.1% for AGIs $75k-100k, 1.3% for AGIs over 100k)
Profit/loss from farming: +$1,562 (reported on 0.8% of returns)
Here:
+$1,562
State:
-$5,267
IRA payment deduction: $3,438 (reported on 1.7% of returns)
23140:
$3,438
Virginia:
$2,943
Total itemized deductions: $18,120 (21% of AGI, reported on 40.4% of returns)
Here:
$18,120
State:
$21,492
Here:
21.1% of AGI
State:
21.0% of AGI
(% of AGI for various income ranges: 24.9% for AGIs below $10k, 9.0% for AGIs $10k-25k, 12.8% for AGIs $25k-50k, 17.4% for AGIs $50k-75k, 17.6% for AGIs $75k-100k, 14.2% for AGIs over 100k)
Charity contributions deductions: $3,240 (4% of AGI, reported on 36.6% of returns)
Here:
$3,240
State:
$3,794
Here:
3.6% of AGI
State:
3.5% of AGI
(% of AGI for various income ranges: 1.0% for AGIs below $10k, 1.5% for AGIs $10k-25k, 2.2% for AGIs $25k-50k, 3.0% for AGIs $50k-75k, 3.0% for AGIs $75k-100k, 2.2% for AGIs over 100k)
Total tax: $7,351 (reported on 78.7% of returns)
23140:
$7,351
State:
$9,537
(% of AGI for various income ranges: 2.9% for AGIs below $10k, 3.9% for AGIs $10k-25k, 7.1% for AGIs $25k-50k, 8.7% for AGIs $50k-75k, 10.3% for AGIs $75k-100k, 17.3% for AGIs over 100k)
Earned income credit: $1,665 (reported on 14.0% of returns)
Here:
$1,665
State:
$1,734
Percentage of individuals using paid preparers for their 2004 taxes: 54.2%
Here:
54%
State:
52%
(% for various income ranges: 44.3% for AGIs below $10k, 57.2% for AGIs $10k-25k, 52.3% for AGIs $25k-50k, 57.4% for AGIs $50k-75k, 56.1% for AGIs $75k-100k, 61.4% for AGIs over 100k)
Likely homosexual households (counted as self-reported same-sex unmarried-partner households)
Lesbian couples: 0.0% of all households
Gay men: 0.1% of all households
Household received Food Stamps/SNAP in the past 12 months: 166 Household did not receive Food Stamps/SNAP in the past 12 months: 2,427
Women who had a birth in the past 12 months: 90 (83 now married, 8 unmarried) Women who did not have a birth in the past 12 months: 1,252 (648 now married, 599 unmarried)
Housing units in zip code 23140 with a mortgage: 1,623 (118 second mortgage, 108 both second mortgage and home equity loan) Houses without a mortgage: 40
Median monthly owner costs for units with a mortgage: $1,932 Median monthly owner costs for units without a mortgage: $382
Residents with income below the poverty level in 2022:
This zip code:
5.3%
Whole state:
10.6%
Residents with income below 50% of the poverty level in 2022:
This zip code:
2.0%
Whole state:
5.2%
Median number of rooms in houses and condos:
Here:
7.4
State:
7.0
Median number of rooms in apartments:
Here:
5.8
State:
4.3
Notable locations in this zip code not listed on our city pages
Notable locations in zip code 23140: Charles City Landfill (A), Windsor Shades (B), Adkins Store (C), Cypress Bank Landing (D), Holly Landing (E), Oldhouse Landing (F), Winns Landing (G), Golf Club at Brickshire (H), Tradition Golf Club at Royal New Kent (I), Chickahominy Wastewater Treatment Plant (J), Providence Forge Firefighters (K), Providence Forge Volunteer Rescue Squad (L), New Kent Fire - Rescue Station 1 / Providence Forge Volunteer Fire - Rescue (M), Evans Evergreen Nursery (N), Heritage Public Library (O). Display/hide their locations on the map
Churches in zip code 23140 include: The Fellowship Church (A), Emmaus Church (B), Tsena Commoko Church (C), Cedar Grove Church (D), Mount Calvary Church (E), Mount Stirling Church (F), Mount Pleasant Church (G), Olivet Church (H), Providence Forge Presbyterian Church (I). Display/hide their locations on the map
Streams, rivers, and creeks: Stony Run (A), Potato Run (B), Possum Run (C), Dockman Swamp (D), Collins Run (E), Bradley Run (F), Toe Ink Swamp (G), Schiminoe Creek (H), Rumley Marsh (I). Display/hide their locations on the map
980 married couples with children.
182 single-parent households (76 men, 106 women).
95.2% of residents of 23140 zip code speak English at home.
2.3% of residents speak Spanish at home (61% very well, 5% well, 32% not well, 1% not at all).
0.5% of residents speak other Indo-European language at home (91% very well, 6% well, 3% not well).
0.5% of residents speak Asian or Pacific Island language at home (62% very well, 3% well, 34% not well).
1.1% of residents speak other language at home (84% very well, 16% not well).
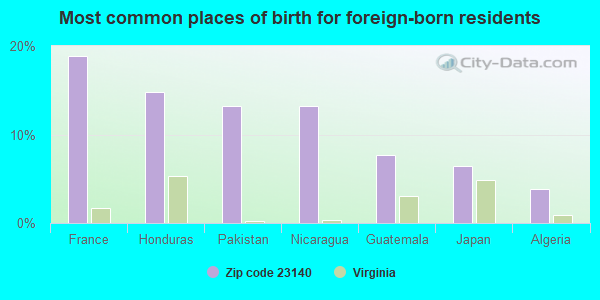
Foreign born population: 329 (5.0%) (30.0% of them are naturalized citizens)
This zip code:
5.0%
Whole state:
12.7%
19%France
15%Honduras
13%Pakistan
13%Nicaragua
8%Guatemala
6%Japan
4%Algeria
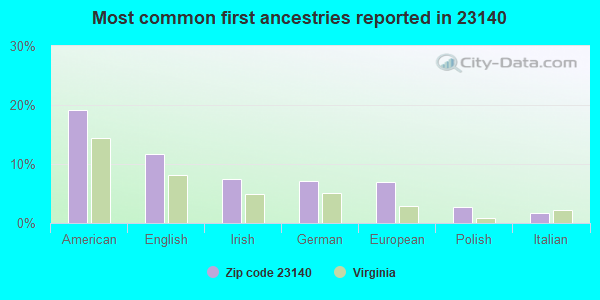
19%American
12%English
7%Irish
7%German
7%European
3%Polish
2%Italian
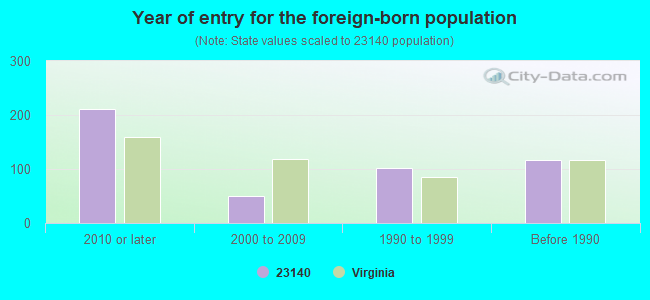
Year of entry for the foreign-born population
2122010 or later
502000 to 2009
1011990 to 1999
116Before 1990
Facilities with environmental interests located in this zip code:
BORDEN CHEMICAL SMITH-DOU (PO BOX 96 in PROVIDENCE FORGE, VA)
CHESAPEAKE & POTOMAC TELEPHONE CO (ST HWY 155 NEAR US RT 60 in PROVIDENCE FORGE, VA)
(Resource Conservation and Recovery Act (tracking hazardous waste)) Organizations: CHESAPEAKE & POTOMAC TELEPHONE COMPANY (CONTACT/OPERATOR)
CHUCKS PETRO (RTE 60 WILLIAMSBURG RD in PROVIDENCE FORGE, VA)
Conditionally Exempt Small Quantity Generators, less than 100 kg/month of hazardous waste (Resource Conservation and Recovery Act (tracking hazardous waste)) - notification Organizations: OPERNAME (CONTACT/OPERATOR)
, YLONEN CHARLES S (CONTACT/OWNER)
CHEMICAL CARRIER CORP OF VIRGINIA (ROUTE 600 & 609 in ROXBURY, VA)
TSD (Resource Conservation and Recovery Act (tracking hazardous waste))
Housing units lacking complete plumbing facilities: 0.8% Housing units lacking complete kitchen facilities: 0.9%
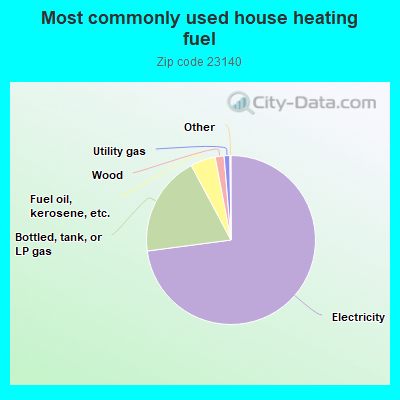
73.0%Electricity
19.3%Bottled, tank, or LP gas
4.8%Fuel oil, kerosene, etc.
1.7%Wood
1.1%Utility gas
Population in 1990: 3,211. Population change in the 1990s: +174 (+5.4%).
Place of birth for U.S.-born residents:
This state: 4,195
Northeast: 733
Midwest: 291
South: 768
West: 168
71% of the 23140 zip code residents lived in the same house 5 years ago. Out of people who lived in different houses, 31% lived in this county. Out of people who lived in different counties, 50% lived in Virginia.
94% of the 23140 zip code residents lived in the same house 1 year ago. Out of people who lived in different houses, 12% moved from this county. Out of people who lived in different houses, 81% moved from different county within same state. Out of people who lived in different houses, 14% moved from different state. Out of people who lived in different houses, 1% moved from abroad.
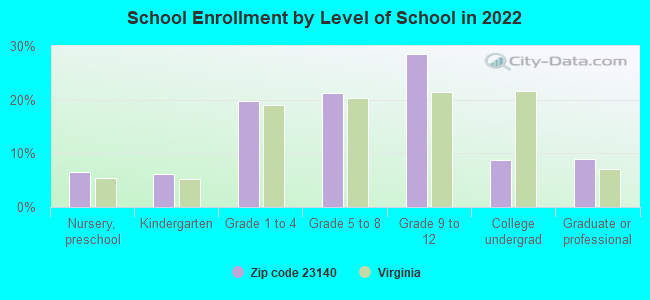
Private vs. public school enrollment:
Students in private schools in grades 1 to 8 (elementary and middle school): 27
Here:
4.6%
Virginia:
13.2%
Students in private schools in grades 9 to 12 (high school): 90
Here:
21.3%
Virginia:
10.2%
Students in private undergraduate colleges: 12
Here:
9.8%
Virginia:
18.7%
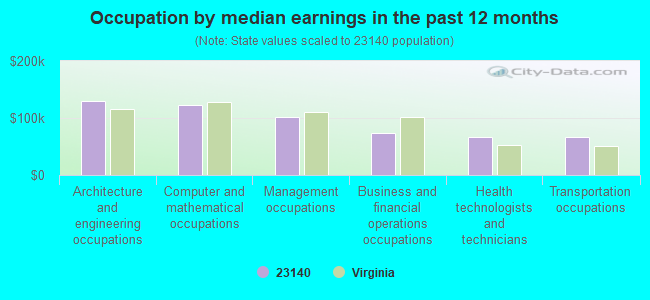
Occupation by median earnings in the past 12 months ($)
129,087Architecture and engineering occupations
123,227Computer and mathematical occupations
101,606Management occupations
73,610Business and financial operations occupations
67,436Health technologists and technicians
66,820Transportation occupations
Companies with federal contracts located in this zip code:
VIRGINIA RECYCLING CORP (4301 S MOUNTCASTLE in PROVIDENCE FOR, VA; small business) : $504,571 in 20 contractsfrom 1999 to 2005
Contracts for Other Housekeeping Services, Food Items For Resale, Other Utilities by Army Signed by year:2000: $0; 2001: $11,292; 2002: $301,369; 2003: $71,023; 2004: $47,530; 2005: $47,530; 2006: $0.
Biggest contracts:
$252,821 with Army for Other Housekeeping Services. Signed on 2002-07-02. Completion date: 2001-09-30.
$47,530, same as above.Signed on 2005-10-31. Completion date: 2007-09-30.
$47,530, same as above.Signed on 2004-11-02. Completion date: 2007-09-30.
$35,530, same as above.Signed on 2003-12-09. Completion date: 2007-09-30.
Top industries in this zip code by the number of employees in 2005:
Other Services (except Public Administration): Religious Organizations (5-9: 4, 1-4: 3)
Health Care and Social Assistance: Home Health Care Services (20-49: 1)
Construction: Water and Sewer Line and Related Structures Construction (20-49: 1)
Fatal accident statistics in 2014:
Fatal accident count: 2
Vehicles involved in fatal accidents: 5
Fatal accidents caused by drunken drivers: 0
Fatalities: 4
Persons involved in fatal accidents: 8
Pedestrians involved in fatal accidents: 0
Fatal accident statistics in 2013:
Fatal accident count: 1
Vehicles involved in fatal accidents: 1
Fatal accidents caused by drunken drivers: 0
Fatalities: 1
Persons involved in fatal accidents: 1
Pedestrians involved in fatal accidents: 1
2003 - 2018 National Fire Incident Reporting System (NFIRS) incidents
According to the data from the years 2003 - 2018 the average number of fires per year is 15. The highest number of fire incidents - 29 took place in 2010, and the least - 1 in 2007. The data has a growing trend.
When looking into fire subcategories, the most incidents belonged to: Outside Fires (43.9%), and Structure Fires (26.0%).
Fire incident types reported to NFIRS in Zip Code 23140


+$1,562
-$5,267
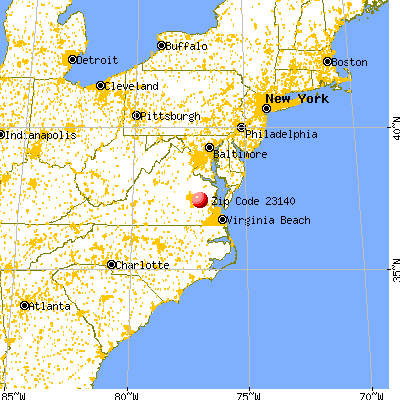
 Nearest zip codes: 23030, 23124, 23089, 23141, 23899, 23168.


 According to the data from the years 2003 - 2018 the average number of fires per year is 15. The highest number of fire incidents - 29 took place in 2010, and the least - 1 in 2007. The data has a growing trend.
 When looking into fire subcategories, the most incidents belonged to: Outside Fires (43.9%), and Structure Fires (26.0%).