Estimated zip code population in 2022: 4,892 Zip code population in 2010: 5,012 Zip code population in 2000: 5,012
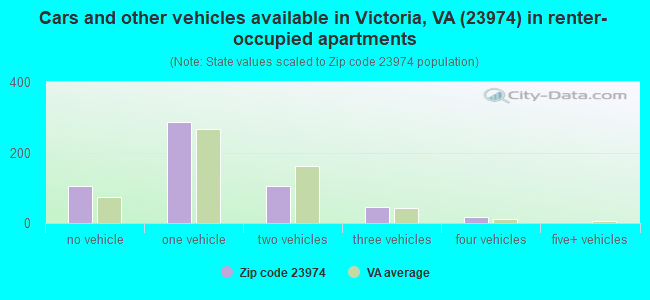
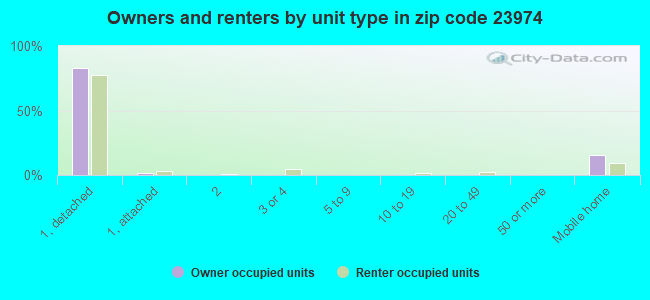
Houses and condos: 2,139 Renter-occupied apartments: 557
% of renters here:
33%
State:
33%
March 2022 cost of living index in zip code 23974: 84.0 (less than average, U.S. average is 100)
Land area: 98.3 sq. mi. Water area: 0.2 sq. mi.
Population density: 50 people per square mile
(very low).
OSM Map
General Map
Google Map
MSN Map
OSM Map
General Map
Google Map
MSN Map
OSM Map
General Map
Google Map
MSN Map
OSM Map
General Map
Google Map
MSN Map
Please wait while loading the map...
Real estate property taxes paid for housing units in 2022:
This zip code:
0.4% ($565)
Virginia:
0.7% ($2,617)
Median real estate property taxes paid for housing units with mortgages in 2022: $585 (0.4%) Median real estate property taxes paid for housing units with no mortgage in 2022: $562 (0.4%)
Business Search- 14 Million verified businesses
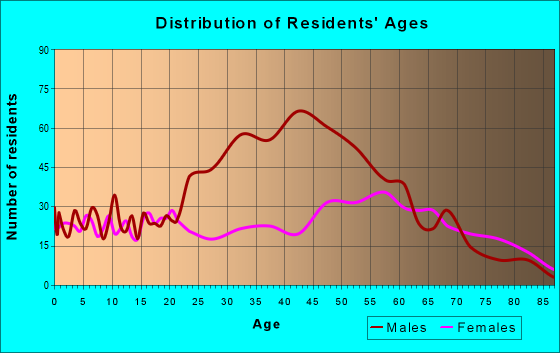
Males: 2,829
(57.8%)
Females: 2,063
(42.2%)
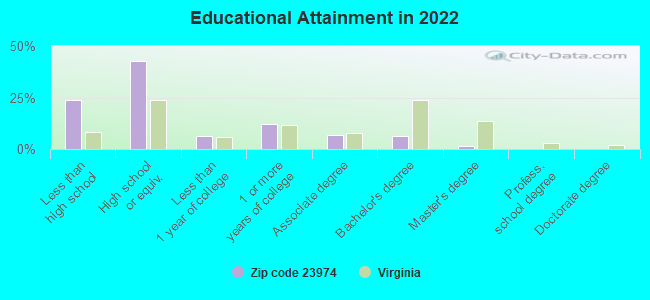
For population 25 years and over in 23974:
High school or higher: 74.1%
Bachelor's degree or higher: 7.7%
Graduate or professional degree: 1.6%
Unemployed: 3.3%
Mean travel time to work (commute): 30.1 minutes
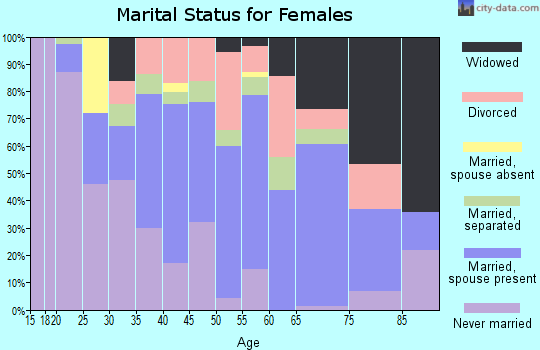
For population 15 years and over in 23974:
Never married: 30.7%
Now married: 47.2%
Separated: 3.4%
Widowed: 6.4%
Divorced: 12.2%
Zip code 23974 compared to state average:
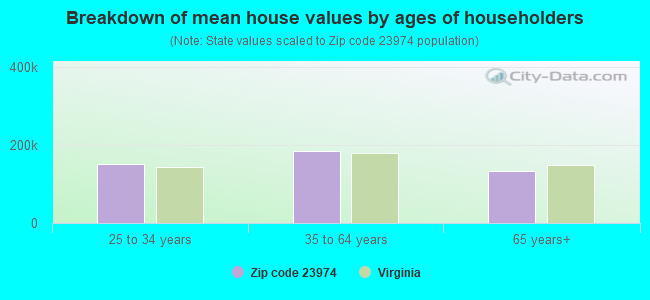
Median household income below state average.
Median house value significantly below state average.
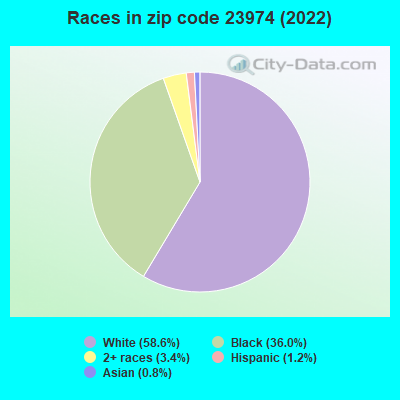
Black race population percentage above state average.
Hispanic race population percentage significantly below state average.
Median age above state average.
Foreign-born population percentage significantly below state average.
Length of stay since moving in significantly above state average.
House age above state average.
Number of college students below state average.
Percentage of population with a bachelor's degree or higher significantly below state average.
Averages for the 2020 tax year for zip code 23974, filed in 2021:
Average Adjusted Gross Income (AGI) in 2020: $44,208 (Individual Income Tax Returns)
Here:
$44,208
State:
$86,446
Salary/wage: $36,921 (reported on 80.7% of returns)
Here:
$36,921
State:
$71,185
(% of AGI for various income ranges: 1198.8% for AGIs below $25k, 3510.8% for AGIs $25k-50k, 6280.6% for AGIs $50k-75k, 9137.5% for AGIs $75k-100k, 18968.6% for AGIs $100k-200k)
Taxable interest for individuals: $863 (reported on 26.9% of returns)
This zip code:
$863
Virginia:
$1,805
(% of AGI for various income ranges: 9.4% for AGIs below $25k, 20.0% for AGIs $25k-50k, 72.4% for AGIs $50k-75k, 31.2% for AGIs $75k-100k, 177.1% for AGIs $100k-200k)
Ordinary dividends: $5,050 (reported on 10.5% of returns)
Here:
$5,050
State:
$8,327
(% of AGI for various income ranges: 6.8% for AGIs below $25k, 18.7% for AGIs $25k-50k, 128.2% for AGIs $50k-75k, 105.0% for AGIs $75k-100k, 714.3% for AGIs $100k-200k)
Net capital gain/loss in AGI: +$6,300 (reported on 8.2% of returns)
Here:
+$6,300
State:
+$24,644
(% of AGI for various income ranges: 62.9% for AGIs $50k-75k, 236.2% for AGIs $75k-100k, 850.0% for AGIs $100k-200k)
Profit/loss from business: +$6,468 (reported on 12.9% of returns)
Here:
+$6,468
State:
+$12,836
(% of AGI for various income ranges: 73.6% for AGIs below $25k, 57.4% for AGIs $25k-50k, 172.9% for AGIs $50k-75k, 468.8% for AGIs $75k-100k, 231.4% for AGIs $100k-200k)
Taxable individual retirement arrangement distribution: $15,308 (reported on 7.6% of returns)
23974:
$15,308
Virginia:
$21,535
(% of AGI for various income ranges: 38.4% for AGIs below $25k, 66.4% for AGIs $25k-50k, 89.4% for AGIs $50k-75k, 647.5% for AGIs $75k-100k, 1241.4% for AGIs $100k-200k)
Total itemized deductions: $26,700 (reported on 3.5% of returns)
Here:
$26,700
State:
$33,287
(% of AGI for various income ranges: 217.4% for AGIs $25k-50k, 942.5% for AGIs $75k-100k)
Charity contributions: $7,760 (reported on 2.9% of returns)
Here:
$7,760
State:
$10,381
(% of AGI for various income ranges: 228.2% for AGIs $50k-75k)
Taxes paid: $4,800 (reported on 3.5% of returns)
23974:
$4,800
State:
$8,284
(% of AGI for various income ranges: 33.1% for AGIs $25k-50k, 198.8% for AGIs $75k-100k)
Earned income credit: $2,381 (reported on 25.1% of returns)
Here:
$2,381
State:
$2,214
(% of AGI for various income ranges: 132.8% for AGIs below $25k, 92.3% for AGIs $25k-50k)
Percentage of individuals using paid preparers for their 2020 taxes: 90.6%
Here:
91%
State:
92%
(% for various income ranges: 88.1% for AGIs below $25k, 92.0% for AGIs $25k-50k, 92.3% for AGIs $50k-75k, 100.0% for AGIs $75k-100k, 86.7% for AGIs $100k-200k)
Averages for the 2012 tax year for zip code 23974, filed in 2013:
Average Adjusted Gross Income (AGI) in 2012: $36,634 (Individual Income Tax Returns)
Here:
$36,634
State:
$71,192
Salary/wage: $32,331 (reported on 83.2% of returns)
Here:
$32,331
State:
$59,229
(% of AGI for various income ranges: 77.5% for AGIs below $25k, 79.5% for AGIs $25k-50k, 73.4% for AGIs $50k-75k, 67.6% for AGIs $75k-100k, 66.5% for AGIs $100k-200k)
Taxable interest for individuals: $1,096 (reported on 30.4% of returns)
This zip code:
$1,096
Virginia:
$1,600
(% of AGI for various income ranges: 1.2% for AGIs below $25k, 0.7% for AGIs $25k-50k, 1.3% for AGIs $50k-75k, 1.2% for AGIs $75k-100k, 0.2% for AGIs $100k-200k)
Ordinary dividends: $3,295 (reported on 11.8% of returns)
Here:
$3,295
State:
$6,959
(% of AGI for various income ranges: 0.5% for AGIs below $25k, 0.8% for AGIs $25k-50k, 1.0% for AGIs $50k-75k, 2.0% for AGIs $75k-100k, 1.2% for AGIs $100k-200k)
Net capital gain/loss in AGI: +$4,975 (reported on 7.5% of returns)
Here:
+$4,975
State:
+$16,672
(% of AGI for various income ranges: 0.8% for AGIs $25k-50k, 4.4% for AGIs $100k-200k)
Profit/loss from business: +$4,605 (reported on 13.0% of returns)
Here:
+$4,605
State:
+$14,116
(% of AGI for various income ranges: 5.5% for AGIs below $25k, 0.7% for AGIs $25k-50k, 1.8% for AGIs $50k-75k, 1.3% for AGIs $75k-100k)
Taxable individual retirement arrangement distribution: $8,364 (reported on 8.7% of returns)
23974:
$8,364
Virginia:
$16,667
(% of AGI for various income ranges: 1.7% for AGIs below $25k, 2.0% for AGIs $25k-50k, 1.2% for AGIs $50k-75k, 5.3% for AGIs $75k-100k)
Total itemized deductions: $16,866 (26% of AGI, reported on 19.9% of returns)
Here:
$16,866
State:
$26,596
Here:
25.8% of AGI
State:
20.1% of AGI
(% of AGI for various income ranges: 4.2% for AGIs below $25k, 8.7% for AGIs $25k-50k, 10.7% for AGIs $50k-75k, 9.7% for AGIs $75k-100k, 11.6% for AGIs $100k-200k)
Charity contributions: $3,512 (reported on 14.9% of returns)
Here:
$3,512
State:
$4,443
(% of AGI for various income ranges: 1.6% for AGIs $25k-50k, 1.8% for AGIs $50k-75k, 1.6% for AGIs $75k-100k, 1.8% for AGIs $100k-200k)
Taxes paid: $4,343 (reported on 18.6% of returns)
23974:
$4,343
State:
$9,951
(% of AGI for various income ranges: 0.4% for AGIs below $25k, 1.4% for AGIs $25k-50k, 2.7% for AGIs $50k-75k, 2.5% for AGIs $75k-100k, 4.2% for AGIs $100k-200k)
Earned income credit: $2,151 (reported on 30.4% of returns)
Here:
$2,151
State:
$2,211
(% of AGI for various income ranges: 9.6% for AGIs below $25k, 1.1% for AGIs $25k-50k)
Percentage of individuals using paid preparers for their 2012 taxes: 59.6%
Here:
60%
State:
46%
(% for various income ranges: 56.0% for AGIs below $25k, 55.6% for AGIs $25k-50k, 71.4% for AGIs $50k-75k, 66.7% for AGIs $75k-100k, 75.0% for AGIs $100k-200k)
Averages for the 2004 tax year for zip code 23974, filed in 2005:
Average Adjusted Gross Income (AGI) in 2004: $29,835 (Individual Income Tax Returns)
Here:
$29,835
State:
$56,704
Salary/wage: $27,709 (reported on 86.5% of returns)
Here:
$27,709
State:
$48,441
(% of AGI for various income ranges: 116.3% for AGIs below $10k, 81.5% for AGIs $10k-25k, 80.6% for AGIs $25k-50k, 81.8% for AGIs $50k-75k, 85.4% for AGIs $75k-100k, 57.5% for AGIs over 100k)
Taxable interest for individuals: $1,375 (reported on 30.6% of returns)
This zip code:
$1,375
Virginia:
$1,688
(% of AGI for various income ranges: 3.6% for AGIs below $10k, 2.0% for AGIs $10k-25k, 1.4% for AGIs $25k-50k, 1.5% for AGIs $50k-75k, 0.7% for AGIs $75k-100k, 0.7% for AGIs over 100k)
Taxable dividends: $2,343 (reported on 15.0% of returns)
Here:
$2,343
State:
$4,028
(% of AGI for various income ranges: 0.9% for AGIs below $10k, 0.5% for AGIs $10k-25k, 0.9% for AGIs $25k-50k, 1.9% for AGIs $50k-75k, 0.5% for AGIs $75k-100k, 2.6% for AGIs over 100k)
Net capital gain/loss: +$5,994 (reported on 9.5% of returns)
Here:
+$5,994
State:
+$14,375
(% of AGI for various income ranges: -0.9% for AGIs below $10k, 0.5% for AGIs $10k-25k, 0.8% for AGIs $25k-50k, 0.8% for AGIs $50k-75k, 0.3% for AGIs $75k-100k, 13.2% for AGIs over 100k)
Profit/loss from business: +$5,244 (reported on 10.7% of returns)
Here:
+$5,244
State:
+$13,342
(% of AGI for various income ranges: 11.3% for AGIs below $10k, 2.3% for AGIs $10k-25k, 2.2% for AGIs $25k-50k, 0.8% for AGIs $50k-75k, 1.8% for AGIs $75k-100k)
IRA payment deduction: $2,333 (reported on 0.9% of returns)
23974:
$2,333
Virginia:
$2,943
Total itemized deductions: $14,511 (24% of AGI, reported on 16.8% of returns)
Here:
$14,511
State:
$21,492
Here:
24.3% of AGI
State:
21.0% of AGI
(% of AGI for various income ranges: 6.3% for AGIs $10k-25k, 5.9% for AGIs $25k-50k, 10.6% for AGIs $50k-75k, 11.5% for AGIs $75k-100k, 11.0% for AGIs over 100k)
Charity contributions deductions: $2,793 (5% of AGI, reported on 13.9% of returns)
Here:
$2,793
State:
$3,794
Here:
4.6% of AGI
State:
3.5% of AGI
(% of AGI for various income ranges: 1.0% for AGIs $10k-25k, 0.8% for AGIs $25k-50k, 1.9% for AGIs $50k-75k, 1.5% for AGIs $75k-100k, 2.3% for AGIs over 100k)
Total tax: $3,435 (reported on 67.3% of returns)
23974:
$3,435
State:
$9,537
(% of AGI for various income ranges: 2.4% for AGIs below $10k, 3.2% for AGIs $10k-25k, 6.4% for AGIs $25k-50k, 8.6% for AGIs $50k-75k, 10.2% for AGIs $75k-100k, 16.2% for AGIs over 100k)
Earned income credit: $1,827 (reported on 26.9% of returns)
Here:
$1,827
State:
$1,734
Percentage of individuals using paid preparers for their 2004 taxes: 66.0%
Here:
66%
State:
52%
(% for various income ranges: 62.7% for AGIs below $10k, 66.0% for AGIs $10k-25k, 66.1% for AGIs $25k-50k, 67.8% for AGIs $50k-75k, 76.5% for AGIs $75k-100k, 63.9% for AGIs over 100k)
Likely homosexual households (counted as self-reported same-sex unmarried-partner households)
Lesbian couples: 0.1% of all households
Gay men: 0.0% of all households
Household received Food Stamps/SNAP in the past 12 months: 336 Household did not receive Food Stamps/SNAP in the past 12 months: 1,397
Women who had a birth in the past 12 months: 76 (38 now married, 36 unmarried) Women who did not have a birth in the past 12 months: 689 (353 now married, 333 unmarried)
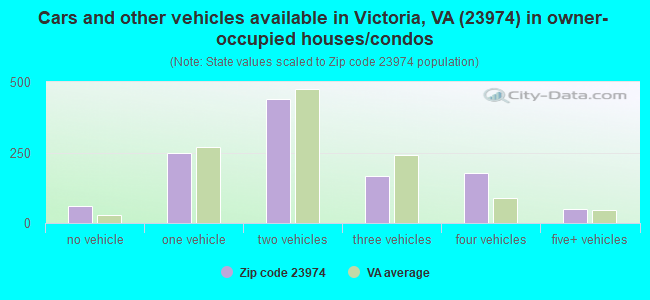
Housing units in zip code 23974 with a mortgage: 559 (34 second mortgage, 13 both second mortgage and home equity loan) Median monthly owner costs for units with a mortgage: $1,103 Median monthly owner costs for units without a mortgage: $375
Residents with income below the poverty level in 2022:
This zip code:
17.0%
Whole state:
10.6%
Residents with income below 50% of the poverty level in 2022:
This zip code:
13.2%
Whole state:
5.2%
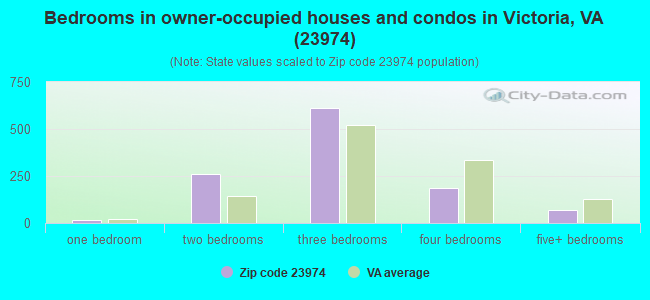
Median number of rooms in houses and condos:
Here:
6.3
State:
7.0
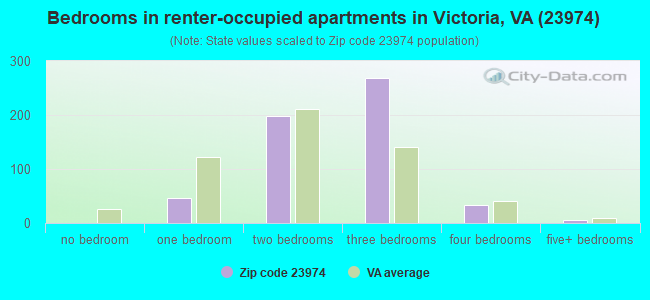
Median number of rooms in apartments:
Here:
4.9
State:
4.3
Notable locations in this zip code not listed on our city pages
Notable locations in zip code 23974: Victoria Fire Department (A), Victoria Police Department (B), Lunenburg County Sheriff's Office (C), Lunenburg County Courthouse (D). Display/hide their locations on the map
Churches in zip code 23974 include: Zion Hill Church (A), Thrift Chapel (B), Tussekiah Church (C), West Hill Church (D), First Baptist Church (E), Church of Christ (F), Church of the Nazarene (G), Gilfield Zion United Methodist Church (H), Victoria Baptist Church (I). Display/hide their locations on the map
Reservoirs: Nottoway Falls Reservoir (A), Lunenburg Beach Reservoir (B), Modest Creek Reservoir (C), Victoria Lake (D). Display/hide their locations on the map
In group quarters: 890 (-1 institutionalized population)
Size of family households: 585 2-persons, 346 3-persons, 129 4-persons, 18 5-persons, 42 6-persons, 12 7-or-more-persons
Size of nonfamily households: 454 1-person, 121 2-persons, 2 3-persons
322 married couples with children.
297 single-parent households (107 men, 190 women).
97.5% of residents of 23974 zip code speak English at home.
0.7% of residents speak Spanish at home (45% very well, 33% well, 21% not well).
0.3% of residents speak Asian or Pacific Island language at home (100% very well).
1.1% of residents speak other language at home (73% very well, 27% not at all).
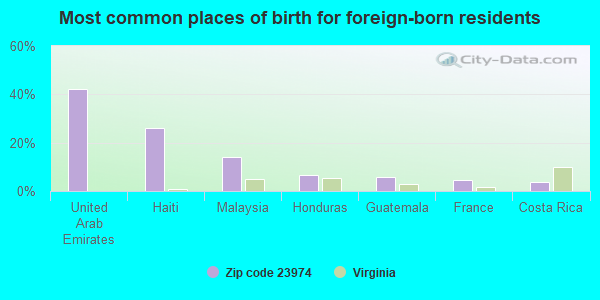
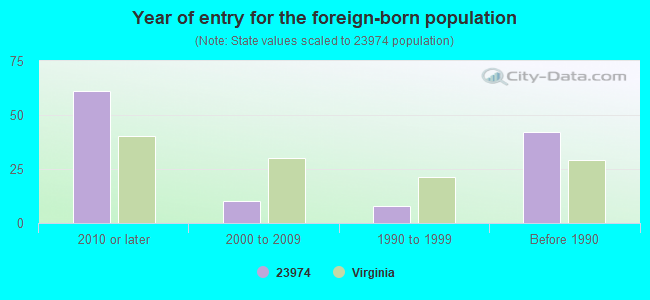
Foreign born population: 107 (2.2%) (62.0% of them are naturalized citizens)
This zip code:
2.2%
Whole state:
12.7%
42%United Arab Emirates
26%Haiti
14%Malaysia
7%Honduras
6%Guatemala
5%France
4%Costa Rica
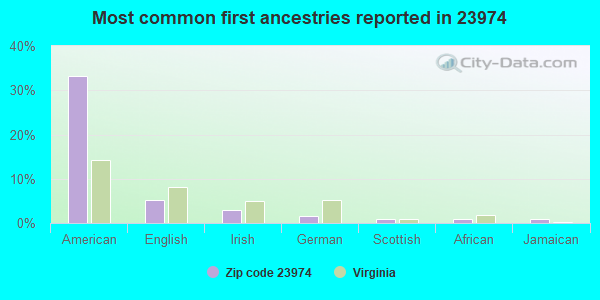
33%American
5%English
3%Irish
2%German
1%Scottish
1%African
1%Jamaican
Year of entry for the foreign-born population
612010 or later
102000 to 2009
81990 to 1999
42Before 1990
Facilities with environmental interests located in this zip code:
CENTRAL HIGH (131 K-V RD in VICTORIA, VA)
(National Center for Education Statistics) - STATE ID-0550560 Organizations: LUNENBURG COUNTY PUBLIC SCHOOLS (SCHOOL DISTRICT)
COASTAL MART INC #903 (1401 N MAIN ST in VICTORIA, VA)
Conditionally Exempt Small Quantity Generators, less than 100 kg/month of hazardous waste (Resource Conservation and Recovery Act (tracking hazardous waste)) - notification Organizations: OPERNAME (CONTACT/OPERATOR)
, HUGHEY L M CO (CONTACT/OWNER)
AILEEN INC VICTOIRA (TIDEWATER DR in VICTORIA, VA)
Conditionally Exempt Small Quantity Generators, less than 100 kg/month of hazardous waste (Resource Conservation and Recovery Act (tracking hazardous waste)) - notification
Housing units lacking complete plumbing facilities: 1.6% Housing units lacking complete kitchen facilities: 3.9%
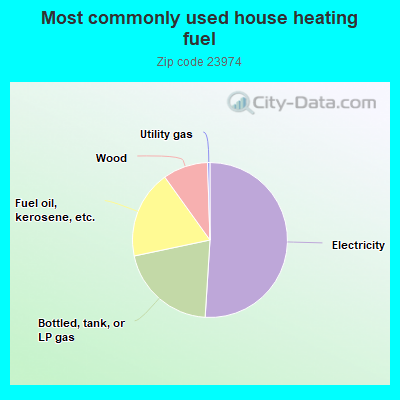
51.0%Electricity
20.7%Bottled, tank, or LP gas
18.4%Fuel oil, kerosene, etc.
9.4%Wood
0.5%Utility gas
Population in 1990: 4,027. Population change in the 1990s: +985 (+24.5%).
Place of birth for U.S.-born residents:
This state: 3,541
Northeast: 505
Midwest: 69
South: 555
West: 74
66% of the 23974 zip code residents lived in the same house 5 years ago. Out of people who lived in different houses, 42% lived in this county. Out of people who lived in different counties, 50% lived in Virginia.
94% of the 23974 zip code residents lived in the same house 1 year ago. Out of people who lived in different houses, 30% moved from this county. Out of people who lived in different houses, 52% moved from different county within same state. Out of people who lived in different houses, 25% moved from different state.
Private vs. public school enrollment:
Students in private schools in grades 1 to 8 (elementary and middle school):
Here:
0.0%
Virginia:
13.2%
Students in private schools in grades 9 to 12 (high school): 14
Here:
5.7%
Virginia:
10.2%
Students in private undergraduate colleges: 9
Here:
14.5%
Virginia:
18.7%
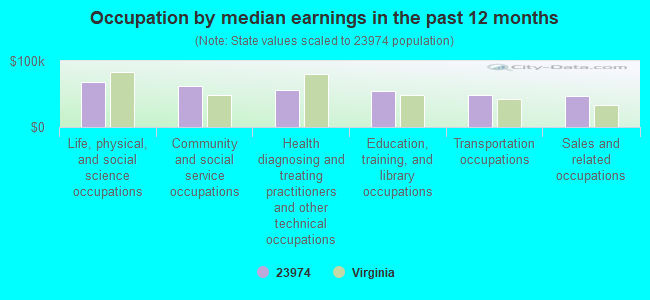
Occupation by median earnings in the past 12 months ($)
68,084Life, physical, and social science occupations
62,679Community and social service occupations
55,998Health diagnosing and treating practitioners and other technical occupations
54,681Education, training, and library occupations
48,023Transportation occupations
46,554Sales and related occupations
Top industries in this zip code by the number of employees in 2005:
Health Care and Social Assistance: All Other Outpatient Care Centers (50-99 employees: 1 establishment)
Accommodation and Food Services: Full-Service Restaurants (10-19: 1, 5-9: 1)
Finance and Insurance: Commercial Banking (10-19: 1, 1-4: 1)
Health Care and Social Assistance: Child and Youth Services (10-19: 1)
Information: Newspaper Publishers (10-19: 1)
Finance and Insurance: Insurance Agencies and Brokerages (1-4: 6)
Construction: Plumbing, Heating, and Air-Conditioning Contractors (5-9: 1, 1-4: 2)
People in group quarters in 2010:
1,173 people in state prisons
9 people in group homes intended for adults
People in group quarters in 2000:
1,119 people in federal prisons and detention centers
Fatal accident statistics in 2014:
Fatal accident count: 1
Vehicles involved in fatal accidents: 3
Fatal accidents caused by drunken drivers: 0
Fatalities: 1
Persons involved in fatal accidents: 3
Pedestrians involved in fatal accidents: 0
Fatal accident statistics in 2013:
Fatal accident count: 1
Vehicles involved in fatal accidents: 1
Fatal accidents caused by drunken drivers: 0
Fatalities: 1
Persons involved in fatal accidents: 1
Pedestrians involved in fatal accidents: 0
2004 - 2018 National Fire Incident Reporting System (NFIRS) incidents
According to the data from the years 2004 - 2018 the average number of fire incidents per year is 22. The highest number of fires - 46 took place in 2012, and the least - 3 in 2017. The data has a constant trend.
When looking into fire subcategories, the most reports belonged to: Structure Fires (42.2%), and Outside Fires (41.0%).
Fire incident types reported to NFIRS in Zip Code 23974


 Nearest zip codes: 23952, 23944, 23942, 23954, 23947, 23922.
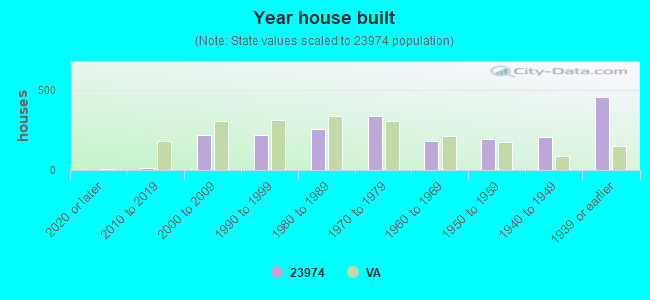


 According to the data from the years 2004 - 2018 the average number of fire incidents per year is 22. The highest number of fires - 46 took place in 2012, and the least - 3 in 2017. The data has a constant trend.
 When looking into fire subcategories, the most reports belonged to: Structure Fires (42.2%), and Outside Fires (41.0%).