Estimated zip code population in 2022: 1,595 Zip code population in 2010: 904 Zip code population in 2000: 793
March 2022 cost of living index in zip code 24437: 83.2 (low, U.S. average is 100)
Land area: 13.3 sq. mi. Water area: 0.1 sq. mi.
Population density: 120 people per square mile
(very low).
OSM Map
General Map
Google Map
MSN Map
OSM Map
General Map
Google Map
MSN Map
OSM Map
General Map
Google Map
MSN Map
OSM Map
General Map
Google Map
MSN Map
Please wait while loading the map...
Real estate property taxes paid for housing units in 2022:
This zip code:
0.5% ($1,541)
Virginia:
0.7% ($2,617)
Median real estate property taxes paid for housing units with mortgages in 2022: $1,344 (0.4%) Median real estate property taxes paid for housing units with no mortgage in 2022: $1,833 (0.6%)
Business Search- 14 Million verified businesses
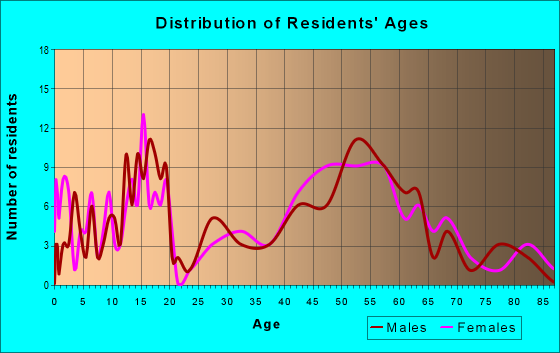
Males: 914
(57.3%)
Females: 681
(42.7%)
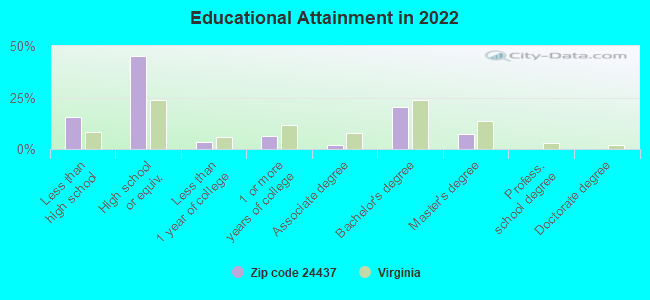
For population 25 years and over in 24437:
High school or higher: 81.6%
Bachelor's degree or higher: 27.1%
Graduate or professional degree: 7.3%
Unemployed: 7.6%
Mean travel time to work (commute): 16.6 minutes
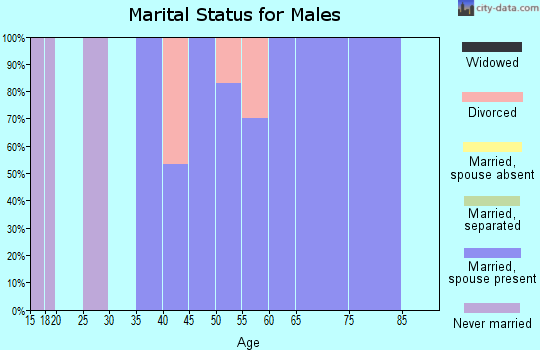
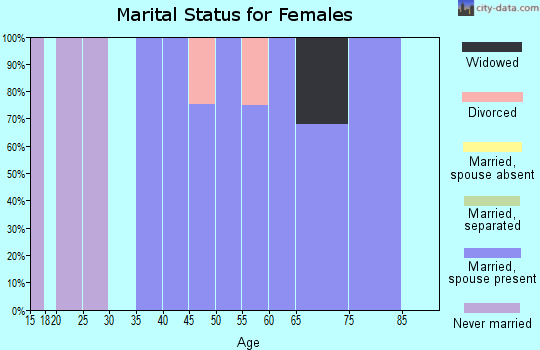
For population 15 years and over in 24437:
Never married: 32.7%
Now married: 49.4%
Separated: 0.0%
Widowed: 14.9%
Divorced: 3.0%
Zip code 24437 compared to state average:
Unemployed percentage above state average.
Black race population percentage significantly below state average.
Hispanic race population percentage significantly below state average.
Median age significantly above state average.
Foreign-born population percentage significantly below state average.
Renting percentage significantly below state average.
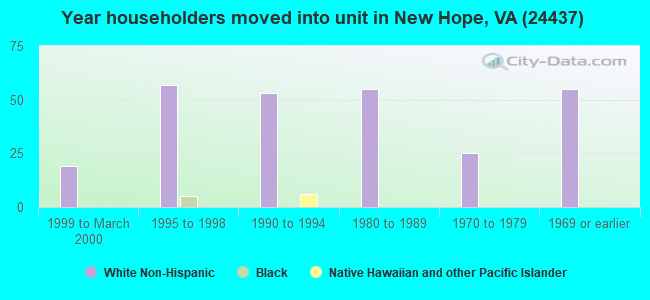
Length of stay since moving in significantly above state average.
House age above state average.
Number of college students significantly below state average.
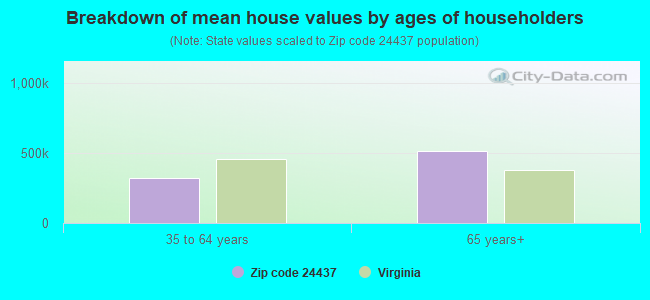
Estimated median house/condo value in 2022: $319,745
24437:
$319,745
Virginia:
$365,700
According to our research of Virginia and other state lists, there were 2 registered sex offenders living in 24437 zip code as of April 25, 2024. The ratio of all residents to sex offenders in zip code 24437 is 641 to 1. The ratio of registered sex offenders to all residents in this zip code is lower than the state average.
Median resident age:
This zip code:
54.2 years
Virginia median age:
39.0 years
Average household size:
This zip code:
2.8 people
Virginia:
2.5 people
Averages for the 2020 tax year for zip code 24437, filed in 2021:
Average Adjusted Gross Income (AGI) in 2020: $76,891 (Individual Income Tax Returns)
Here:
$76,891
State:
$86,446
Salary/wage: $55,784 (reported on 82.6% of returns)
Here:
$55,784
State:
$71,185
(% of AGI for various income ranges: 1214.5% for AGIs below $25k, 3448.3% for AGIs $25k-50k, 5527.1% for AGIs $50k-75k, 9752.5% for AGIs $75k-100k, 20046.0% for AGIs $100k-200k)
Taxable interest for individuals: $1,000 (reported on 50.0% of returns)
This zip code:
$1,000
Virginia:
$1,805
(% of AGI for various income ranges: 15.5% for AGIs below $25k, 13.3% for AGIs $25k-50k, 17.1% for AGIs $50k-75k, 87.5% for AGIs $75k-100k, 316.0% for AGIs $100k-200k)
Ordinary dividends: $3,838 (reported on 28.3% of returns)
Here:
$3,838
State:
$8,327
(% of AGI for various income ranges: 25.5% for AGIs below $25k, 171.7% for AGIs $25k-50k, 247.5% for AGIs $75k-100k, 538.0% for AGIs $100k-200k)
Net capital gain/loss in AGI: +$13,073 (reported on 23.9% of returns)
Here:
+$13,073
State:
+$24,644
(% of AGI for various income ranges: 58.2% for AGIs below $25k, 100.0% for AGIs $50k-75k, 2608.0% for AGIs $100k-200k)
Profit/loss from business: +$14,360 (reported on 10.9% of returns)
Here:
+$14,360
State:
+$12,836
(% of AGI for various income ranges: 48.2% for AGIs below $25k, 1662.5% for AGIs $75k-100k)
Taxable individual retirement arrangement distribution: $12,467 (reported on 13.0% of returns)
24437:
$12,467
Virginia:
$21,535
(% of AGI for various income ranges: 570.0% for AGIs $25k-50k, 1015.0% for AGIs $75k-100k)
Total itemized deductions: $24,433 (reported on 13.0% of returns)
Here:
$24,433
State:
$33,287
(% of AGI for various income ranges: 835.7% for AGIs $50k-75k, 1762.0% for AGIs $100k-200k)
Charity contributions: $9,833 (reported on 6.5% of returns)
Here:
$9,833
State:
$10,381
(% of AGI for various income ranges: 590.0% for AGIs $100k-200k)
Taxes paid: $5,750 (reported on 13.0% of returns)
24437:
$5,750
State:
$8,284
(% of AGI for various income ranges: 182.9% for AGIs $50k-75k, 434.0% for AGIs $100k-200k)
Earned income credit: $1,920 (reported on 10.9% of returns)
Here:
$1,920
State:
$2,214
(% of AGI for various income ranges: 87.3% for AGIs below $25k)
Percentage of individuals using paid preparers for their 2020 taxes: 93.5%
Here:
93%
State:
92%
(% for various income ranges: 92.9% for AGIs below $25k, 87.5% for AGIs $25k-50k, 87.5% for AGIs $50k-75k, 100.0% for AGIs $75k-100k, 100.0% for AGIs $100k-200k, 100.0% for AGIs over 200k)
Averages for the 2012 tax year for zip code 24437, filed in 2013:
Average Adjusted Gross Income (AGI) in 2012: $54,558 (Individual Income Tax Returns)
Here:
$54,558
State:
$71,192
Salary/wage: $46,881 (reported on 80.0% of returns)
Here:
$46,881
State:
$59,229
(% of AGI for various income ranges: 74.8% for AGIs below $25k, 73.5% for AGIs $25k-50k, 74.2% for AGIs $50k-75k, 70.4% for AGIs $75k-100k, 62.4% for AGIs $100k-200k)
Taxable interest for individuals: $942 (reported on 47.5% of returns)
This zip code:
$942
Virginia:
$1,600
(% of AGI for various income ranges: 1.2% for AGIs below $25k, 0.9% for AGIs $25k-50k, 0.5% for AGIs $50k-75k, 0.7% for AGIs $75k-100k, 0.9% for AGIs $100k-200k)
Ordinary dividends: $4,082 (reported on 27.5% of returns)
Here:
$4,082
State:
$6,959
(% of AGI for various income ranges: 3.5% for AGIs $25k-50k, 2.6% for AGIs $50k-75k, 1.5% for AGIs $75k-100k, 2.0% for AGIs $100k-200k)
Net capital gain/loss in AGI: +$3,956 (reported on 22.5% of returns)
Here:
+$3,956
State:
+$16,672
(% of AGI for various income ranges: 3.0% for AGIs $75k-100k, 2.6% for AGIs $100k-200k)
Profit/loss from business: +$4,860 (reported on 12.5% of returns)
Here:
+$4,860
State:
+$14,116
Taxable individual retirement arrangement distribution: $9,950 (reported on 10.0% of returns)
24437:
$9,950
Virginia:
$16,667
Total itemized deductions: $21,607 (22% of AGI, reported on 35.0% of returns)
Here:
$21,607
State:
$26,596
Here:
21.9% of AGI
State:
20.1% of AGI
(% of AGI for various income ranges: 12.4% for AGIs $25k-50k, 11.9% for AGIs $50k-75k, 16.7% for AGIs $75k-100k, 16.3% for AGIs $100k-200k)
Charity contributions: $3,708 (reported on 32.5% of returns)
Here:
$3,708
State:
$4,443
(% of AGI for various income ranges: 2.5% for AGIs $25k-50k, 3.1% for AGIs $75k-100k, 2.9% for AGIs $100k-200k)
Taxes paid: $6,164 (reported on 35.0% of returns)
24437:
$6,164
State:
$9,951
(% of AGI for various income ranges: 2.2% for AGIs $25k-50k, 3.1% for AGIs $50k-75k, 4.5% for AGIs $75k-100k, 5.5% for AGIs $100k-200k)
Earned income credit: $1,840 (reported on 12.5% of returns)
Here:
$1,840
State:
$2,211
(% of AGI for various income ranges: 5.7% for AGIs below $25k)
Percentage of individuals using paid preparers for their 2012 taxes: 52.5%
Here:
52%
State:
46%
(% for various income ranges: 38.5% for AGIs below $25k, 60.0% for AGIs $25k-50k, 60.0% for AGIs $50k-75k, 50.0% for AGIs $75k-100k, 66.7% for AGIs $100k-200k)
Averages for the 2004 tax year for zip code 24437, filed in 2005:
Average Adjusted Gross Income (AGI) in 2004: $43,758 (Individual Income Tax Returns)
Here:
$43,758
State:
$56,704
Salary/wage: $36,837 (reported on 84.1% of returns)
Here:
$36,837
State:
$48,441
(% of AGI for various income ranges: 118.9% for AGIs below $10k, 68.7% for AGIs $10k-25k, 76.9% for AGIs $25k-50k, 79.9% for AGIs $50k-75k, 78.8% for AGIs $75k-100k, 52.8% for AGIs over 100k)
Taxable interest for individuals: $1,355 (reported on 58.0% of returns)
This zip code:
$1,355
Virginia:
$1,688
(% of AGI for various income ranges: 11.6% for AGIs below $10k, 3.0% for AGIs $10k-25k, 2.0% for AGIs $25k-50k, 0.6% for AGIs $50k-75k, 1.0% for AGIs $75k-100k, 2.2% for AGIs over 100k)
Taxable dividends: $2,378 (reported on 37.1% of returns)
Here:
$2,378
State:
$4,028
(% of AGI for various income ranges: 4.7% for AGIs below $10k, 3.2% for AGIs $10k-25k, 1.9% for AGIs $25k-50k, 1.7% for AGIs $50k-75k, 2.7% for AGIs $75k-100k, 1.5% for AGIs over 100k)
Net capital gain/loss: +$1,462 (reported on 25.5% of returns)
Here:
+$1,462
State:
+$14,375
(% of AGI for various income ranges: -5.8% for AGIs below $10k, -0.6% for AGIs $10k-25k, 0.6% for AGIs $25k-50k, 1.4% for AGIs $50k-75k, -0.3% for AGIs $75k-100k, 2.0% for AGIs over 100k)
Profit/loss from business: +$9,875 (reported on 11.0% of returns)
Here:
+$9,875
State:
+$13,342
Total itemized deductions: $18,102 (24% of AGI, reported on 34.9% of returns)
Here:
$18,102
State:
$21,492
Here:
23.7% of AGI
State:
21.0% of AGI
(% of AGI for various income ranges: 17.6% for AGIs $10k-25k, 10.7% for AGIs $25k-50k, 14.4% for AGIs $50k-75k, 16.1% for AGIs $75k-100k, 15.6% for AGIs over 100k)
Charity contributions deductions: $3,487 (4% of AGI, reported on 31.0% of returns)
Here:
$3,487
State:
$3,794
Here:
4.5% of AGI
State:
3.5% of AGI
(% of AGI for various income ranges: 2.6% for AGIs $10k-25k, 2.0% for AGIs $25k-50k, 2.1% for AGIs $50k-75k, 3.5% for AGIs $75k-100k, 2.6% for AGIs over 100k)
Total tax: $5,472 (reported on 79.1% of returns)
24437:
$5,472
State:
$9,537
(% of AGI for various income ranges: 1.8% for AGIs below $10k, 3.7% for AGIs $10k-25k, 7.0% for AGIs $25k-50k, 8.0% for AGIs $50k-75k, 9.1% for AGIs $75k-100k, 16.0% for AGIs over 100k)
Earned income credit: $1,455 (reported on 9.1% of returns)
Here:
$1,455
State:
$1,734
Percentage of individuals using paid preparers for their 2004 taxes: 52.5%
Here:
52%
State:
52%
(% for various income ranges: 44.2% for AGIs below $10k, 46.3% for AGIs $10k-25k, 54.5% for AGIs $25k-50k, 62.5% for AGIs $50k-75k, 59.4% for AGIs $75k-100k, 56.2% for AGIs over 100k)
Household received Food Stamps/SNAP in the past 12 months: 0 Household did not receive Food Stamps/SNAP in the past 12 months: 552
Women who had a birth in the past 12 months: 16 (17 now married, 0 unmarried) Women who did not have a birth in the past 12 months: 280 (160 now married, 118 unmarried)
Housing units in zip code 24437 with a mortgage: 342 (3 second mortgage, 3 both second mortgage and home equity loan) Median monthly owner costs for units with a mortgage: $1,575 Median monthly owner costs for units without a mortgage: $530
Residents with income below the poverty level in 2022:
This zip code:
14.1%
Whole state:
10.6%
Residents with income below 50% of the poverty level in 2022:
This zip code:
6.1%
Whole state:
5.2%
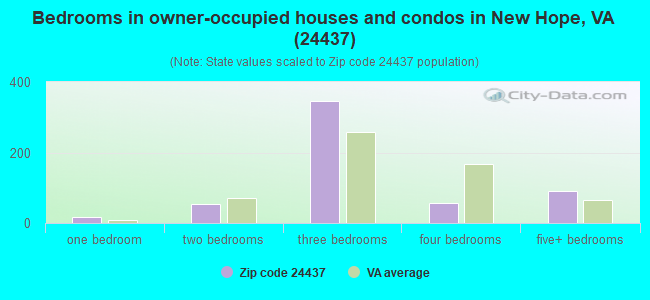
Median number of rooms in houses and condos:
Here:
6.2
State:
7.0
Notable locations in this zip code not listed on our city pages
Size of family households: 102 2-persons, 229 3-persons, 23 5-persons, 48 6-persons
Size of nonfamily households: 98 1-person, 59 3-persons
139 married couples with children.
9 single-parent households (9 men).
99.7% of residents of 24437 zip code speak English at home.
Foreign born population: 0 (0.0%)
:
0.0%
Whole state:
12.7%
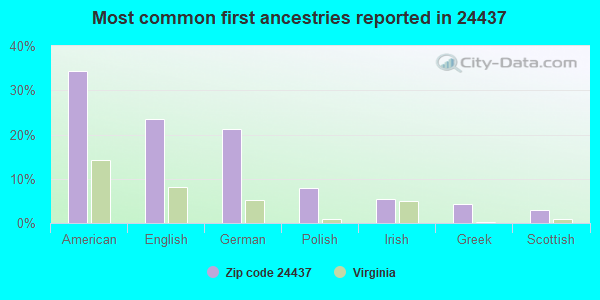
34%American
23%English
21%German
8%Polish
5%Irish
4%Greek
3%Scottish
Facilities with environmental interests located in this zip code:
CLYMORE ELEMENTARY SCHOOL (184 FORT DEFIANCE ROAD in FORT DEFIANCE, VA)
AIR MINOR (AIRS/AFS) STATE MASTER (Virginia pollutants databases) - CEDS-81302, AIR PROGRAM Business SIC and NAICS classification: ELEMENTARY AND SECONDARY SCHOOLS Alternative names: EDWARD G. CLYMORE ELEM
Housing units lacking complete plumbing facilities: 9.6% Housing units lacking complete kitchen facilities: 9.8%
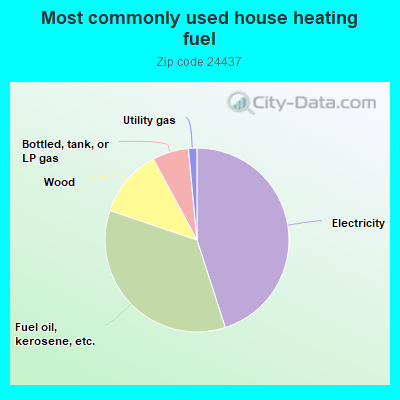
45.3%Electricity
35.4%Fuel oil, kerosene, etc.
12.0%Wood
6.4%Bottled, tank, or LP gas
1.5%Utility gas
Population in 1990: 824.
Place of birth for U.S.-born residents:
This state: 992
Northeast: 34
Midwest: 78
South: 445
West: 37
78% of the 24437 zip code residents lived in the same house 5 years ago. Out of people who lived in different houses, 60% lived in this county. Out of people who lived in different counties, 50% lived in Virginia.
101% of the 24437 zip code residents lived in the same house 1 year ago.
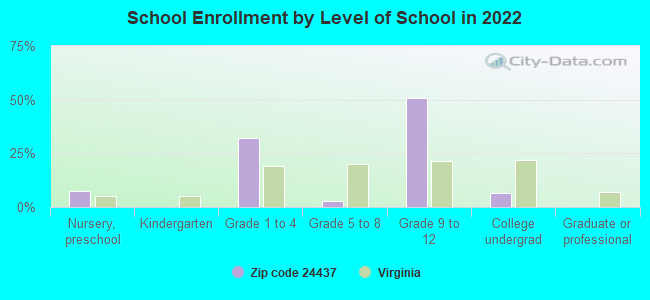
Private vs. public school enrollment:
Students in private schools in grades 1 to 8 (elementary and middle school): 80
Here:
69.6%
Virginia:
13.2%
Students in private schools in grades 9 to 12 (high school):
Here:
0.0%
Virginia:
10.2%
Students in private undergraduate colleges:
Here:
0.0%
Virginia:
18.7%
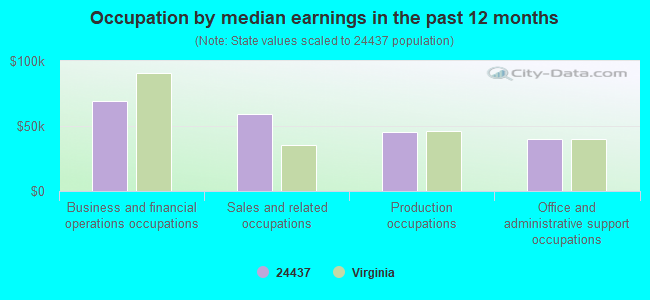
Occupation by median earnings in the past 12 months ($)
69,311Business and financial operations occupations
58,849Sales and related occupations
45,083Production occupations
40,130Office and administrative support occupations
Top industries in this zip code by the number of employees in 2005:
Health Care and Social Assistance: Offices of Physicians (except Mental Health Specialists) (20-49 employees: 1 establishment)
Administrative and Support and Waste Management and Remediation Services: Landscaping Services (10-19: 1)
Construction: Power and Communication Line and Related Structures Construction (10-19: 1)
Health Care and Social Assistance: Services for the Elderly and Persons with Disabilities (10-19: 1)
Other Services (except Public Administration): Religious Organizations (5-9: 1)
Arts, Entertainment, and Recreation: Fitness and Recreational Sports Centers (5-9: 1)
Other Services (except Public Administration): Reupholstery and Furniture Repair (1-4: 1)
Fatal accident statistics in 2010:
Fatal accident count: 1
Vehicles involved in fatal accidents: 1
Fatal accidents caused by drunken drivers: 1
Fatalities: 1
Persons involved in fatal accidents: 2
Pedestrians involved in fatal accidents: 0
2002 - 2018 National Fire Incident Reporting System (NFIRS) incidents
Based on the data from the years 2002 - 2018 the average number of fire incidents per year is 8. The highest number of reported fires - 18 took place in 2002, and the least - 0 in 2014. The data has a decreasing trend.
When looking into fire subcategories, the most incidents belonged to: Structure Fires (43.8%), and Outside Fires (38.2%).
Fire incident types reported to NFIRS in Zip Code 24437
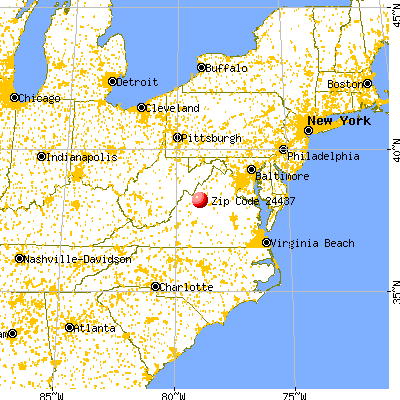


 Nearest zip codes: 24467, 24482, 24486, 24431, 24441, 22939.
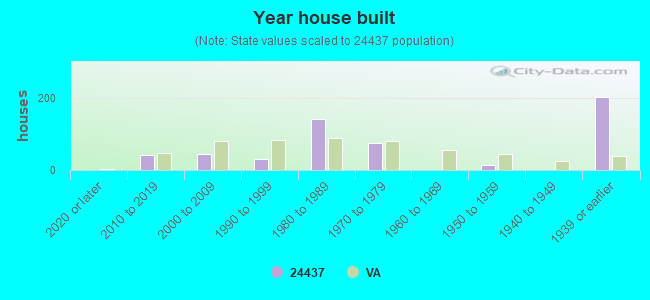


 Based on the data from the years 2002 - 2018 the average number of fire incidents per year is 8. The highest number of reported fires - 18 took place in 2002, and the least - 0 in 2014. The data has a decreasing trend.
 When looking into fire subcategories, the most incidents belonged to: Structure Fires (43.8%), and Outside Fires (38.2%).