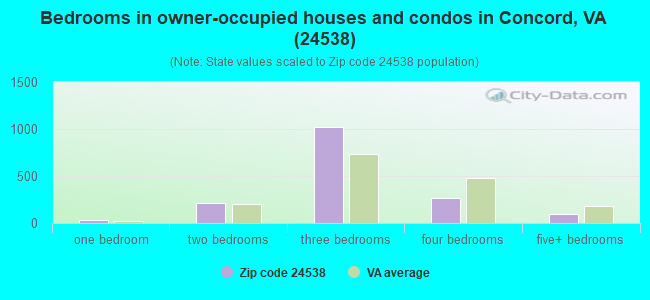
Estimated zip code population in 2022: 4,776 Zip code population in 2010: 4,742 Zip code population in 2000: 3,657
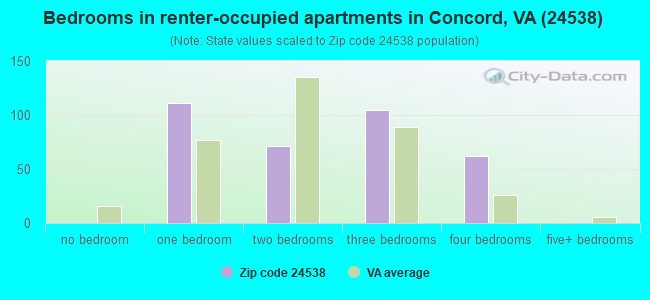
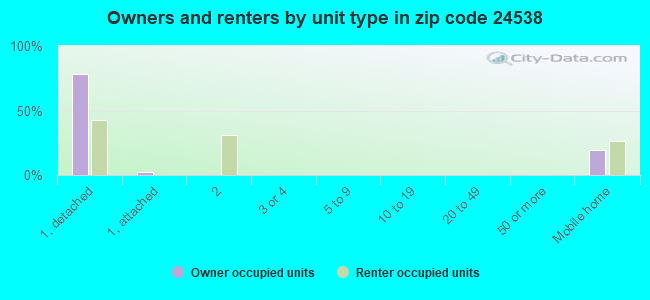
Houses and condos: 2,196 Renter-occupied apartments: 348
% of renters here:
18%
State:
33%
March 2022 cost of living index in zip code 24538: 83.5 (less than average, U.S. average is 100)
Land area: 92.1 sq. mi. Water area: 0.5 sq. mi.
Population density: 52 people per square mile
(very low).
OSM Map
General Map
Google Map
MSN Map
OSM Map
General Map
Google Map
MSN Map
OSM Map
General Map
Google Map
MSN Map
OSM Map
General Map
Google Map
MSN Map
Please wait while loading the map...
Real estate property taxes paid for housing units in 2022:
This zip code:
0.5% ($812)
Virginia:
0.7% ($2,617)
Median real estate property taxes paid for housing units with mortgages in 2022: $1,138 (0.5%) Median real estate property taxes paid for housing units with no mortgage in 2022: $744 (0.5%)
Business Search- 14 Million verified businesses
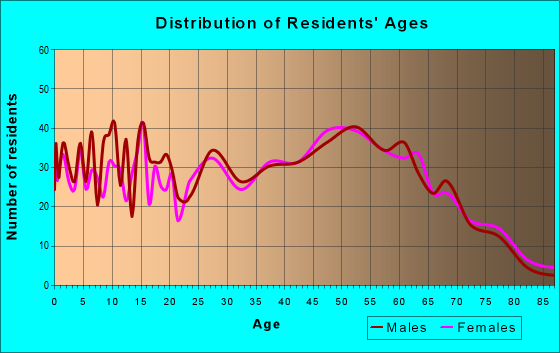
Males: 2,318
(48.5%)
Females: 2,458
(51.5%)
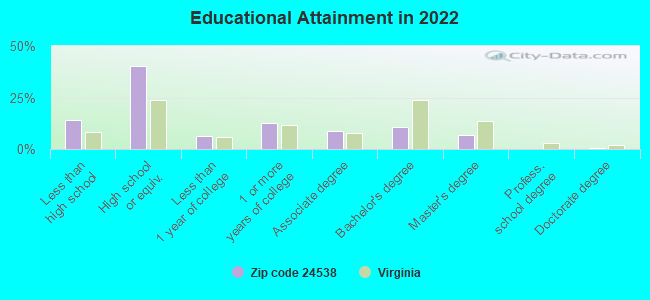
For population 25 years and over in 24538:
High school or higher: 84.9%
Bachelor's degree or higher: 17.9%
Graduate or professional degree: 7.4%
Unemployed: 2.8%
Mean travel time to work (commute): 25.8 minutes
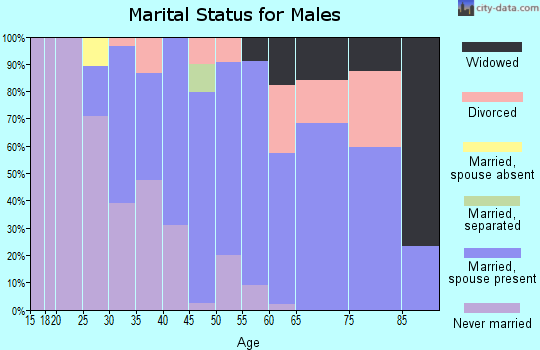
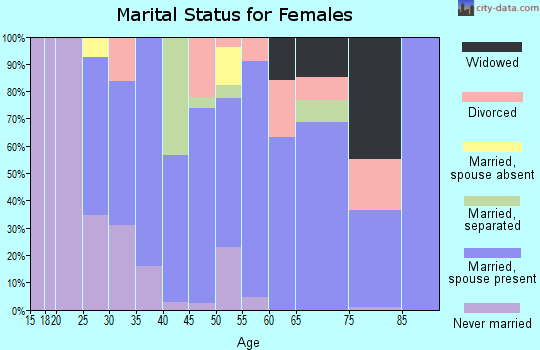
For population 15 years and over in 24538:
Never married: 23.0%
Now married: 53.3%
Separated: 2.1%
Widowed: 9.9%
Divorced: 11.7%
Zip code 24538 compared to state average:
Median household income below state average.
Median house value below state average.
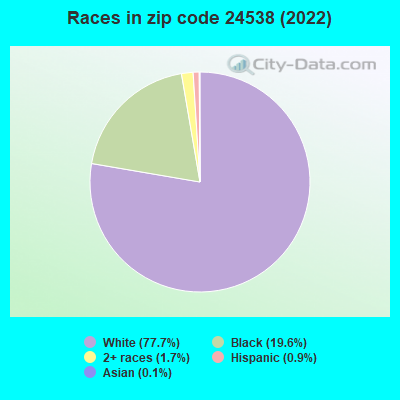
Hispanic race population percentage significantly below state average.
Median age significantly above state average.
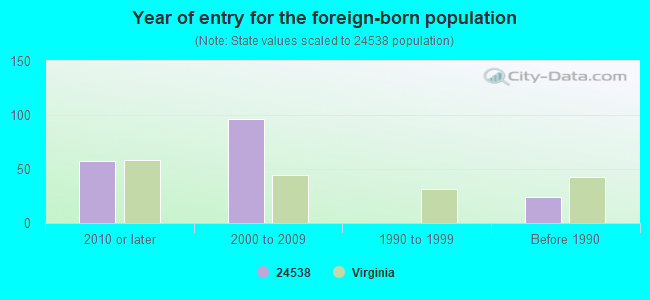
Foreign-born population percentage significantly below state average.
Renting percentage below state average.
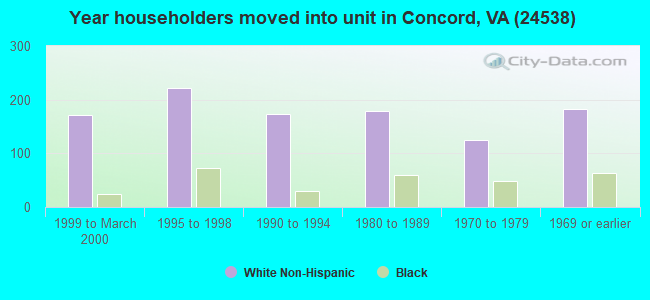
Length of stay since moving in significantly above state average.
Number of college students below state average.
Percentage of population with a bachelor's degree or higher below state average.
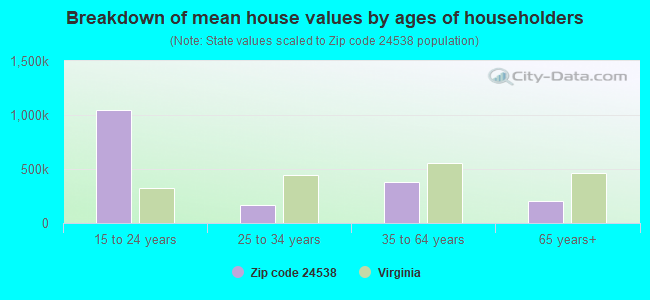
Estimated median house/condo value in 2022: $162,832
24538:
$162,832
Virginia:
$365,700
According to our research of Virginia and other state lists, there were 14 registered sex offenders living in 24538 zip code as of April 23, 2024. The ratio of all residents to sex offenders in zip code 24538 is 362 to 1. The ratio of registered sex offenders to all residents in this zip code is near the state average.
Median resident age:
This zip code:
50.6 years
Virginia median age:
39.0 years
Average household size:
This zip code:
2.4 people
Virginia:
2.5 people
Averages for the 2020 tax year for zip code 24538, filed in 2021:
Average Adjusted Gross Income (AGI) in 2020: $58,877 (Individual Income Tax Returns)
Here:
$58,877
State:
$86,446
Salary/wage: $52,062 (reported on 84.3% of returns)
Here:
$52,062
State:
$71,185
(% of AGI for various income ranges: 1246.9% for AGIs below $25k, 3624.6% for AGIs $25k-50k, 6434.6% for AGIs $50k-75k, 9901.7% for AGIs $75k-100k, 15242.0% for AGIs $100k-200k)
Taxable interest for individuals: $794 (reported on 29.2% of returns)
This zip code:
$794
Virginia:
$1,805
(% of AGI for various income ranges: 9.2% for AGIs below $25k, 16.3% for AGIs $25k-50k, 23.1% for AGIs $50k-75k, 45.6% for AGIs $75k-100k, 76.5% for AGIs $100k-200k)
Ordinary dividends: $2,294 (reported on 15.3% of returns)
Here:
$2,294
State:
$8,327
(% of AGI for various income ranges: 28.2% for AGIs below $25k, 19.0% for AGIs $25k-50k, 47.7% for AGIs $50k-75k, 75.0% for AGIs $75k-100k, 89.5% for AGIs $100k-200k)
Net capital gain/loss in AGI: +$8,519 (reported on 12.5% of returns)
Here:
+$8,519
State:
+$24,644
(% of AGI for various income ranges: 11.8% for AGIs below $25k, 11.7% for AGIs $25k-50k, 90.8% for AGIs $50k-75k, 63.9% for AGIs $75k-100k, 260.0% for AGIs $100k-200k)
Profit/loss from business: +$4,236 (reported on 13.0% of returns)
Here:
+$4,236
State:
+$12,836
(% of AGI for various income ranges: 23.7% for AGIs below $25k, 103.4% for AGIs $25k-50k, 192.8% for AGIs $75k-100k, 158.5% for AGIs $100k-200k)
Taxable individual retirement arrangement distribution: $14,980 (reported on 9.3% of returns)
24538:
$14,980
Virginia:
$21,535
(% of AGI for various income ranges: 55.7% for AGIs below $25k, 106.3% for AGIs $25k-50k, 217.7% for AGIs $50k-75k, 226.7% for AGIs $75k-100k, 651.0% for AGIs $100k-200k)
Total itemized deductions: $30,692 (reported on 6.0% of returns)
Here:
$30,692
State:
$33,287
(% of AGI for various income ranges: 574.2% for AGIs $50k-75k, 743.5% for AGIs $100k-200k)
Charity contributions: $14,520 (reported on 4.6% of returns)
Here:
$14,520
State:
$10,381
(% of AGI for various income ranges: 110.8% for AGIs $50k-75k, 273.0% for AGIs $100k-200k)
Taxes paid: $6,346 (reported on 6.0% of returns)
24538:
$6,346
State:
$8,284
(% of AGI for various income ranges: 95.8% for AGIs $50k-75k, 187.0% for AGIs $100k-200k)
Earned income credit: $2,186 (reported on 16.2% of returns)
Here:
$2,186
State:
$2,214
(% of AGI for various income ranges: 79.8% for AGIs below $25k, 87.3% for AGIs $25k-50k)
Percentage of individuals using paid preparers for their 2020 taxes: 91.7%
Here:
92%
State:
92%
(% for various income ranges: 91.3% for AGIs below $25k, 92.3% for AGIs $25k-50k, 91.4% for AGIs $50k-75k, 88.0% for AGIs $75k-100k, 93.3% for AGIs $100k-200k, 100.0% for AGIs over 200k)
Averages for the 2012 tax year for zip code 24538, filed in 2013:
Average Adjusted Gross Income (AGI) in 2012: $47,457 (Individual Income Tax Returns)
Here:
$47,457
State:
$71,192
Salary/wage: $41,758 (reported on 89.1% of returns)
Here:
$41,758
State:
$59,229
(% of AGI for various income ranges: 78.8% for AGIs below $25k, 85.9% for AGIs $25k-50k, 86.2% for AGIs $50k-75k, 84.8% for AGIs $75k-100k, 62.2% for AGIs $100k-200k)
Taxable interest for individuals: $912 (reported on 29.4% of returns)
This zip code:
$912
Virginia:
$1,600
(% of AGI for various income ranges: 0.9% for AGIs below $25k, 0.7% for AGIs $25k-50k, 0.4% for AGIs $50k-75k, 0.5% for AGIs $75k-100k, 0.6% for AGIs $100k-200k)
Ordinary dividends: $1,823 (reported on 12.9% of returns)
Here:
$1,823
State:
$6,959
(% of AGI for various income ranges: 0.7% for AGIs below $25k, 0.4% for AGIs $25k-50k, 0.7% for AGIs $50k-75k, 0.4% for AGIs $75k-100k, 0.4% for AGIs $100k-200k)
Net capital gain/loss in AGI: +$7,385 (reported on 10.0% of returns)
Here:
+$7,385
State:
+$16,672
(% of AGI for various income ranges: 0.3% for AGIs $25k-50k, 0.7% for AGIs $50k-75k, 0.2% for AGIs $75k-100k, 4.6% for AGIs $100k-200k)
Profit/loss from business: +$7,246 (reported on 11.9% of returns)
Here:
+$7,246
State:
+$14,116
(% of AGI for various income ranges: 5.7% for AGIs below $25k, 2.0% for AGIs $25k-50k, 2.0% for AGIs $50k-75k, 0.9% for AGIs $75k-100k, 0.8% for AGIs $100k-200k)
Taxable individual retirement arrangement distribution: $10,906 (reported on 8.0% of returns)
24538:
$10,906
Virginia:
$16,667
(% of AGI for various income ranges: 2.2% for AGIs below $25k, 1.2% for AGIs $25k-50k, 1.4% for AGIs $50k-75k, 1.5% for AGIs $75k-100k, 2.7% for AGIs $100k-200k)
Total itemized deductions: $17,677 (22% of AGI, reported on 28.4% of returns)
Here:
$17,677
State:
$26,596
Here:
22.1% of AGI
State:
20.1% of AGI
(% of AGI for various income ranges: 6.7% for AGIs below $25k, 8.0% for AGIs $25k-50k, 10.6% for AGIs $50k-75k, 12.9% for AGIs $75k-100k, 12.3% for AGIs $100k-200k)
Charity contributions: $3,805 (reported on 21.9% of returns)
Here:
$3,805
State:
$4,443
(% of AGI for various income ranges: 0.8% for AGIs below $25k, 1.3% for AGIs $25k-50k, 1.7% for AGIs $50k-75k, 1.9% for AGIs $75k-100k, 2.4% for AGIs $100k-200k)
Taxes paid: $5,528 (reported on 28.4% of returns)
24538:
$5,528
State:
$9,951
(% of AGI for various income ranges: 0.8% for AGIs below $25k, 1.7% for AGIs $25k-50k, 2.8% for AGIs $50k-75k, 4.1% for AGIs $75k-100k, 5.2% for AGIs $100k-200k)
Earned income credit: $2,219 (reported on 21.4% of returns)
Here:
$2,219
State:
$2,211
(% of AGI for various income ranges: 7.1% for AGIs below $25k, 1.4% for AGIs $25k-50k)
Percentage of individuals using paid preparers for their 2012 taxes: 50.7%
Here:
51%
State:
46%
(% for various income ranges: 44.6% for AGIs below $25k, 50.9% for AGIs $25k-50k, 54.5% for AGIs $50k-75k, 57.1% for AGIs $75k-100k, 62.5% for AGIs $100k-200k)
Averages for the 2004 tax year for zip code 24538, filed in 2005:
Average Adjusted Gross Income (AGI) in 2004: $38,007 (Individual Income Tax Returns)
Here:
$38,007
State:
$56,704
Salary/wage: $34,953 (reported on 89.7% of returns)
Here:
$34,953
State:
$48,441
(% of AGI for various income ranges: 117.9% for AGIs below $10k, 81.5% for AGIs $10k-25k, 88.0% for AGIs $25k-50k, 88.5% for AGIs $50k-75k, 88.6% for AGIs $75k-100k, 57.8% for AGIs over 100k)
Taxable interest for individuals: $985 (reported on 33.1% of returns)
This zip code:
$985
Virginia:
$1,688
(% of AGI for various income ranges: 3.1% for AGIs below $10k, 1.7% for AGIs $10k-25k, 0.8% for AGIs $25k-50k, 0.5% for AGIs $50k-75k, 0.5% for AGIs $75k-100k, 1.0% for AGIs over 100k)
Taxable dividends: $1,736 (reported on 13.8% of returns)
Here:
$1,736
State:
$4,028
(% of AGI for various income ranges: 4.3% for AGIs below $10k, 0.8% for AGIs $10k-25k, 0.4% for AGIs $25k-50k, 0.6% for AGIs $50k-75k, 0.6% for AGIs $75k-100k, 0.4% for AGIs over 100k)
Net capital gain/loss: +$4,906 (reported on 10.3% of returns)
Here:
+$4,906
State:
+$14,375
(% of AGI for various income ranges: 0.4% for AGIs $10k-25k, 0.3% for AGIs $25k-50k, 1.5% for AGIs $50k-75k, 0.1% for AGIs $75k-100k, 4.3% for AGIs over 100k)
Profit/loss from business: +$4,836 (reported on 11.5% of returns)
Here:
+$4,836
State:
+$13,342
(% of AGI for various income ranges: 10.1% for AGIs below $10k, 2.9% for AGIs $10k-25k, 1.8% for AGIs $25k-50k, 1.3% for AGIs $50k-75k, 0.6% for AGIs $75k-100k)
IRA payment deduction: $2,800 (reported on 1.9% of returns)
24538:
$2,800
Virginia:
$2,943
Total itemized deductions: $15,627 (21% of AGI, reported on 25.5% of returns)
Here:
$15,627
State:
$21,492
Here:
21.4% of AGI
State:
21.0% of AGI
(% of AGI for various income ranges: 8.2% for AGIs below $10k, 5.0% for AGIs $10k-25k, 8.4% for AGIs $25k-50k, 11.6% for AGIs $50k-75k, 14.0% for AGIs $75k-100k, 12.9% for AGIs over 100k)
Charity contributions deductions: $3,231 (4% of AGI, reported on 21.3% of returns)
Here:
$3,231
State:
$3,794
Here:
4.2% of AGI
State:
3.5% of AGI
(% of AGI for various income ranges: 0.5% for AGIs $10k-25k, 1.2% for AGIs $25k-50k, 1.8% for AGIs $50k-75k, 2.4% for AGIs $75k-100k, 3.5% for AGIs over 100k)
Total tax: $4,670 (reported on 72.5% of returns)
24538:
$4,670
State:
$9,537
(% of AGI for various income ranges: 2.7% for AGIs below $10k, 3.5% for AGIs $10k-25k, 6.1% for AGIs $25k-50k, 7.9% for AGIs $50k-75k, 10.0% for AGIs $75k-100k, 17.7% for AGIs over 100k)
Earned income credit: $1,647 (reported on 19.6% of returns)
Here:
$1,647
State:
$1,734
Percentage of individuals using paid preparers for their 2004 taxes: 50.6%
Here:
51%
State:
52%
(% for various income ranges: 38.3% for AGIs below $10k, 52.4% for AGIs $10k-25k, 50.7% for AGIs $25k-50k, 53.9% for AGIs $50k-75k, 58.3% for AGIs $75k-100k, 71.6% for AGIs over 100k)
Likely homosexual households (counted as self-reported same-sex unmarried-partner households)
Lesbian couples: 0.0% of all households
Gay men: 0.4% of all households
Household received Food Stamps/SNAP in the past 12 months: 284 Household did not receive Food Stamps/SNAP in the past 12 months: 1,694
Women who had a birth in the past 12 months: 43 (44 now married, 0 unmarried) Women who did not have a birth in the past 12 months: 930 (370 now married, 561 unmarried)
Housing units in zip code 24538 with a mortgage: 800 (89 second mortgage, 15 home equity loan, 64 both second mortgage and home equity loan) Houses without a mortgage: 20
Median monthly owner costs for units with a mortgage: $1,271 Median monthly owner costs for units without a mortgage: $309
Residents with income below the poverty level in 2022:
This zip code:
11.1%
Whole state:
10.6%
Residents with income below 50% of the poverty level in 2022:
This zip code:
7.8%
Whole state:
5.2%
Median number of rooms in houses and condos:
Here:
6.1
State:
7.0
Median number of rooms in apartments:
Here:
4.8
State:
4.3
Notable locations in this zip code not listed on our city pages
Churches in zip code 24538 include: Bethel Church (A), Saint Lukes Church (B), Earlys Chapel (C), Trinity Church (D), Hebron Baptist Church (E), Mount Obed Church (F), Mount Zion Church (G), New Concord Church (H), Peaceful Grove Baptist Church (I). Display/hide their locations on the map
Streams, rivers, and creeks: Stonewall Creek (A), Slippery Branch (B), Rattlesnake Creek (C), Pulliam Branch (D), Plum Branch (E), Mill Creek (F), Maple Branch (G), Long Branch (H), Jerrys Branch (I). Display/hide their locations on the map
In group quarters: 14 (-1 institutionalized population)
Size of family households: 700 2-persons, 228 3-persons, 187 4-persons, 103 5-persons, 46 6-persons, 31 7-or-more-persons
Size of nonfamily households: 480 1-person, 192 2-persons
584 married couples with children.
81 single-parent households (32 men, 49 women).
98.6% of residents of 24538 zip code speak English at home.
1.0% of residents speak Spanish at home (4% very well, 96% well).
0.2% of residents speak other Indo-European language at home (100% very well).
0.2% of residents speak Asian or Pacific Island language at home (100% very well).
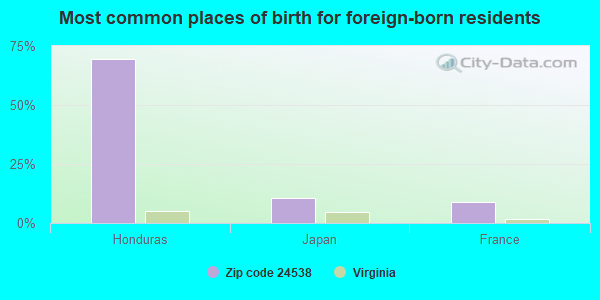
Foreign born population: 54 (1.1%) (27.1% of them are naturalized citizens)
This zip code:
1.1%
Whole state:
12.7%
70%Honduras
11%Japan
9%France
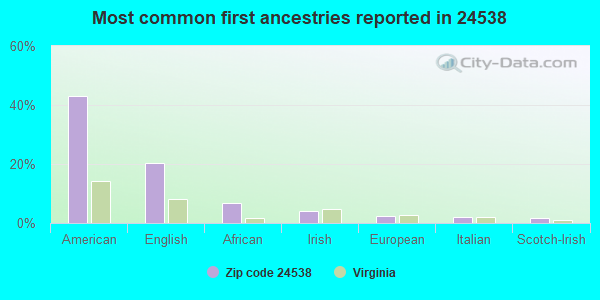
43%American
20%English
7%African
4%Irish
2%European
2%Italian
2%Scotch-Irish
Year of entry for the foreign-born population
572010 or later
962000 to 2009
01990 to 1999
24Before 1990
Facilities with environmental interests located in this zip code:
CAMPBELL COUNTY SCHOOLS CONCORD ELEMENTARY (9339 VILLAGE HIGHWAY in CONCORD, VA)
AIR MINOR (AIRS/AFS) STATE MASTER (Virginia pollutants databases) - CEDS-30206, AIR PROGRAM (National Center for Education Statistics) - STATE ID-0160130 Business SIC and NAICS classification: ELEMENTARY AND SECONDARY SCHOOLS Organizations: CAMPBELL COUNTY PUBLIC SCHOOLS (SCHOOL DISTRICT)
Alternative names: CONCORD ELEMENTARY SCHOOL
AIR MINOR (AIRS/AFS) STATE MASTER (Virginia pollutants databases) - CEDS-32025, AIR PROGRAM Business SIC classification: READY-MIXED CONCRETE Business NAICS classification: READY-MIX CONCRETE MANUFACTURING.
BOXLEY MATERIALS COMPANY - MOUNT ATHOS PLANT (1229 STAGE ROAD in CONCORD, VA)
AIR SYNTHETIC MINOR (AIRS/AFS) STATE MASTER (Virginia pollutants databases) - CEDS-30193, AIR PROGRAM Business SIC and NAICS classification: CRUSHED AND BROKEN GRANITE Alternative names: BLUE RIDGE STONE CORPORATION CONCORD PLANT, BLUE RIDGE STONE CORP CONCORD PLT
CHESAPEAKE & POTOMAC TELEPHONE CO (STGATE HIGHWAY 24 in CONCORD, VA)
(Resource Conservation and Recovery Act (tracking hazardous waste)) Organizations: OPERNAME (CONTACT/OPERATOR)
, CHESAPEAKE & POTOMAC TELEPHONE COMPANY (CONTACT/OWNER)
BOHANNON ELECTRIC HEATING & AIR (RT. 2 BOX 8-S in CONCORD, VA)
AIR MINOR (AIRS/AFS) Business SIC classification: AUTOMOTIVE REPAIR SHOPS
Housing units lacking complete plumbing facilities: 3.3% Housing units lacking complete kitchen facilities: 5.8%
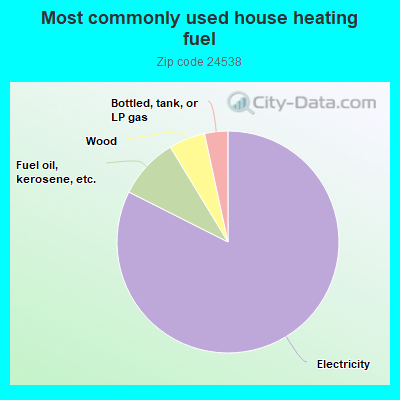
82.6%Electricity
8.9%Fuel oil, kerosene, etc.
5.3%Wood
3.4%Bottled, tank, or LP gas
Population in 1990: 3,845.
Place of birth for U.S.-born residents:
This state: 3,554
Northeast: 248
Midwest: 93
South: 514
West: 164
67% of the 24538 zip code residents lived in the same house 5 years ago. Out of people who lived in different houses, 50% lived in this county. Out of people who lived in different counties, 50% lived in Virginia.
96% of the 24538 zip code residents lived in the same house 1 year ago. Out of people who lived in different houses, 111% moved from different county within same state. Out of people who lived in different houses, 2% moved from abroad.
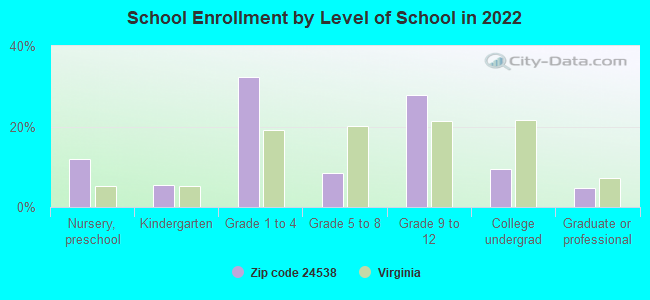
Private vs. public school enrollment:
Students in private schools in grades 1 to 8 (elementary and middle school): 101
Here:
28.2%
Virginia:
13.2%
Students in private schools in grades 9 to 12 (high school): 48
Here:
20.1%
Virginia:
10.2%
Students in private undergraduate colleges: 2
Here:
3.2%
Virginia:
18.7%
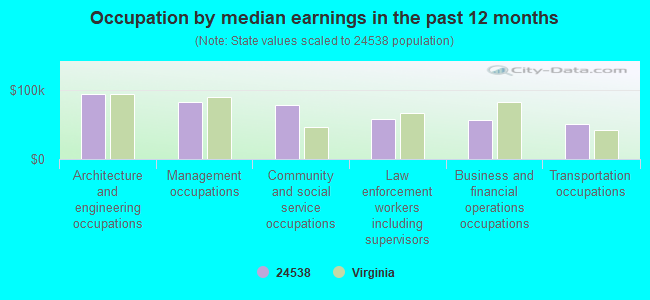
Occupation by median earnings in the past 12 months ($)
94,137Architecture and engineering occupations
82,622Management occupations
78,476Community and social service occupations
57,138Law enforcement workers including supervisors
55,917Business and financial operations occupations
50,238Transportation occupations
Companies with federal contracts located in this zip code:
BALANCEMASTER, INC (2246 TOLL GATE RD in CONCORD, VA; small business)
$29,330 with Air Force for Miscellaneous Machine Tools. Signed on 2004-10-25. Completion date: 2004-12-06.
Top industries in this zip code by the number of employees in 2005:
Construction: Other Heavy and Civil Engineering Construction (50-99 employees: 1 establishment)
Construction: Plumbing, Heating, and Air-Conditioning Contractors (20-49: 2, 1-4: 1)
Construction: Highway, Street, and Bridge Construction (20-49: 1, 5-9: 1, 1-4: 1)
Other Services (except Public Administration): Religious Organizations (10-19: 1, 5-9: 2, 1-4: 5)
Construction: Painting and Wall Covering Contractors (10-19: 1, 1-4: 2)
Wholesale Trade: Service Establishment Equipment and Supplies Merchant Wholesalers (10-19: 1)
Mining: Crushed and Broken Limestone Mining and Quarrying (10-19: 1)
People in group quarters in 2010:
7 people in group homes intended for adults
Fatal accident statistics in 2013:
Fatal accident count: 1
Vehicles involved in fatal accidents: 1
Fatal accidents caused by drunken drivers: 0
Fatalities: 1
Persons involved in fatal accidents: 1
Pedestrians involved in fatal accidents: 0
Fatal accident statistics in 2010:
Fatal accident count: 1
Vehicles involved in fatal accidents: 1
Fatal accidents caused by drunken drivers: 0
Fatalities: 1
Persons involved in fatal accidents: 1
Pedestrians involved in fatal accidents: 0
Home Mortgage Disclosure Act Aggregated Statistics For Year 2009 (Based on 4 partial tracts)
A) FHA, FSA/RHS & VA Home Purchase Loans
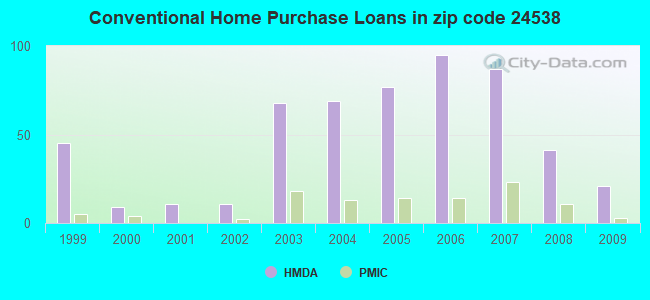
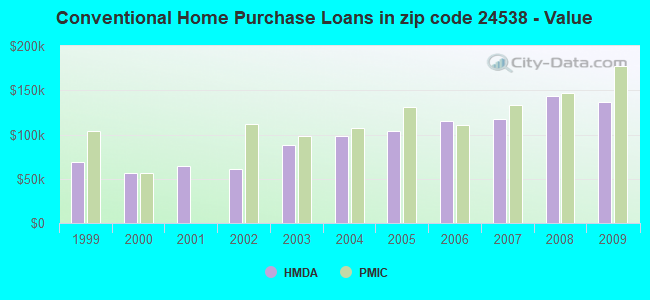
B) Conventional Home Purchase Loans
C) Refinancings
D) Home Improvement Loans
F) Non-occupant Loans on < 5 Family Dwellings (A B C & D)
G) Loans On Manufactured Home Dwelling (A B C & D)
Number
Average Value
Number
Average Value
Number
Average Value
Number
Average Value
Number
Average Value
Number
Average Value
LOANS ORIGINATED
43
$150,744
21
$137,067
154
$135,643
18
$35,694
12
$109,605
17
$79,148
APPLICATIONS APPROVED, NOT ACCEPTED
1
$132,020
2
$139,730
7
$114,326
0
$0
0
$0
1
$63,650
APPLICATIONS DENIED
8
$146,945
5
$93,750
66
$132,021
6
$33,535
3
$57,643
9
$63,394
APPLICATIONS WITHDRAWN
1
$96,630
2
$90,405
25
$126,248
1
$83,320
1
$55,650
1
$138,290
FILES CLOSED FOR INCOMPLETENESS
1
$138,290
1
$57,860
8
$157,240
0
$0
1
$130,190
1
$147,540
Aggregated Statistics For Year 2008 (Based on 4 partial tracts)
A) FHA, FSA/RHS & VA Home Purchase Loans
B) Conventional Home Purchase Loans
C) Refinancings
D) Home Improvement Loans
F) Non-occupant Loans on < 5 Family Dwellings (A B C & D)
G) Loans On Manufactured Home Dwelling (A B C & D)
Number
Average Value
Number
Average Value
Number
Average Value
Number
Average Value
Number
Average Value
Number
Average Value
LOANS ORIGINATED
33
$129,259
41
$143,969
117
$131,719
19
$48,141
16
$160,963
24
$80,551
APPLICATIONS APPROVED, NOT ACCEPTED
1
$170,690
1
$315,920
21
$87,109
1
$47,730
0
$0
1
$77,530
APPLICATIONS DENIED
3
$122,167
7
$108,793
73
$118,380
15
$80,281
3
$95,047
16
$82,142
APPLICATIONS WITHDRAWN
4
$140,660
6
$150,328
30
$130,146
3
$51,313
1
$57,860
3
$79,723
FILES CLOSED FOR INCOMPLETENESS
1
$40,500
1
$67,120
7
$127,624
1
$4,050
1
$76,370
1
$106,460
Aggregated Statistics For Year 2007 (Based on 4 partial tracts)
A) FHA, FSA/RHS & VA Home Purchase Loans
B) Conventional Home Purchase Loans
C) Refinancings
D) Home Improvement Loans
E) Loans on Dwellings For 5+ Families
F) Non-occupant Loans on < 5 Family Dwellings (A B C & D)
G) Loans On Manufactured Home Dwelling (A B C & D)
Number
Average Value
Number
Average Value
Number
Average Value
Number
Average Value
Number
Average Value
Number
Average Value
Number
Average Value
LOANS ORIGINATED
17
$112,069
87
$117,427
136
$103,644
45
$52,493
1
$135,390
19
$85,127
33
$70,025
APPLICATIONS APPROVED, NOT ACCEPTED
2
$76,320
6
$112,258
29
$80,149
6
$31,268
0
$0
5
$83,128
3
$96,047
APPLICATIONS DENIED
0
$0
17
$116,221
114
$106,257
29
$44,270
0
$0
6
$72,475
27
$68,528
APPLICATIONS WITHDRAWN
2
$116,875
11
$138,899
57
$103,927
6
$46,732
0
$0
5
$100,510
7
$74,897
FILES CLOSED FOR INCOMPLETENESS
1
$74,640
3
$91,877
9
$149,420
1
$89,680
0
$0
1
$56,700
0
$0
Aggregated Statistics For Year 2006 (Based on 4 partial tracts)
A) FHA, FSA/RHS & VA Home Purchase Loans
B) Conventional Home Purchase Loans
C) Refinancings
D) Home Improvement Loans
E) Loans on Dwellings For 5+ Families
F) Non-occupant Loans on < 5 Family Dwellings (A B C & D)
G) Loans On Manufactured Home Dwelling (A B C & D)
Number
Average Value
Number
Average Value
Number
Average Value
Number
Average Value
Number
Average Value
Number
Average Value
Number
Average Value
LOANS ORIGINATED
12
$122,596
95
$114,891
137
$100,721
25
$46,508
1
$280,620
15
$82,517
30
$74,824
APPLICATIONS APPROVED, NOT ACCEPTED
1
$39,340
13
$78,426
25
$105,701
3
$71,747
0
$0
2
$56,555
9
$66,747
APPLICATIONS DENIED
6
$78,005
26
$82,877
141
$98,844
30
$32,334
0
$0
2
$47,120
47
$64,217
APPLICATIONS WITHDRAWN
2
$107,755
7
$65,250
80
$120,914
4
$71,228
0
$0
0
$0
7
$62,373
FILES CLOSED FOR INCOMPLETENESS
1
$68,270
1
$112,250
12
$111,181
1
$28,930
0
$0
0
$0
2
$87,370
Aggregated Statistics For Year 2005 (Based on 4 partial tracts)
A) FHA, FSA/RHS & VA Home Purchase Loans
B) Conventional Home Purchase Loans
C) Refinancings
D) Home Improvement Loans
F) Non-occupant Loans on < 5 Family Dwellings (A B C & D)
G) Loans On Manufactured Home Dwelling (A B C & D)
Number
Average Value
Number
Average Value
Number
Average Value
Number
Average Value
Number
Average Value
Number
Average Value
LOANS ORIGINATED
21
$104,180
77
$104,152
138
$95,520
28
$35,688
10
$79,135
36
$70,056
APPLICATIONS APPROVED, NOT ACCEPTED
2
$72,035
14
$74,976
42
$140,775
7
$57,734
2
$1,199,150
9
$44,607
APPLICATIONS DENIED
5
$94,874
29
$78,850
134
$90,233
27
$29,711
6
$75,603
37
$59,228
APPLICATIONS WITHDRAWN
1
$3,470
5
$115,142
59
$92,968
6
$75,463
2
$62,200
9
$78,524
FILES CLOSED FOR INCOMPLETENESS
1
$129,960
3
$89,297
10
$102,942
1
$93,730
0
$0
1
$48,020
Aggregated Statistics For Year 2004 (Based on 4 partial tracts)
A) FHA, FSA/RHS & VA Home Purchase Loans
B) Conventional Home Purchase Loans
C) Refinancings
D) Home Improvement Loans
F) Non-occupant Loans on < 5 Family Dwellings (A B C & D)
G) Loans On Manufactured Home Dwelling (A B C & D)
Number
Average Value
Number
Average Value
Number
Average Value
Number
Average Value
Number
Average Value
Number
Average Value
LOANS ORIGINATED
22
$98,915
69
$98,497
175
$86,549
25
$21,908
21
$72,198
27
$57,906
APPLICATIONS APPROVED, NOT ACCEPTED
2
$52,940
12
$71,922
36
$72,606
6
$21,443
2
$155,420
9
$42,169
APPLICATIONS DENIED
5
$70,088
28
$58,662
132
$89,587
33
$26,390
5
$57,282
39
$58,668
APPLICATIONS WITHDRAWN
2
$107,330
7
$97,140
65
$95,619
5
$36,712
2
$74,395
9
$81,457
FILES CLOSED FOR INCOMPLETENESS
1
$116,880
1
$98,940
9
$98,222
1
$96,050
0
$0
1
$70,590
Aggregated Statistics For Year 2003 (Based on 4 partial tracts)
A) FHA, FSA/RHS & VA Home Purchase Loans
B) Conventional Home Purchase Loans
C) Refinancings
D) Home Improvement Loans
E) Loans on Dwellings For 5+ Families
F) Non-occupant Loans on < 5 Family Dwellings (A B C & D)
Number
Average Value
Number
Average Value
Number
Average Value
Number
Average Value
Number
Average Value
Number
Average Value
LOANS ORIGINATED
22
$99,601
68
$87,614
301
$93,326
28
$46,215
1
$141,760
22
$69,818
APPLICATIONS APPROVED, NOT ACCEPTED
1
$62,810
16
$65,851
38
$84,765
3
$21,143
0
$0
1
$7,520
APPLICATIONS DENIED
4
$72,605
50
$61,284
117
$80,261
17
$19,782
0
$0
4
$36,125
APPLICATIONS WITHDRAWN
0
$0
7
$103,409
48
$96,732
1
$10,990
0
$0
1
$57,170
FILES CLOSED FOR INCOMPLETENESS
0
$0
1
$34,140
13
$95,705
0
$0
0
$0
2
$50,050
Aggregated Statistics For Year 2002 (Based on 2 partial tracts)
A) FHA, FSA/RHS & VA Home Purchase Loans
B) Conventional Home Purchase Loans
C) Refinancings
D) Home Improvement Loans
F) Non-occupant Loans on < 5 Family Dwellings (A B C & D)
Number
Average Value
Number
Average Value
Number
Average Value
Number
Average Value
Number
Average Value
LOANS ORIGINATED
3
$103,803
11
$60,850
29
$69,041
4
$10,820
5
$39,048
APPLICATIONS APPROVED, NOT ACCEPTED
0
$0
3
$49,677
5
$70,092
0
$0
0
$0
APPLICATIONS DENIED
3
$61,717
7
$58,619
21
$63,639
5
$8,656
2
$32,050
APPLICATIONS WITHDRAWN
0
$0
1
$55,320
9
$65,333
1
$10,090
0
$0
FILES CLOSED FOR INCOMPLETENESS
0
$0
0
$0
1
$23,100
0
$0
0
$0
Aggregated Statistics For Year 2001 (Based on 2 partial tracts)
A) FHA, FSA/RHS & VA Home Purchase Loans
B) Conventional Home Purchase Loans
C) Refinancings
D) Home Improvement Loans
F) Non-occupant Loans on < 5 Family Dwellings (A B C & D)
Number
Average Value
Number
Average Value
Number
Average Value
Number
Average Value
Number
Average Value
LOANS ORIGINATED
2
$74,190
11
$63,985
27
$67,503
7
$13,201
2
$41,815
APPLICATIONS APPROVED, NOT ACCEPTED
0
$0
4
$43,930
4
$70,042
1
$16,920
0
$0
APPLICATIONS DENIED
0
$0
9
$59,042
19
$70,903
5
$13,276
3
$80,917
APPLICATIONS WITHDRAWN
1
$52,060
2
$54,015
11
$61,382
0
$0
0
$0
FILES CLOSED FOR INCOMPLETENESS
0
$0
0
$0
2
$65,730
0
$0
0
$0
Aggregated Statistics For Year 2000 (Based on 2 partial tracts)
A) FHA, FSA/RHS & VA Home Purchase Loans
B) Conventional Home Purchase Loans
C) Refinancings
D) Home Improvement Loans
F) Non-occupant Loans on < 5 Family Dwellings (A B C & D)
Number
Average Value
Number
Average Value
Number
Average Value
Number
Average Value
Number
Average Value
LOANS ORIGINATED
2
$59,710
9
$56,692
8
$56,212
7
$19,013
3
$27,983
APPLICATIONS APPROVED, NOT ACCEPTED
1
$58,570
3
$60,200
5
$49,396
0
$0
0
$0
APPLICATIONS DENIED
0
$0
9
$49,641
17
$54,456
4
$12,040
1
$35,470
APPLICATIONS WITHDRAWN
0
$0
1
$63,780
4
$44,905
0
$0
0
$0
FILES CLOSED FOR INCOMPLETENESS
0
$0
0
$0
1
$21,150
0
$0
0
$0
Aggregated Statistics For Year 1999 (Based on 2 partial tracts)
A) FHA, FSA/RHS & VA Home Purchase Loans
B) Conventional Home Purchase Loans
C) Refinancings
D) Home Improvement Loans
F) Non-occupant Loans on < 5 Family Dwellings (A B C & D)
Detailed PMIC statistics for the following Tracts:0201.00
, 0209.00
2002 - 2018 National Fire Incident Reporting System (NFIRS) incidents
Based on the data from the years 2002 - 2018 the average number of fire incidents per year is 31. The highest number of fires - 52 took place in 2007, and the least - 15 in 2013. The data has a declining trend.
When looking into fire subcategories, the most incidents belonged to: Outside Fires (47.1%), and Structure Fires (36.9%).
Fire incident types reported to NFIRS in Zip Code 24538
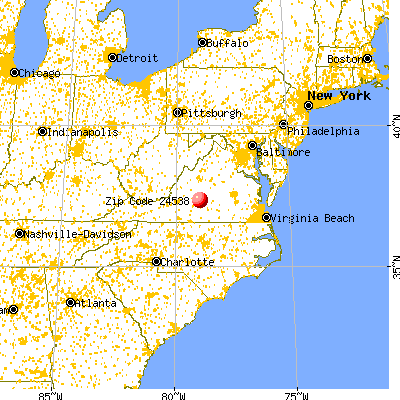


 Nearest zip codes: 24593, 24504, 24588, 24572, 24501, 24522.


 Based on the data from the years 2002 - 2018 the average number of fire incidents per year is 31. The highest number of fires - 52 took place in 2007, and the least - 15 in 2013. The data has a declining trend.
 When looking into fire subcategories, the most incidents belonged to: Outside Fires (47.1%), and Structure Fires (36.9%).