Estimated zip code population in 2022: 13,087 Zip code population in 2010: 12,661 Zip code population in 2000: 10,969
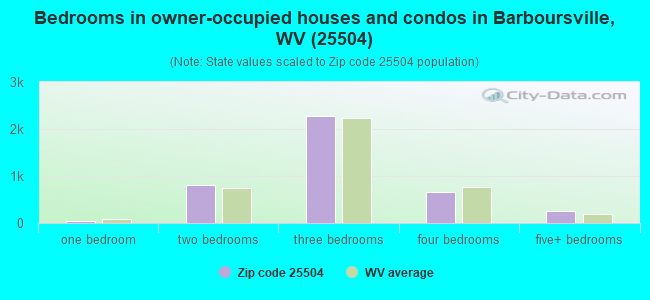
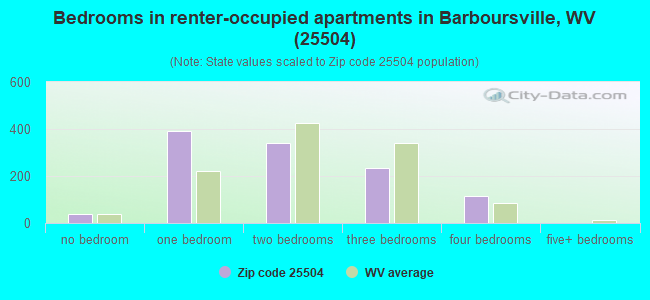
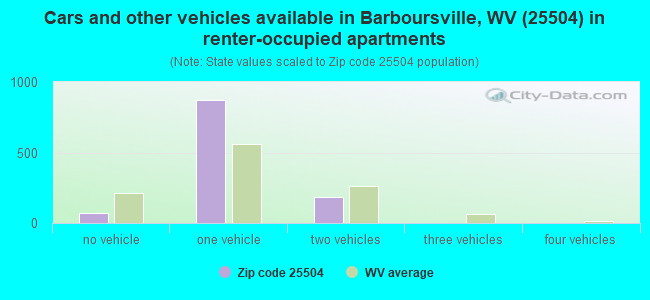
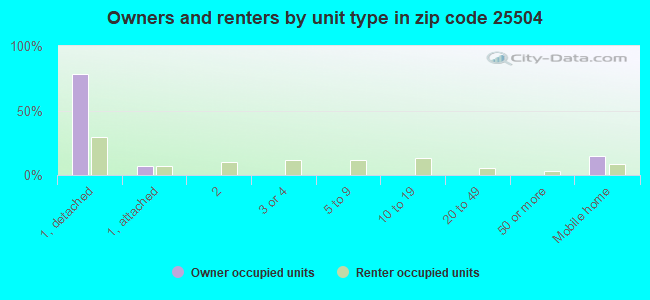
Houses and condos: 5,705 Renter-occupied apartments: 1,116
% of renters here:
22%
State:
26%
March 2022 cost of living index in zip code 25504: 83.4 (less than average, U.S. average is 100)
Land area: 49.6 sq. mi. Water area: 0.5 sq. mi.
Population density: 264 people per square mile
(very low).
OSM Map
General Map
Google Map
MSN Map
OSM Map
General Map
Google Map
MSN Map
OSM Map
General Map
Google Map
MSN Map
OSM Map
General Map
Google Map
MSN Map
Please wait while loading the map...
Real estate property taxes paid for housing units in 2022:
This zip code:
0.6% ($968)
West Virginia:
0.5% ($821)
Median real estate property taxes paid for housing units with mortgages in 2022: $1,096 (0.6%) Median real estate property taxes paid for housing units with no mortgage in 2022: $846 (0.6%)
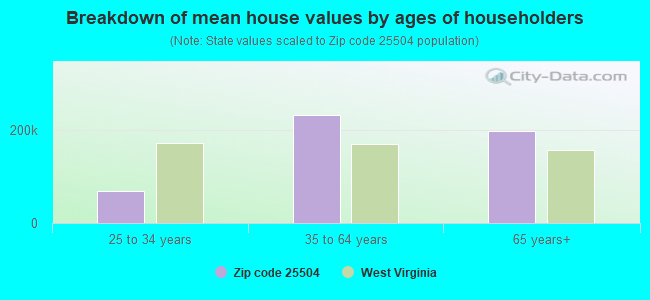
Estimated median house/condo value in 2022: $170,312
25504:
$170,312
West Virginia:
$155,100
According to our research of West Virginia and other state lists, there were 29 registered sex offenders living in 25504 zip code as of April 25, 2024. The ratio of all residents to sex offenders in zip code 25504 is 450 to 1. The ratio of registered sex offenders to all residents in this zip code is lower than the state average.
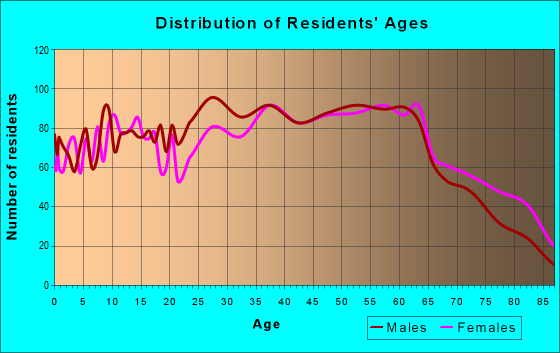
Median resident age:
This zip code:
39.1 years
West Virginia median age:
42.9 years
Average household size:
This zip code:
2.4 people
West Virginia:
2.3 people
Averages for the 2020 tax year for zip code 25504, filed in 2021:
Average Adjusted Gross Income (AGI) in 2020: $75,338 (Individual Income Tax Returns)
Here:
$75,338
State:
$56,292
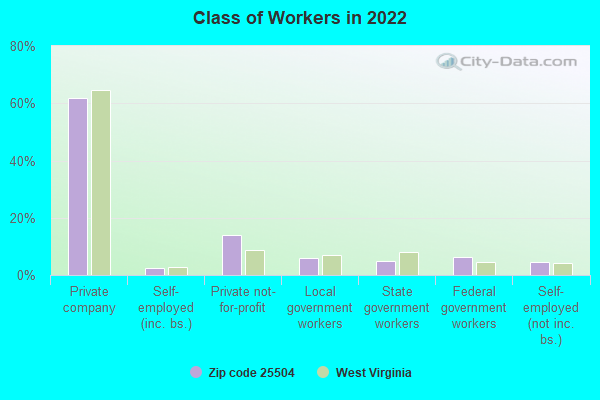
Salary/wage: $58,847 (reported on 78.7% of returns)
Here:
$58,847
State:
$49,093
(% of AGI for various income ranges: 1032.5% for AGIs below $25k, 3313.5% for AGIs $25k-50k, 5841.5% for AGIs $50k-75k, 8653.4% for AGIs $75k-100k, 15937.6% for AGIs $100k-200k, 83442.5% for AGIs over 200k)
Taxable interest for individuals: $2,115 (reported on 29.3% of returns)
This zip code:
$2,115
West Virginia:
$1,141
(% of AGI for various income ranges: 22.3% for AGIs below $25k, 41.7% for AGIs $25k-50k, 41.5% for AGIs $50k-75k, 44.9% for AGIs $75k-100k, 173.5% for AGIs $100k-200k, 1870.0% for AGIs over 200k)
Ordinary dividends: $8,491 (reported on 14.5% of returns)
Here:
$8,491
State:
$5,456
(% of AGI for various income ranges: 12.8% for AGIs below $25k, 26.2% for AGIs $25k-50k, 66.4% for AGIs $50k-75k, 99.5% for AGIs $75k-100k, 246.5% for AGIs $100k-200k, 5615.0% for AGIs over 200k)
Net capital gain/loss in AGI: +$12,132 (reported on 12.9% of returns)
Here:
+$12,132
State:
+$11,656
(% of AGI for various income ranges: 8.2% for AGIs below $25k, 16.2% for AGIs $25k-50k, 32.7% for AGIs $50k-75k, 89.3% for AGIs $75k-100k, 314.3% for AGIs $100k-200k, 8058.8% for AGIs over 200k)
Profit/loss from business: +$17,705 (reported on 10.9% of returns)
Here:
+$17,705
State:
+$12,084
(% of AGI for various income ranges: 86.6% for AGIs below $25k, 77.4% for AGIs $25k-50k, 121.2% for AGIs $50k-75k, 204.1% for AGIs $75k-100k, 445.2% for AGIs $100k-200k, 6478.7% for AGIs over 200k)
Taxable individual retirement arrangement distribution: $16,056 (reported on 9.8% of returns)
25504:
$16,056
West Virginia:
$15,311
(% of AGI for various income ranges: 60.2% for AGIs below $25k, 116.3% for AGIs $25k-50k, 202.7% for AGIs $50k-75k, 258.8% for AGIs $75k-100k, 581.1% for AGIs $100k-200k, 2311.2% for AGIs over 200k)
Total itemized deductions: $36,568 (reported on 4.5% of returns)
Here:
$36,568
State:
$31,950
(% of AGI for various income ranges: 64.3% for AGIs $25k-50k, 103.2% for AGIs $50k-75k, 161.0% for AGIs $75k-100k, 541.5% for AGIs $100k-200k, 5891.2% for AGIs over 200k)
Charity contributions: $14,291 (reported on 3.9% of returns)
Here:
$14,291
State:
$12,364
(% of AGI for various income ranges: 16.0% for AGIs $25k-50k, 57.6% for AGIs $75k-100k, 144.6% for AGIs $100k-200k, 2596.2% for AGIs over 200k)
Taxes paid: $8,512 (reported on 4.5% of returns)
25504:
$8,512
State:
$7,665
(% of AGI for various income ranges: 8.4% for AGIs $25k-50k, 15.6% for AGIs $50k-75k, 51.0% for AGIs $75k-100k, 152.4% for AGIs $100k-200k, 1298.8% for AGIs over 200k)
Earned income credit: $2,074 (reported on 14.5% of returns)
Here:
$2,074
State:
$2,258
(% of AGI for various income ranges: 71.9% for AGIs below $25k, 64.7% for AGIs $25k-50k)
Percentage of individuals using paid preparers for their 2020 taxes: 93.6%
Here:
94%
State:
93%
(% for various income ranges: 93.4% for AGIs below $25k, 95.3% for AGIs $25k-50k, 91.1% for AGIs $50k-75k, 94.6% for AGIs $75k-100k, 93.3% for AGIs $100k-200k, 92.0% for AGIs over 200k)
Averages for the 2012 tax year for zip code 25504, filed in 2013:
Average Adjusted Gross Income (AGI) in 2012: $56,582 (Individual Income Tax Returns)
Here:
$56,582
State:
$48,628
Salary/wage: $48,974 (reported on 82.4% of returns)
Here:
$48,974
State:
$42,328
(% of AGI for various income ranges: 70.2% for AGIs below $25k, 77.5% for AGIs $25k-50k, 78.2% for AGIs $50k-75k, 76.1% for AGIs $75k-100k, 78.8% for AGIs $100k-200k, 53.4% for AGIs over 200k)
Taxable interest for individuals: $1,826 (reported on 30.8% of returns)
This zip code:
$1,826
West Virginia:
$1,211
(% of AGI for various income ranges: 1.3% for AGIs below $25k, 0.8% for AGIs $25k-50k, 0.5% for AGIs $50k-75k, 0.5% for AGIs $75k-100k, 0.9% for AGIs $100k-200k, 1.8% for AGIs over 200k)
Ordinary dividends: $4,222 (reported on 15.6% of returns)
Here:
$4,222
State:
$4,262
(% of AGI for various income ranges: 1.1% for AGIs below $25k, 0.9% for AGIs $25k-50k, 0.8% for AGIs $50k-75k, 0.9% for AGIs $75k-100k, 0.6% for AGIs $100k-200k, 2.4% for AGIs over 200k)
Net capital gain/loss in AGI: +$4,744 (reported on 11.5% of returns)
Here:
+$4,744
State:
+$8,875
(% of AGI for various income ranges: 0.2% for AGIs $75k-100k, 1.1% for AGIs $100k-200k, 2.9% for AGIs over 200k)
Profit/loss from business: +$12,864 (reported on 12.0% of returns)
Here:
+$12,864
State:
+$13,636
(% of AGI for various income ranges: 4.2% for AGIs below $25k, 2.8% for AGIs $25k-50k, 1.7% for AGIs $50k-75k, 2.0% for AGIs $75k-100k, 2.7% for AGIs $100k-200k, 3.3% for AGIs over 200k)
Taxable individual retirement arrangement distribution: $13,031 (reported on 9.7% of returns)
25504:
$13,031
West Virginia:
$11,787
(% of AGI for various income ranges: 3.0% for AGIs below $25k, 2.1% for AGIs $25k-50k, 2.5% for AGIs $50k-75k, 2.5% for AGIs $75k-100k, 2.4% for AGIs $100k-200k, 1.6% for AGIs over 200k)
Self-employment retirement plans: $13,650 (reported on 0.4% of returns)
25504:
$13,650
West Virginia:
$24,483
Total itemized deductions: $22,853 (17% of AGI, reported on 22.2% of returns)
Here:
$22,853
State:
$21,148
Here:
17.2% of AGI
State:
18.1% of AGI
(% of AGI for various income ranges: 4.4% for AGIs below $25k, 6.0% for AGIs $25k-50k, 6.4% for AGIs $50k-75k, 8.3% for AGIs $75k-100k, 11.8% for AGIs $100k-200k, 11.9% for AGIs over 200k)
Charity contributions: $4,839 (reported on 16.7% of returns)
Here:
$4,839
State:
$4,508
(% of AGI for various income ranges: 0.4% for AGIs below $25k, 0.7% for AGIs $25k-50k, 0.9% for AGIs $50k-75k, 1.2% for AGIs $75k-100k, 2.0% for AGIs $100k-200k, 2.2% for AGIs over 200k)
Taxes paid: $9,576 (reported on 22.0% of returns)
25504:
$9,576
State:
$8,103
(% of AGI for various income ranges: 0.5% for AGIs below $25k, 1.1% for AGIs $25k-50k, 1.7% for AGIs $50k-75k, 2.7% for AGIs $75k-100k, 5.1% for AGIs $100k-200k, 7.2% for AGIs over 200k)
Earned income credit: $2,035 (reported on 17.2% of returns)
Here:
$2,035
State:
$2,140
(% of AGI for various income ranges: 5.5% for AGIs below $25k, 1.0% for AGIs $25k-50k)
Percentage of individuals using paid preparers for their 2012 taxes: 55.0%
Here:
55%
State:
49%
(% for various income ranges: 51.4% for AGIs below $25k, 55.0% for AGIs $25k-50k, 53.8% for AGIs $50k-75k, 59.6% for AGIs $75k-100k, 57.4% for AGIs $100k-200k, 87.5% for AGIs over 200k)
Averages for the 2004 tax year for zip code 25504, filed in 2005:
Average Adjusted Gross Income (AGI) in 2004: $42,413 (Individual Income Tax Returns)
Here:
$42,413
State:
$37,498
Salary/wage: $38,589 (reported on 84.4% of returns)
Here:
$38,589
State:
$33,645
(% of AGI for various income ranges: 114.9% for AGIs below $10k, 71.0% for AGIs $10k-25k, 79.9% for AGIs $25k-50k, 82.1% for AGIs $50k-75k, 85.0% for AGIs $75k-100k, 65.7% for AGIs over 100k)
Taxable interest for individuals: $1,571 (reported on 44.6% of returns)
This zip code:
$1,571
West Virginia:
$1,465
(% of AGI for various income ranges: 4.5% for AGIs below $10k, 2.7% for AGIs $10k-25k, 1.4% for AGIs $25k-50k, 1.1% for AGIs $50k-75k, 0.8% for AGIs $75k-100k, 2.1% for AGIs over 100k)
Taxable dividends: $2,167 (reported on 17.3% of returns)
Here:
$2,167
State:
$2,913
(% of AGI for various income ranges: 1.6% for AGIs below $10k, 0.9% for AGIs $10k-25k, 0.5% for AGIs $25k-50k, 0.8% for AGIs $50k-75k, 0.7% for AGIs $75k-100k, 1.3% for AGIs over 100k)
Net capital gain/loss: +$3,797 (reported on 13.2% of returns)
Here:
+$3,797
State:
+$6,331
(% of AGI for various income ranges: -1.0% for AGIs below $10k, -0.1% for AGIs $10k-25k, 0.4% for AGIs $25k-50k, 0.7% for AGIs $50k-75k, 1.2% for AGIs $75k-100k, 2.8% for AGIs over 100k)
Profit/loss from business: +$10,748 (reported on 12.2% of returns)
Here:
+$10,748
State:
+$11,074
(% of AGI for various income ranges: 3.3% for AGIs below $10k, 3.0% for AGIs $10k-25k, 1.8% for AGIs $25k-50k, 2.1% for AGIs $50k-75k, 2.3% for AGIs $75k-100k, 5.2% for AGIs over 100k)
IRA payment deduction: $2,932 (reported on 2.3% of returns)
25504:
$2,932
West Virginia:
$2,796
(% of AGI for various income ranges: 0.3% for AGIs $10k-25k, 0.2% for AGIs $25k-50k, 0.3% for AGIs $50k-75k, 0.1% for AGIs over 100k)
Self-employed pension: $10,952 (reported on 0.4% of returns)
Here:
$10,952
West Virginia:
$18,181
Total itemized deductions: $17,965 (19% of AGI, reported on 22.1% of returns)
Here:
$17,965
State:
$16,976
Here:
18.8% of AGI
State:
19.0% of AGI
(% of AGI for various income ranges: 3.6% for AGIs below $10k, 4.1% for AGIs $10k-25k, 5.7% for AGIs $25k-50k, 9.5% for AGIs $50k-75k, 11.8% for AGIs $75k-100k, 12.9% for AGIs over 100k)
Charity contributions deductions: $3,702 (4% of AGI, reported on 18.5% of returns)
Here:
$3,702
State:
$3,529
Here:
3.7% of AGI
State:
3.7% of AGI
(% of AGI for various income ranges: 0.7% for AGIs $10k-25k, 0.7% for AGIs $25k-50k, 1.6% for AGIs $50k-75k, 1.9% for AGIs $75k-100k, 2.6% for AGIs over 100k)
Total tax: $6,327 (reported on 74.9% of returns)
25504:
$6,327
State:
$5,372
(% of AGI for various income ranges: 2.2% for AGIs below $10k, 3.8% for AGIs $10k-25k, 6.7% for AGIs $25k-50k, 8.7% for AGIs $50k-75k, 10.5% for AGIs $75k-100k, 19.9% for AGIs over 100k)
Earned income credit: $1,529 (reported on 14.7% of returns)
Here:
$1,529
State:
$1,662
Percentage of individuals using paid preparers for their 2004 taxes: 52.5%
Here:
53%
State:
55%
(% for various income ranges: 42.8% for AGIs below $10k, 54.5% for AGIs $10k-25k, 55.5% for AGIs $25k-50k, 52.5% for AGIs $50k-75k, 52.4% for AGIs $75k-100k, 64.3% for AGIs over 100k)
Household received Food Stamps/SNAP in the past 12 months: 614 Household did not receive Food Stamps/SNAP in the past 12 months: 4,514
Women who had a birth in the past 12 months: 110 (113 now married, 0 unmarried) Women who did not have a birth in the past 12 months: 3,224 (1,330 now married, 1,893 unmarried)
Housing units in zip code 25504 with a mortgage: 2,086 (203 second mortgage, 180 both second mortgage and home equity loan) Houses without a mortgage: 112
Median monthly owner costs for units with a mortgage: $1,195 Median monthly owner costs for units without a mortgage: $397
Residents with income below the poverty level in 2022:
This zip code:
13.3%
Whole state:
17.9%
Residents with income below 50% of the poverty level in 2022:
This zip code:
5.6%
Whole state:
9.7%
Median number of rooms in houses and condos:
Here:
6.5
State:
6.5
Median number of rooms in apartments:
Here:
4.4
State:
4.7
Notable locations in this zip code not listed on our city pages
Notable locations in zip code 25504: Orchard Hill Country Club (A), Roach (B), The Esquire Country Club Golf Course (C), Orchard Hills Golf and Country Club (D), Cabell County Emergency Medical Services 5 (E), Barboursville Branch Cabell County Library (F), Western Regional Jail (G), Barboursville Volunteer Fire Department (H). Display/hide their locations on the map
Churches in zip code 25504 include: Susannah Church (A), Bethel Church (B), Bloomingdale Church (C), Salem Church (D), Mays Chapel (E), Cyrus Creek Church (F), Davis Chapel (G), Pleasant Valley Church (H), Elmwood Church (I). Display/hide their locations on the map
Cemeteries: Hatfield Cemetery (1), Waugh Cemetery (2), Chapman Family Cemetery (3), Morrison Cemetery (4), Swann Cemetery (5), White Chapel Cemetery (6). Display/hide their locations on the map
Streams, rivers, and creeks: Tom Creek (A), Tanyard Branch (B), Swamp Branch (C), Sang Fork (D), Mud River (E), Mill Creek (F), Merritts Creek (G), Little Fudges Creek (H), Holland Creek (I). Display/hide their locations on the map
In group quarters: 928 (-1 institutionalized population)
Size of family households: 1,381 2-persons, 908 3-persons, 702 4-persons, 112 5-persons, 97 6-persons
Size of nonfamily households: 1,789 1-person, 156 2-persons, 6 4-persons
1,509 married couples with children.
770 single-parent households (112 men, 658 women).
96.8% of residents of 25504 zip code speak English at home.
1.1% of residents speak Spanish at home (78% very well, 3% well, 18% not well).
0.3% of residents speak other Indo-European language at home (26% very well, 74% well).
0.6% of residents speak Asian or Pacific Island language at home (79% very well, 21% not well).
1.1% of residents speak other language at home (45% very well, 55% well).
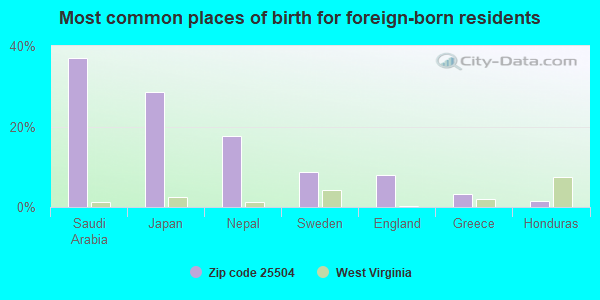
Foreign born population: 206 (1.6%) (66.0% of them are naturalized citizens)
This zip code:
1.6%
Whole state:
1.8%
37%Saudi Arabia
28%Japan
18%Nepal
9%Sweden
8%England
3%Greece
2%Honduras
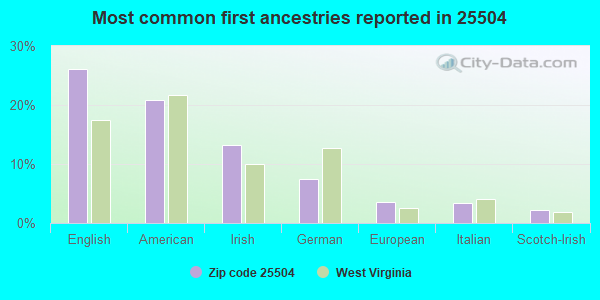
26%English
21%American
13%Irish
7%German
3%European
3%Italian
2%Scotch-Irish
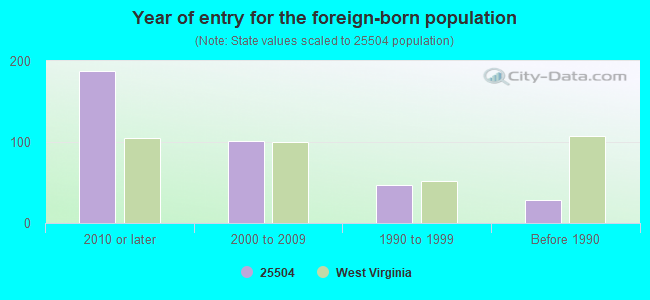
Year of entry for the foreign-born population
1882010 or later
1012000 to 2009
471990 to 1999
29Before 1990
Major facilities with environmental interests located in this zip code:
BARBOURSVILLE ELEMENTARY (718 CENTRAL AVENUE in BARBOURSVILLE, WV)
COMPLIANCE ACTIVITY (Tracking inspections of insecticide, fungicide, and rodenticide, and toxic substances) (National Center for Education Statistics) - STATE ID-12291 (National Center for Education Statistics) - STATE ID-12206 Organizations: CABELL COUNTY SCHOOL DISTRICT (SCHOOL DISTRICT)
BARBOURSVILLE SCHOOL (1535 MARTHA RD in BARBOURSVILLE, WV)
(Integrated Compliance Information System) - ICIS-03-1992-0011, FORMAL ENFORCEMENT ACTION COMPLIANCE ACTIVITY (Tracking inspections of insecticide, fungicide, and rodenticide, and toxic substances) (National Center for Education Statistics) - STATE ID-34103 Organizations: INSTITUTIONAL PROGRAMS (SCHOOL DISTRICT)
BARBOURSVILLE MIDDLE SCHOOL (1400 CENTRAL AVENUE in BARBOURSVILLE, WV)
(Geographic Names Information System) COMPLIANCE ACTIVITY (Tracking inspections of insecticide, fungicide, and rodenticide, and toxic substances) (National Center for Education Statistics) - STATE ID-12301 Organizations: CABELL COUNTY SCHOOL DISTRICT (SCHOOL DISTRICT)
DAVIS CREEK ELEMENTARY SCHOOL (6330 DAVIS CREEK RD in BARBOURSVILLE, WV)
(National Center for Education Statistics) - STATE ID-12224 Organizations: CABELL COUNTY SCHOOL DISTRICT (SCHOOL DISTRICT)
GEORGES DRY CLEANERS (6419 US ROUTE 60 E in BARBOURSVILLE, WV)
AIR MINOR (AIRS/AFS) (Resource Conservation and Recovery Act (tracking hazardous waste)) Business SIC classification: DRYCLEANING PLANTS, EXCEPT RUG CLEANING Organizations: OPERNAME (CONTACT/OPERATOR)
, COOK, DICK (CONTACT/OWNER)
Alternative names: GEORGES CLEANERS INC
CSX TRANSPORTATION, INC. (DEPOT STREET in BARBOURSVILLE, WV)
National Pollutant Discharge Elimination System NON-MAJOR (Tracking pollutant discharge elimination systems) - permit HAZARDOUS WASTE BIENNIAL REPORTER (Resource Conservation and Recovery Act (tracking hazardous waste)) Small Quantity Generators, between 100 kg and 1000 kg of hazardous waste/month (Resource Conservation and Recovery Act (tracking hazardous waste)) Business SIC classification: RAILROAD SWITCHING AND TERMINAL ESTABLISHMENTS Organizations: OPERNAME (CONTACT/OPERATOR)
BEECH FORK STATE PARK (5601 LONG BRANCH ROAD in BARBOURSVILLE, WV)
National Pollutant Discharge Elimination System NON-MAJOR (Tracking pollutant discharge elimination systems) - permit Business SIC classification: SPORTING AND RECREATIONAL CAMPS Organizations: WV DIVISION OF NATURAL RESOURC (CONTACT/OWNER)
Alternative names: WV DIVISION OF NATURAL RESOURC
BRADY HARDWARE (642 MAIN ST in BARBOURSVILLE, WV)
(Resource Conservation and Recovery Act (tracking hazardous waste)) Organizations: OPERNAME (CONTACT/OPERATOR)
, YEAGER JACK (CONTACT/OWNER)
COLLISION SPECIALISTS (5855 DAVIS CREEK RD in BARBOURSVILLE, WV)
(Resource Conservation and Recovery Act (tracking hazardous waste)) Business NAICS classification: AUTOMOTIVE BODY, PAINT, AND INTERIOR REPAIR AND MAINTENANCE. Organizations: BRENT MORRISON (CONTACT/OWNER)
DUTCH MILLER LINCOLN (RTE 60 EAST in BARBOURSVILLE, WV)
(Resource Conservation and Recovery Act (tracking hazardous waste)) Organizations: OPERNAME (CONTACT/OPERATOR)
, DUTCH MILLER AUTO GROUP INC (CONTACT/OWNER)
(Resource Conservation and Recovery Act (tracking hazardous waste)) Organizations: OPERNAME (CONTACT/OPERATOR)
, EXXON MOBIL (CONTACT/OWNER)
EXXON RAS #26678 (I-64 & US RT 60 in BARBOURSVILLE, WV)
(Resource Conservation and Recovery Act (tracking hazardous waste)) Organizations: OPERNAME (CONTACT/OPERATOR)
, EXXON MOBIL (CONTACT/OWNER)
AUTOMOTIVE SPECIALTIES (6439 FARMDALE ROAD in BARBOURSVILLE, WV)
AIR MINOR (AIRS/AFS) Small Quantity Generators, between 100 kg and 1000 kg of hazardous waste/month (Resource Conservation and Recovery Act (tracking hazardous waste)) - notification Business SIC classification: AUTO AND HOME SUPPLY STORES
Housing units lacking complete plumbing facilities: 1.1% Housing units lacking complete kitchen facilities: 0.8%
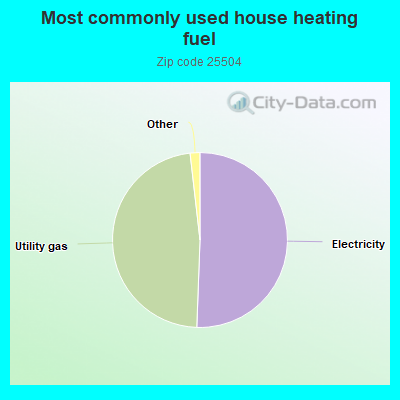
50.6%Electricity
47.6%Utility gas
0.8%Wood
0.7%Bottled, tank, or LP gas
Population in 1990: 10,205. Population change in the 1990s: +764 (+7.5%).
Place of birth for U.S.-born residents:
This state: 10,150
Northeast: 559
Midwest: 623
South: 1,035
West: 277
64% of the 25504 zip code residents lived in the same house 5 years ago. Out of people who lived in different houses, 63% lived in this county. Out of people who lived in different counties, 50% lived in West Virginia.
90% of the 25504 zip code residents lived in the same house 1 year ago. Out of people who lived in different houses, 36% moved from this county. Out of people who lived in different houses, 35% moved from different county within same state. Out of people who lived in different houses, 26% moved from different state. Out of people who lived in different houses, 4% moved from abroad.
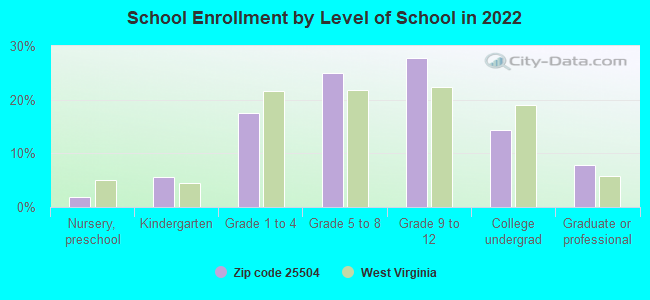
Private vs. public school enrollment:
Students in private schools in grades 1 to 8 (elementary and middle school): 30
Here:
2.6%
West Virginia:
12.2%
Students in private schools in grades 9 to 12 (high school): 17
Here:
2.2%
West Virginia:
8.8%
Students in private undergraduate colleges: 112
Here:
27.1%
West Virginia:
17.3%
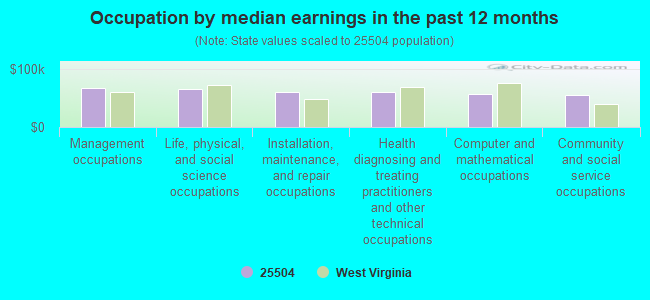
Occupation by median earnings in the past 12 months ($)
67,639Management occupations
66,367Life, physical, and social science occupations
60,429Installation, maintenance, and repair occupations
60,178Health diagnosing and treating practitioners and other technical occupations
57,691Computer and mathematical occupations
55,787Community and social service occupations
Companies with federal contracts located in this zip code (BARBOURSVILLE, WV):
ADAMS TRUCKING & SUPPLY INC (3700 US ROUTE 60 E; small business) : $92,727 in 3 contractsfrom 2000 to 2002
$92,800 with U.S. Army Corps of Engineers - civil program financing only for Minerals, Natural and Synthetic. Signed on 2000-04-25. Completion date: 2000-05-08.
$0 with U.S. Army Corps of Engineers - civil program financing only for Mineral Construction Materials, Bulk. Signed on 2002-01-28. Completion date: 2001-09-28.
-$73, same as above.Signed on 2002-01-28. Completion date: 2001-09-28.
PREMIER EXECUTIVE DEVELOPMENT, (304 TURNBERRY PT) : $25,734 in 2 contractsin 2004
$12,867 with U.S. Army Corps of Engineers - civil program financing only for Other Professional Services. Signed on 2004-12-08. Completion date: 2004-12-09.
$12,867 with Army for Other Professional Services. Signed on 2004-12-08. Completion date: 2004-12-09.
HOMETOWN SPORTSWEAR INC (3692 US ROUTE 60 E; small business)
$20,489 with U.S. Army Corps of Engineers - civil program financing only for Clothing, Special Purpose. Signed on 2002-05-31. Completion date: 2002-06-17.
INTERSTATE PROPERTIES LTD (3677 US ROUTE 60 E; small business)
$12,794 with U.S. Army Corps of Engineers - civil program financing only for Tractors, Wheeled. Taking place in OH. Signed on 2002-03-15. Completion date: 2002-04-26.
Top industries in this zip code by the number of employees in 2005:
2003 - 2018 National Fire Incident Reporting System (NFIRS) incidents
Based on the data from the years 2003 - 2018 the average number of fires per year is 58. The highest number of reported fire incidents - 99 took place in 2018, and the least - 17 in 2003. The data has a growing trend.
When looking into fire subcategories, the most incidents belonged to: Structure Fires (50.3%), and Outside Fires (28.0%).
Fire incident types reported to NFIRS in Zip Code 25504
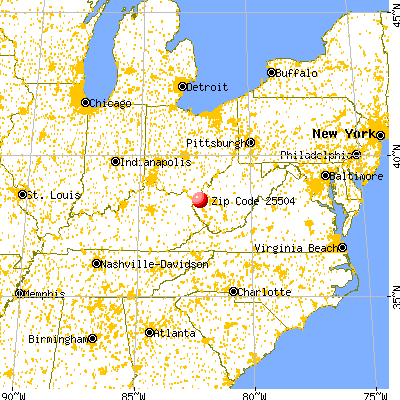


 Nearest zip codes: 25559, 25702, 25705, 25545, 25571, 25701.


 Based on the data from the years 2003 - 2018 the average number of fires per year is 58. The highest number of reported fire incidents - 99 took place in 2018, and the least - 17 in 2003. The data has a growing trend.
 When looking into fire subcategories, the most incidents belonged to: Structure Fires (50.3%), and Outside Fires (28.0%).