Estimated zip code population in 2022: 1,479 Zip code population in 2010: 1,247 Zip code population in 2000: 1,141
March 2022 cost of living index in zip code 26678: 80.7 (low, U.S. average is 100)
Land area: 14.4 sq. mi. Water area: 0.2 sq. mi.
Population density: 103 people per square mile
(very low).
OSM Map
General Map
Google Map
MSN Map
OSM Map
General Map
Google Map
MSN Map
OSM Map
General Map
Google Map
MSN Map
OSM Map
General Map
Google Map
MSN Map
Please wait while loading the map...
Real estate property taxes paid for housing units in 2022:
This zip code:
0.5% ($553)
West Virginia:
0.5% ($821)
Median real estate property taxes paid for housing units with mortgages in 2022: $498 (0.4%) Median real estate property taxes paid for housing units with no mortgage in 2022: $641 (0.6%)
Business Search- 14 Million verified businesses
Males: 576
(39.0%)
Females: 903
(61.0%)
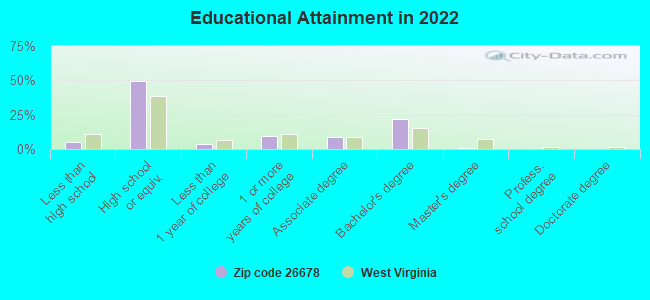
For population 25 years and over in 26678:
High school or higher: 94.2%
Bachelor's degree or higher: 22.8%
Graduate or professional degree: 1.0%
Unemployed: 2.4%
Mean travel time to work (commute): 45.4 minutes
For population 15 years and over in 26678:
Never married: 23.0%
Now married: 60.0%
Separated: 0.0%
Widowed: 5.3%
Divorced: 11.7%
Zip code 26678 compared to state average:
Unemployed percentage below state average.
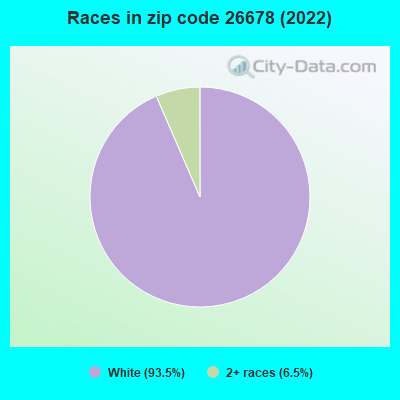
Black race population percentage significantly below state average.
Hispanic race population percentage significantly below state average.
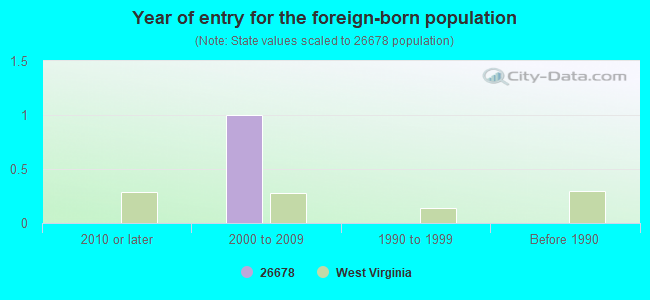
Foreign-born population percentage significantly below state average.
Renting percentage significantly below state average.
Length of stay since moving in significantly above state average.
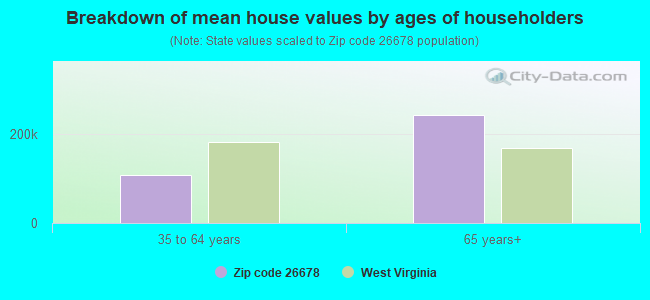
Estimated median house/condo value in 2022: $113,187
26678:
$113,187
West Virginia:
$155,100
According to our research of West Virginia and other state lists, there were 8 registered sex offenders living in 26678 zip code as of April 24, 2024. The ratio of all residents to sex offenders in zip code 26678 is 168 to 1.
Median resident age:
This zip code:
45.2 years
West Virginia median age:
42.9 years
Average household size:
This zip code:
2.9 people
West Virginia:
2.3 people
Averages for the 2020 tax year for zip code 26678, filed in 2021:
Average Adjusted Gross Income (AGI) in 2020: $51,639 (Individual Income Tax Returns)
Here:
$51,639
State:
$56,292
Salary/wage: $50,888 (reported on 80.4% of returns)
Here:
$50,888
State:
$49,093
(% of AGI for various income ranges: 1226.2% for AGIs below $25k, 3560.0% for AGIs $25k-50k, 7252.0% for AGIs $50k-75k, 9170.0% for AGIs $75k-100k, 21040.0% for AGIs $100k-200k)
Taxable interest for individuals: $236 (reported on 21.6% of returns)
This zip code:
$236
West Virginia:
$1,141
(% of AGI for various income ranges: 8.5% for AGIs below $25k, 9.0% for AGIs $25k-50k, 15.0% for AGIs $75k-100k)
Ordinary dividends: $900 (reported on 5.9% of returns)
Here:
$900
State:
$5,456
(% of AGI for various income ranges: 27.0% for AGIs $25k-50k)
Net capital gain/loss in AGI: +$200 (reported on 5.9% of returns)
Here:
+$200
State:
+$11,656
(% of AGI for various income ranges: 4.6% for AGIs below $25k)
Profit/loss from business: +$2,800 (reported on 11.8% of returns)
Here:
+$2,800
State:
+$12,084
(% of AGI for various income ranges: 78.5% for AGIs below $25k, 66.0% for AGIs $25k-50k)
Taxable individual retirement arrangement distribution: $7,033 (reported on 5.9% of returns)
26678:
$7,033
West Virginia:
$15,311
(% of AGI for various income ranges: 211.0% for AGIs $25k-50k)
Earned income credit: $2,478 (reported on 17.6% of returns)
Here:
$2,478
State:
$2,258
(% of AGI for various income ranges: 107.7% for AGIs below $25k, 83.0% for AGIs $25k-50k)
Percentage of individuals using paid preparers for their 2020 taxes: 92.2%
Here:
92%
State:
93%
(% for various income ranges: 85.0% for AGIs below $25k, 92.3% for AGIs $25k-50k, 100.0% for AGIs $50k-75k, 100.0% for AGIs $75k-100k, 100.0% for AGIs $100k-200k)
Averages for the 2012 tax year for zip code 26678, filed in 2013:
Average Adjusted Gross Income (AGI) in 2012: $50,406 (Individual Income Tax Returns)
Here:
$50,406
State:
$48,628
Salary/wage: $44,270 (reported on 88.5% of returns)
Here:
$44,270
State:
$42,328
(% of AGI for various income ranges: 74.4% for AGIs below $25k, 81.5% for AGIs $25k-50k, 84.2% for AGIs $50k-75k, 89.9% for AGIs $75k-100k, 69.6% for AGIs $100k-200k)
Taxable interest for individuals: $475 (reported on 23.1% of returns)
This zip code:
$475
West Virginia:
$1,211
(% of AGI for various income ranges: 0.9% for AGIs below $25k, 0.1% for AGIs $25k-50k, 0.4% for AGIs $50k-75k)
Ordinary dividends: $350 (reported on 7.7% of returns)
Here:
$350
State:
$4,262
Net capital gain/loss in AGI: +$33 (reported on 5.8% of returns)
Here:
+$33
State:
+$8,875
Profit/loss from business: +$4,767 (reported on 11.5% of returns)
Here:
+$4,767
State:
+$13,636
Total itemized deductions: $23,525 (17% of AGI, reported on 15.4% of returns)
Here:
$23,525
State:
$21,148
Here:
17.0% of AGI
State:
18.1% of AGI
Charity contributions: $3,433 (reported on 11.5% of returns)
Here:
$3,433
State:
$4,508
Taxes paid: $9,267 (reported on 17.3% of returns)
26678:
$9,267
State:
$8,103
Earned income credit: $2,245 (reported on 21.2% of returns)
Here:
$2,245
State:
$2,140
(% of AGI for various income ranges: 7.7% for AGIs below $25k, 1.3% for AGIs $25k-50k)
Percentage of individuals using paid preparers for their 2012 taxes: 50.0%
Here:
50%
State:
49%
(% for various income ranges: 40.9% for AGIs below $25k, 54.5% for AGIs $25k-50k, 55.6% for AGIs $50k-75k, 50.0% for AGIs $75k-100k, 66.7% for AGIs $100k-200k)
Averages for the 2004 tax year for zip code 26678, filed in 2005:
Average Adjusted Gross Income (AGI) in 2004: $34,434 (Individual Income Tax Returns)
Here:
$34,434
State:
$37,498
Salary/wage: $31,690 (reported on 87.8% of returns)
Here:
$31,690
State:
$33,645
(% of AGI for various income ranges: 100.0% for AGIs below $10k, 71.1% for AGIs $10k-25k, 86.0% for AGIs $25k-50k, 93.9% for AGIs $50k-75k, 84.1% for AGIs $75k-100k, 44.9% for AGIs over 100k)
Taxable interest for individuals: $603 (reported on 29.0% of returns)
This zip code:
$603
West Virginia:
$1,465
(% of AGI for various income ranges: 2.0% for AGIs below $10k, 1.8% for AGIs $10k-25k, 0.4% for AGIs $25k-50k, 0.1% for AGIs $50k-75k, 0.4% for AGIs $75k-100k)
Taxable dividends: $260 (reported on 11.1% of returns)
Here:
$260
State:
$2,913
Net capital gain/loss: +$250 (reported on 5.3% of returns)
Here:
+$250
State:
+$6,331
Profit/loss from business: +$3,931 (reported on 12.8% of returns)
Here:
+$3,931
State:
+$11,074
(% of AGI for various income ranges: 6.8% for AGIs below $10k, 5.3% for AGIs $10k-25k, 1.7% for AGIs $25k-50k, 0.4% for AGIs $50k-75k)
Total itemized deductions: $18,183 (22% of AGI, reported on 13.3% of returns)
Here:
$18,183
State:
$16,976
Here:
22.5% of AGI
State:
19.0% of AGI
Charity contributions deductions: $2,167 (3% of AGI, reported on 9.3% of returns)
Here:
$2,167
State:
$3,529
Here:
2.8% of AGI
State:
3.7% of AGI
(% of AGI for various income ranges: 0.7% for AGIs $10k-25k, 0.6% for AGIs $50k-75k, 2.2% for AGIs $75k-100k)
Total tax: $4,262 (reported on 70.8% of returns)
26678:
$4,262
State:
$5,372
(% of AGI for various income ranges: 3.0% for AGIs below $10k, 3.5% for AGIs $10k-25k, 5.6% for AGIs $25k-50k, 8.6% for AGIs $50k-75k, 10.5% for AGIs $75k-100k, 20.3% for AGIs over 100k)
Earned income credit: $1,700 (reported on 19.9% of returns)
Here:
$1,700
State:
$1,662
Percentage of individuals using paid preparers for their 2004 taxes: 60.2%
Here:
60%
State:
55%
(% for various income ranges: 54.6% for AGIs below $10k, 64.0% for AGIs $10k-25k, 61.2% for AGIs $25k-50k, 50.7% for AGIs $50k-75k, 69.2% for AGIs $75k-100k, 100.0% for AGIs over 100k)
Household received Food Stamps/SNAP in the past 12 months: 242 Household did not receive Food Stamps/SNAP in the past 12 months: 285
Women who had a birth in the past 12 months: 23 (24 now married, 0 unmarried) Women who did not have a birth in the past 12 months: 467 (194 now married, 272 unmarried)
Housing units in zip code 26678 with a mortgage: 327 Median monthly owner costs for units with a mortgage: $774 Median monthly owner costs for units without a mortgage: $340
Residents with income below the poverty level in 2022:
This zip code:
13.0%
Whole state:
17.9%
Residents with income below 50% of the poverty level in 2022:
This zip code:
6.2%
Whole state:
9.7%
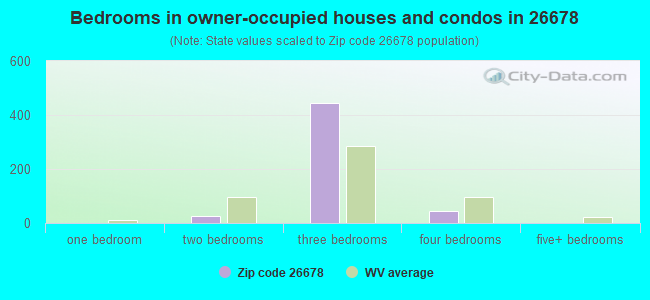
Median number of rooms in houses and condos:
Here:
7.5
State:
6.5
Notable locations in this zip code not listed on our city pages
Size of family households: 80 2-persons, 180 3-persons, 23 4-persons, 5 5-persons, 109 6-persons, 8 7-or-more-persons
Size of nonfamily households: 64 1-person, 52 2-persons
251 married couples with children.
13 single-parent households (13 men).
99.4% of residents of 26678 zip code speak English at home.
Foreign born population: 1 (0.1%) (0.0% of them are naturalized citizens)
:
0.1%
Whole state:
1.8%
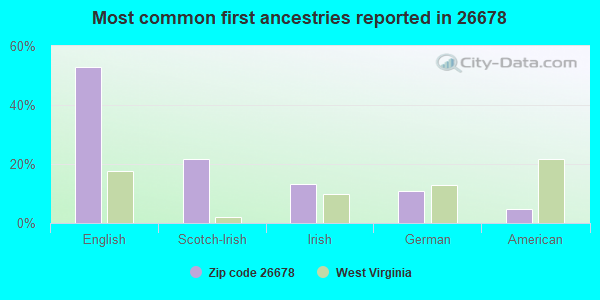
53%English
22%Scotch-Irish
13%Irish
11%German
5%American
Year of entry for the foreign-born population
02010 or later
12000 to 2009
01990 to 1999
0Before 1990
Public elementary/middle school in in zip code 26678 not listed on the city page:
MT LOOKOUT ELEMENTARY SCHOOL (Location: 1945 MOUNT LOOKOUT ROAD, Grades: PK-5)
Facilities with environmental interests located in this zip code:
DRB TRANSPORT INC (BURR ROAD in MT LOOKOUT, WV)
(Resource Conservation and Recovery Act (tracking hazardous waste)) Organizations: BAYS DAVID R (CONTACT/OWNER)
Housing units lacking complete plumbing facilities: 2.6%
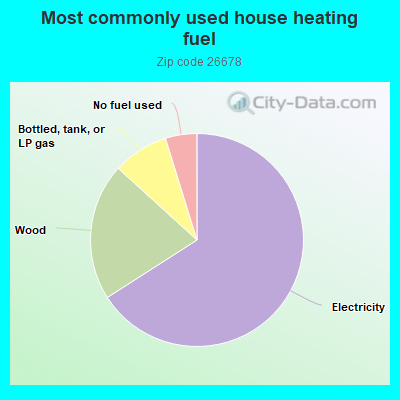
66.2%Electricity
20.9%Wood
8.5%Bottled, tank, or LP gas
4.8%No fuel used
Population in 1990: 1,029. Population change in the 1990s: +112 (+10.9%).
Place of birth for U.S.-born residents:
This state: 1,145
Northeast: 26
Midwest: 251
South: 35
West: 7
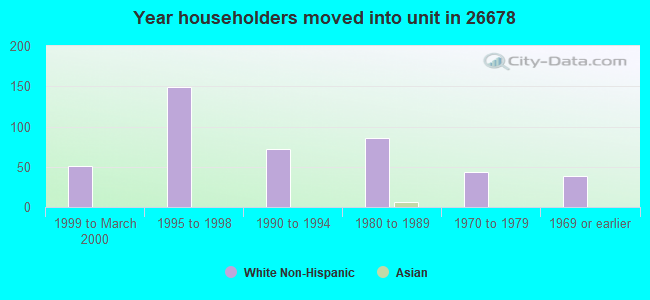
65% of the 26678 zip code residents lived in the same house 5 years ago. Out of people who lived in different houses, 17% lived in this county. Out of people who lived in different counties, 50% lived in West Virginia.
92% of the 26678 zip code residents lived in the same house 1 year ago. Out of people who lived in different houses, 14% moved from this county. Out of people who lived in different houses, 61% moved from different county within same state. Out of people who lived in different houses, 22% moved from abroad.
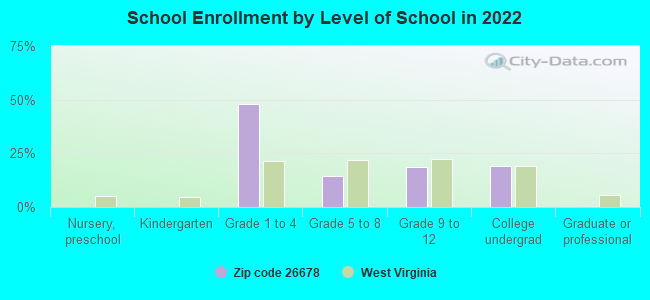
Private vs. public school enrollment:
Students in private schools in grades 1 to 8 (elementary and middle school): 10
Here:
4.9%
West Virginia:
12.2%
Students in private schools in grades 9 to 12 (high school):
Here:
0.0%
West Virginia:
8.8%
Students in private undergraduate colleges:
Here:
0.0%
West Virginia:
17.3%
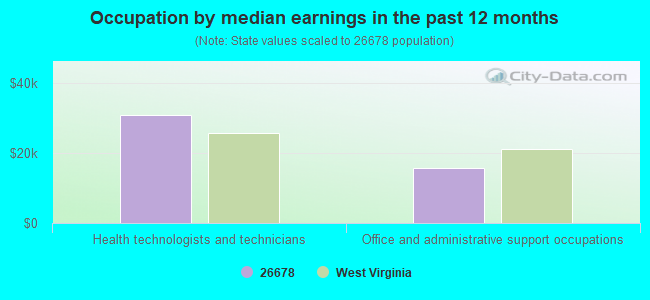
Occupation by median earnings in the past 12 months ($)
30,930Health technologists and technicians
15,811Office and administrative support occupations
Companies with federal contracts located in this zip code:
J & B DRIVEWAY PAVEMENT (633 RIDGEVIEW DR in MOUNT LOOKOUT, WV; small business) : $9,560 in 2 contractsin 2004
$4,780 with U.S. Army Corps of Engineers - civil program financing only for Construction of Structures and Facilities -- Highways, Roads, Streets, Bridges, and Railways (includes resurfacing). Signed on 2004-09-10. Completion date: 2004-09-17.
$4,780 with Army for Construction of Structures and Facilities -- Highways, Roads, Streets, Bridges, and Railways (includes resurfacing). Signed on 2004-09-10. Completion date: 2004-09-17.
Top industries in this zip code by the number of employees in 2005:
Administrative and Support and Waste Management and Remediation Services: Other Business Service Centers (including Copy Shops) (10-19 employees: 1 establishment)
Health Care and Social Assistance: Vocational Rehabilitation Services (10-19: 1)
Construction: Plumbing, Heating, and Air-Conditioning Contractors (10-19: 1)
Professional, Scientific, and Technical Services: Other Scientific and Technical Consulting Services (1-4: 1)
Finance and Insurance: Insurance Agencies and Brokerages (1-4: 1)
Construction: Commercial and Institutional Building Construction (1-4: 1)
Administrative and Support and Waste Management and Remediation Services: Remediation Services (1-4: 1)
Wholesale Trade: Other Miscellaneous Durable Goods Merchant Wholesalers (1-4: 1)
Fatal accident statistics in 2013:
Fatal accident count: 1
Vehicles involved in fatal accidents: 2
Fatal accidents caused by drunken drivers: 0
Fatalities: 3
Persons involved in fatal accidents: 5
Pedestrians involved in fatal accidents: 0
Fatal accident statistics in 2011:
Fatal accident count: 1
Vehicles involved in fatal accidents: 1
Fatal accidents caused by drunken drivers: 0
Fatalities: 1
Persons involved in fatal accidents: 2
Pedestrians involved in fatal accidents: 0
2003 - 2018 National Fire Incident Reporting System (NFIRS) incidents
According to the data from the years 2003 - 2018 the average number of fires per year is 7. The highest number of fires - 24 took place in 2012, and the least - 0 in 2006. The data has a rising trend.
When looking into fire subcategories, the most reports belonged to: Structure Fires (55.9%), and Outside Fires (27.0%).
Fire incident types reported to NFIRS in Zip Code 26678

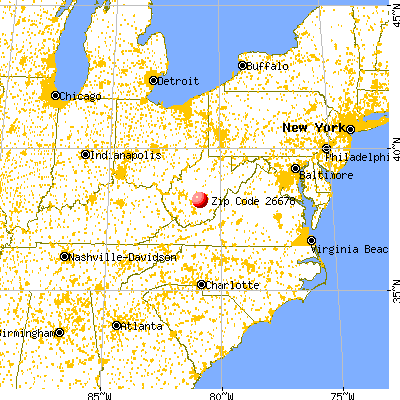


 Nearest zip codes: 26684, 25854, 26680, 25868, 26679, 25938.


 (Location: 1945 MOUNT LOOKOUT ROAD, Grades: PK-5)

 According to the data from the years 2003 - 2018 the average number of fires per year is 7. The highest number of fires - 24 took place in 2012, and the least - 0 in 2006. The data has a rising trend.
 When looking into fire subcategories, the most reports belonged to: Structure Fires (55.9%), and Outside Fires (27.0%).