Estimated zip code population in 2022: 6,887 Zip code population in 2010: 6,057 Zip code population in 2000: 5,484
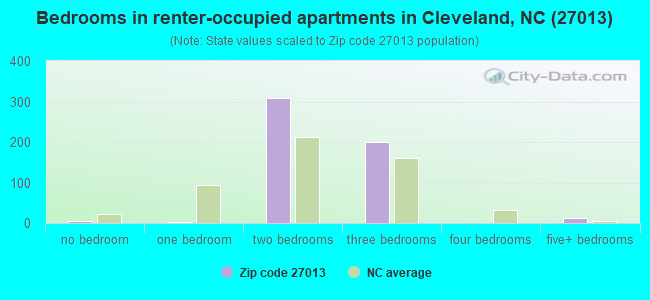
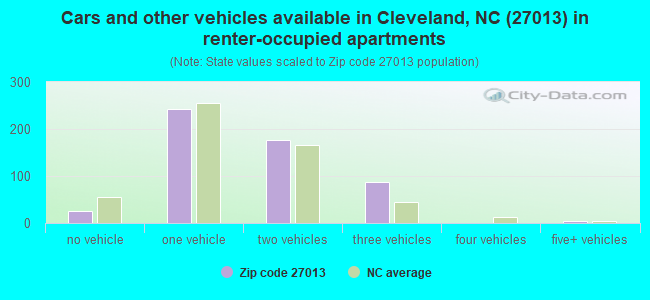
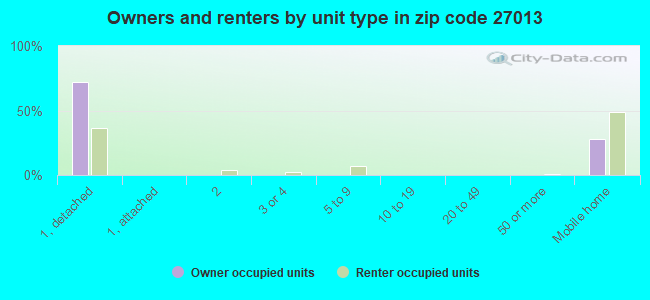
Houses and condos: 3,028 Renter-occupied apartments: 533
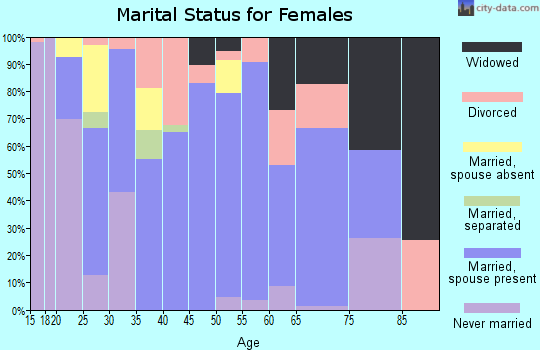
% of renters here:
20%
State:
33%
March 2022 cost of living index in zip code 27013: 80.0 (low, U.S. average is 100)
Land area: 75.4 sq. mi. Water area: 0.1 sq. mi.
Population density: 91 people per square mile
(very low).
OSM Map
General Map
Google Map
MSN Map
OSM Map
General Map
Google Map
MSN Map
OSM Map
General Map
Google Map
MSN Map
OSM Map
General Map
Google Map
MSN Map
Please wait while loading the map...
Real estate property taxes paid for housing units in 2022:
This zip code:
0.5% ($1,101)
North Carolina:
0.6% ($1,769)
Median real estate property taxes paid for housing units with mortgages in 2022: $1,303 (0.6%) Median real estate property taxes paid for housing units with no mortgage in 2022: $925 (0.5%)
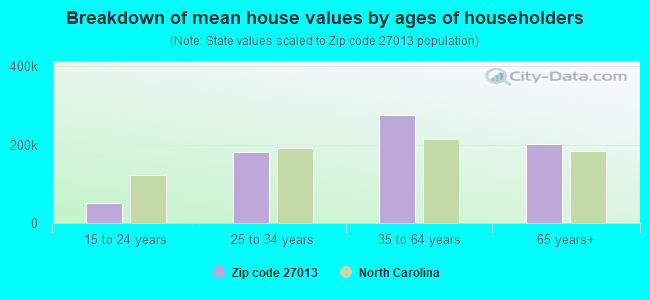
Estimated median house/condo value in 2022: $207,255
27013:
$207,255
North Carolina:
$280,600
According to our research of North Carolina and other state lists, there were 15 registered sex offenders living in 27013 zip code as of April 25, 2024. The ratio of all residents to sex offenders in zip code 27013 is 413 to 1. The ratio of registered sex offenders to all residents in this zip code is near the state average.
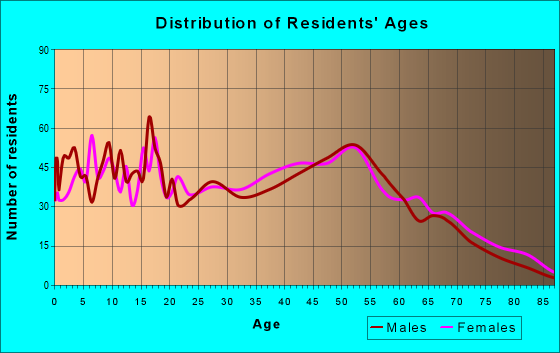
Median resident age:
This zip code:
35.0 years
North Carolina median age:
39.2 years
Average household size:
This zip code:
2.6 people
North Carolina:
2.4 people
Averages for the 2020 tax year for zip code 27013, filed in 2021:
Average Adjusted Gross Income (AGI) in 2020: $51,880 (Individual Income Tax Returns)
Here:
$51,880
State:
$70,020
Salary/wage: $45,877 (reported on 83.2% of returns)
Here:
$45,877
State:
$58,387
(% of AGI for various income ranges: 1174.9% for AGIs below $25k, 3747.3% for AGIs $25k-50k, 6665.6% for AGIs $50k-75k, 9788.9% for AGIs $75k-100k, 17384.4% for AGIs $100k-200k)
Taxable interest for individuals: $866 (reported on 24.5% of returns)
This zip code:
$866
North Carolina:
$1,479
(% of AGI for various income ranges: 12.1% for AGIs below $25k, 18.5% for AGIs $25k-50k, 26.5% for AGIs $50k-75k, 31.1% for AGIs $75k-100k, 113.3% for AGIs $100k-200k)
Ordinary dividends: $3,524 (reported on 12.4% of returns)
Here:
$3,524
State:
$7,888
(% of AGI for various income ranges: 12.6% for AGIs below $25k, 26.8% for AGIs $25k-50k, 37.9% for AGIs $50k-75k, 62.8% for AGIs $75k-100k, 341.7% for AGIs $100k-200k)
Net capital gain/loss in AGI: +$12,248 (reported on 11.1% of returns)
Here:
+$12,248
State:
+$23,652
(% of AGI for various income ranges: 7.4% for AGIs below $25k, 16.4% for AGIs $25k-50k, 79.1% for AGIs $50k-75k, 197.8% for AGIs $75k-100k, 508.3% for AGIs $100k-200k)
Profit/loss from business: +$9,026 (reported on 15.8% of returns)
Here:
+$9,026
State:
+$11,710
(% of AGI for various income ranges: 127.0% for AGIs below $25k, 125.3% for AGIs $25k-50k, 148.8% for AGIs $50k-75k, 182.2% for AGIs $75k-100k, 890.6% for AGIs $100k-200k)
Taxable individual retirement arrangement distribution: $13,785 (reported on 8.7% of returns)
27013:
$13,785
North Carolina:
$20,247
(% of AGI for various income ranges: 54.9% for AGIs below $25k, 71.8% for AGIs $25k-50k, 210.6% for AGIs $50k-75k, 328.9% for AGIs $75k-100k, 766.1% for AGIs $100k-200k)
Total itemized deductions: $33,777 (reported on 4.4% of returns)
Here:
$33,777
State:
$34,549
(% of AGI for various income ranges: 119.5% for AGIs $25k-50k, 154.4% for AGIs $50k-75k, 272.2% for AGIs $75k-100k, 920.0% for AGIs $100k-200k)
Charity contributions: $13,164 (reported on 3.7% of returns)
Here:
$13,164
State:
$13,360
(% of AGI for various income ranges: 96.2% for AGIs $50k-75k, 331.1% for AGIs $100k-200k)
Taxes paid: $6,469 (reported on 4.4% of returns)
27013:
$6,469
State:
$7,586
(% of AGI for various income ranges: 11.5% for AGIs $25k-50k, 37.1% for AGIs $50k-75k, 69.4% for AGIs $75k-100k, 181.1% for AGIs $100k-200k)
Earned income credit: $2,226 (reported on 20.8% of returns)
Here:
$2,226
State:
$2,337
(% of AGI for various income ranges: 116.4% for AGIs below $25k, 73.3% for AGIs $25k-50k)
Percentage of individuals using paid preparers for their 2020 taxes: 93.6%
Here:
94%
State:
93%
(% for various income ranges: 92.5% for AGIs below $25k, 95.1% for AGIs $25k-50k, 93.6% for AGIs $50k-75k, 92.6% for AGIs $75k-100k, 96.8% for AGIs $100k-200k, 80.0% for AGIs over 200k)
Averages for the 2012 tax year for zip code 27013, filed in 2013:
Average Adjusted Gross Income (AGI) in 2012: $42,968 (Individual Income Tax Returns)
Here:
$42,968
State:
$54,937
Salary/wage: $37,858 (reported on 84.9% of returns)
Here:
$37,858
State:
$46,336
(% of AGI for various income ranges: 74.3% for AGIs below $25k, 80.6% for AGIs $25k-50k, 82.5% for AGIs $50k-75k, 81.6% for AGIs $75k-100k, 92.0% for AGIs $100k-200k)
Taxable interest for individuals: $879 (reported on 29.8% of returns)
This zip code:
$879
North Carolina:
$1,298
(% of AGI for various income ranges: 0.9% for AGIs below $25k, 0.8% for AGIs $25k-50k, 0.6% for AGIs $50k-75k, 0.2% for AGIs $75k-100k, 0.8% for AGIs $100k-200k)
Ordinary dividends: $1,991 (reported on 13.1% of returns)
Here:
$1,991
State:
$6,213
(% of AGI for various income ranges: 0.8% for AGIs below $25k, 0.7% for AGIs $25k-50k, 0.6% for AGIs $50k-75k, 0.3% for AGIs $75k-100k, 0.9% for AGIs $100k-200k)
Net capital gain/loss in AGI: +$6,061 (reported on 9.1% of returns)
Here:
+$6,061
State:
+$12,740
(% of AGI for various income ranges: 0.2% for AGIs $25k-50k, 0.5% for AGIs $50k-75k, 7.0% for AGIs $100k-200k)
Profit/loss from business: +$9,007 (reported on 16.3% of returns)
Here:
+$9,007
State:
+$10,311
(% of AGI for various income ranges: 6.3% for AGIs below $25k, 4.8% for AGIs $25k-50k, 1.5% for AGIs $50k-75k, 0.6% for AGIs $75k-100k, 6.4% for AGIs $100k-200k)
Taxable individual retirement arrangement distribution: $11,170 (reported on 9.1% of returns)
27013:
$11,170
North Carolina:
$15,575
(% of AGI for various income ranges: 3.2% for AGIs below $25k, 2.0% for AGIs $25k-50k, 1.8% for AGIs $50k-75k, 2.0% for AGIs $75k-100k, 4.7% for AGIs $100k-200k)
Total itemized deductions: $18,734 (24% of AGI, reported on 27.8% of returns)
Here:
$18,734
State:
$23,438
Here:
24.1% of AGI
State:
21.5% of AGI
(% of AGI for various income ranges: 10.2% for AGIs below $25k, 10.1% for AGIs $25k-50k, 10.9% for AGIs $50k-75k, 13.8% for AGIs $75k-100k, 23.2% for AGIs $100k-200k)
Charity contributions: $4,251 (reported on 22.6% of returns)
Here:
$4,251
State:
$4,687
(% of AGI for various income ranges: 1.4% for AGIs below $25k, 1.7% for AGIs $25k-50k, 1.8% for AGIs $50k-75k, 2.8% for AGIs $75k-100k, 4.9% for AGIs $100k-200k)
Taxes paid: $6,076 (reported on 27.8% of returns)
27013:
$6,076
State:
$8,823
(% of AGI for various income ranges: 1.3% for AGIs below $25k, 2.4% for AGIs $25k-50k, 3.0% for AGIs $50k-75k, 4.9% for AGIs $75k-100k, 6.4% for AGIs $100k-200k, 7.3% for AGIs over 200k)
Earned income credit: $2,325 (reported on 23.8% of returns)
Here:
$2,325
State:
$2,376
(% of AGI for various income ranges: 7.8% for AGIs below $25k, 1.3% for AGIs $25k-50k)
Percentage of individuals using paid preparers for their 2012 taxes: 60.3%
Here:
60%
State:
53%
(% for various income ranges: 56.1% for AGIs below $25k, 60.0% for AGIs $25k-50k, 66.7% for AGIs $50k-75k, 60.0% for AGIs $75k-100k, 85.7% for AGIs $100k-200k)
Averages for the 2004 tax year for zip code 27013, filed in 2005:
Average Adjusted Gross Income (AGI) in 2004: $37,336 (Individual Income Tax Returns)
Here:
$37,336
State:
$45,376
Salary/wage: $35,377 (reported on 87.1% of returns)
Here:
$35,377
State:
$39,442
(% of AGI for various income ranges: 92.8% for AGIs below $10k, 80.9% for AGIs $10k-25k, 86.7% for AGIs $25k-50k, 85.6% for AGIs $50k-75k, 84.8% for AGIs $75k-100k, 66.6% for AGIs over 100k)
Taxable interest for individuals: $1,006 (reported on 34.0% of returns)
This zip code:
$1,006
North Carolina:
$1,515
(% of AGI for various income ranges: 4.8% for AGIs below $10k, 1.0% for AGIs $10k-25k, 0.9% for AGIs $25k-50k, 0.6% for AGIs $50k-75k, 0.8% for AGIs $75k-100k, 0.9% for AGIs over 100k)
Taxable dividends: $1,643 (reported on 15.8% of returns)
Here:
$1,643
State:
$4,016
(% of AGI for various income ranges: 2.6% for AGIs below $10k, 0.6% for AGIs $10k-25k, 0.3% for AGIs $25k-50k, 1.0% for AGIs $50k-75k, 0.7% for AGIs $75k-100k, 0.8% for AGIs over 100k)
Net capital gain/loss: +$8,458 (reported on 10.9% of returns)
Here:
+$8,458
State:
+$11,152
(% of AGI for various income ranges: 0.5% for AGIs below $10k, 0.8% for AGIs $10k-25k, 0.4% for AGIs $25k-50k, 0.6% for AGIs $50k-75k, 1.8% for AGIs $75k-100k, 12.0% for AGIs over 100k)
Profit/loss from business: +$8,154 (reported on 13.5% of returns)
Here:
+$8,154
State:
+$9,490
(% of AGI for various income ranges: 10.2% for AGIs below $10k, 5.9% for AGIs $10k-25k, 2.0% for AGIs $25k-50k, 2.0% for AGIs $50k-75k, 2.8% for AGIs $75k-100k, 3.2% for AGIs over 100k)
IRA payment deduction: $2,278 (reported on 1.4% of returns)
27013:
$2,278
North Carolina:
$2,967
Total itemized deductions: $15,925 (25% of AGI, reported on 34.4% of returns)
Here:
$15,925
State:
$19,464
Here:
25.3% of AGI
State:
22.7% of AGI
(% of AGI for various income ranges: 12.9% for AGIs below $10k, 10.9% for AGIs $10k-25k, 12.7% for AGIs $25k-50k, 16.0% for AGIs $50k-75k, 16.8% for AGIs $75k-100k, 16.4% for AGIs over 100k)
Charity contributions deductions: $3,538 (5% of AGI, reported on 30.7% of returns)
Here:
$3,538
State:
$4,035
Here:
5.5% of AGI
State:
4.5% of AGI
(% of AGI for various income ranges: 1.5% for AGIs below $10k, 1.3% for AGIs $10k-25k, 2.3% for AGIs $25k-50k, 3.0% for AGIs $50k-75k, 3.5% for AGIs $75k-100k, 4.6% for AGIs over 100k)
Total tax: $4,362 (reported on 71.0% of returns)
27013:
$4,362
State:
$7,257
(% of AGI for various income ranges: 3.3% for AGIs below $10k, 3.4% for AGIs $10k-25k, 6.0% for AGIs $25k-50k, 7.8% for AGIs $50k-75k, 9.7% for AGIs $75k-100k, 16.4% for AGIs over 100k)
Earned income credit: $1,831 (reported on 20.3% of returns)
Here:
$1,831
State:
$1,851
Percentage of individuals using paid preparers for their 2004 taxes: 69.7%
Here:
70%
State:
62%
(% for various income ranges: 62.3% for AGIs below $10k, 74.2% for AGIs $10k-25k, 67.9% for AGIs $25k-50k, 68.1% for AGIs $50k-75k, 75.7% for AGIs $75k-100k, 82.9% for AGIs over 100k)
Household received Food Stamps/SNAP in the past 12 months: 400 Household did not receive Food Stamps/SNAP in the past 12 months: 2,284
Women who had a birth in the past 12 months: 78 (81 now married, 0 unmarried) Women who did not have a birth in the past 12 months: 1,486 (785 now married, 704 unmarried)
Housing units in zip code 27013 with a mortgage: 1,217 (107 second mortgage, 3 home equity loan, 107 both second mortgage and home equity loan) Houses without a mortgage: 112
Median monthly owner costs for units with a mortgage: $1,342 Median monthly owner costs for units without a mortgage: $337
Residents with income below the poverty level in 2022:
This zip code:
16.1%
Whole state:
12.8%
Residents with income below 50% of the poverty level in 2022:
This zip code:
5.4%
Whole state:
6.8%
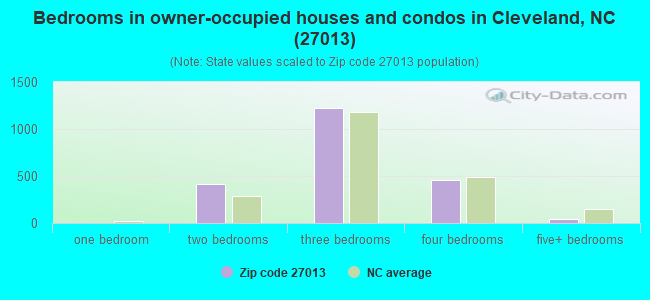
Median number of rooms in houses and condos:
Here:
6.1
State:
6.4
Median number of rooms in apartments:
Here:
4.4
State:
4.4
Notable locations in this zip code not listed on our city pages
Churches in zip code 27013 include: Knox Chapel (A), Knox Grove Church (B), Amity Church (C), Third Creek Church (D), Lebanon Church (E), Moores Chapel (F), Mount Vernon Church (G), Providence Church (H), Smiths Chapel (I). Display/hide their locations on the map
1,167 married couples with children.
288 single-parent households (67 men, 221 women).
90.6% of residents of 27013 zip code speak English at home.
6.0% of residents speak Spanish at home (82% very well, 18% not well).
3.1% of residents speak Asian or Pacific Island language at home (100% not at all).
1.1% of residents speak other language at home (80% very well, 20% not well).
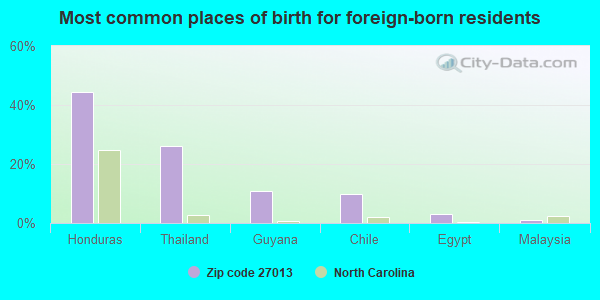
Foreign born population: 496 (7.2%) (17.5% of them are naturalized citizens)
This zip code:
7.2%
Whole state:
8.6%
45%Honduras
26%Thailand
11%Guyana
10%Chile
3%Egypt
1%Malaysia
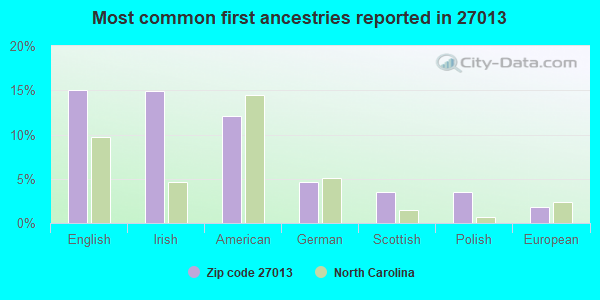
15%English
15%Irish
12%American
5%German
4%Scottish
3%Polish
2%European
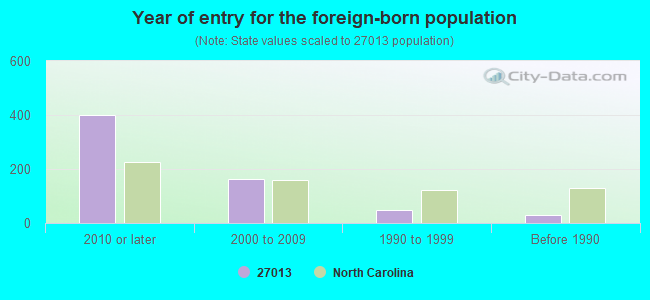
Year of entry for the foreign-born population
3992010 or later
1622000 to 2009
471990 to 1999
30Before 1990
Facilities with environmental interests located in this zip code:
CANSORB INDUSTRIES CORPORATION (555 KESLER ROAD in CLEVELAND, NC)
AIR SYNTHETIC MINOR (AIRS/AFS) STATE MASTER (North Carolina facility info) - AIR PROGRAM CRITERIA AND HAZARDOUS AIR POLLUTANT INVENTORY (Inventory of air pollution sources) Business SIC classification: RECONSTITUTED WOOD PRODUCTS Business NAICS classification: RECONSTITUTED WOOD PRODUCT MANUFACTURING.; RECONSTITUTED WOOD PRODUCT MANUFACTURING.
CLEVELAND ELEMENTARY (107 SCHOOL STREET in CLEVELAND, NC)
(National Center for Education Statistics) - STATE ID-324 Organizations: ROWAN-SALISBURY SCHOOLS (SCHOOL DISTRICT)
National Pollutant Discharge Elimination System NON-MAJOR (Tracking pollutant discharge elimination systems) - permit Business SIC classification: TRUCKING, EXCEPT LOCAL Alternative names: ACTIVE USA, INC, AUTOMOTIVE CARRIER SERV CLEVEL
BROWNING FERRIS INDUSTRIES - C (HWY 70 BARBER JCT in CLEVELAND, NC)
National Pollutant Discharge Elimination System NON-MAJOR (Tracking pollutant discharge elimination systems) - permit Alternative names: BROWNING FERRIS INDUS CLEVELAN
Housing units lacking complete plumbing facilities: 1.0% Housing units lacking complete kitchen facilities: 0.8%
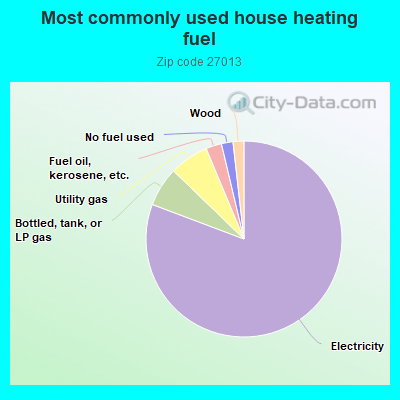
80.9%Electricity
6.5%Bottled, tank, or LP gas
6.5%Utility gas
2.6%Fuel oil, kerosene, etc.
1.9%No fuel used
1.8%Wood
Population in 1990: 4,070. Population change in the 1990s: +1,414 (+34.7%).
Place of birth for U.S.-born residents:
This state: 4,096
Northeast: 593
Midwest: 467
South: 909
West: 195
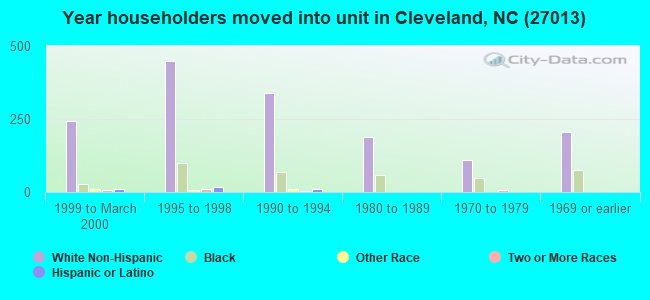
59% of the 27013 zip code residents lived in the same house 5 years ago. Out of people who lived in different houses, 55% lived in this county. Out of people who lived in different counties, 50% lived in North Carolina.
96% of the 27013 zip code residents lived in the same house 1 year ago. Out of people who lived in different houses, 44% moved from this county. Out of people who lived in different houses, 46% moved from different county within same state. Out of people who lived in different houses, 17% moved from different state. Out of people who lived in different houses, 3% moved from abroad.
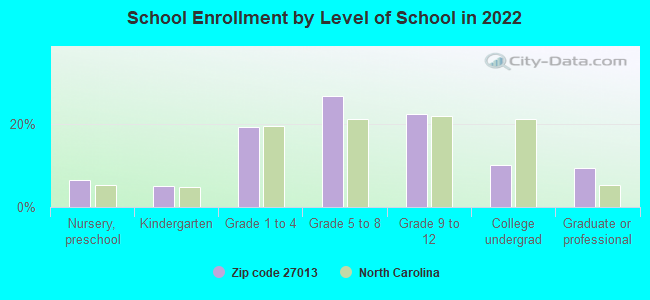
Private vs. public school enrollment:
Students in private schools in grades 1 to 8 (elementary and middle school): 127
Here:
15.2%
North Carolina:
13.8%
Students in private schools in grades 9 to 12 (high school): 42
Here:
10.5%
North Carolina:
11.9%
Students in private undergraduate colleges: 11
Here:
6.4%
North Carolina:
19.3%
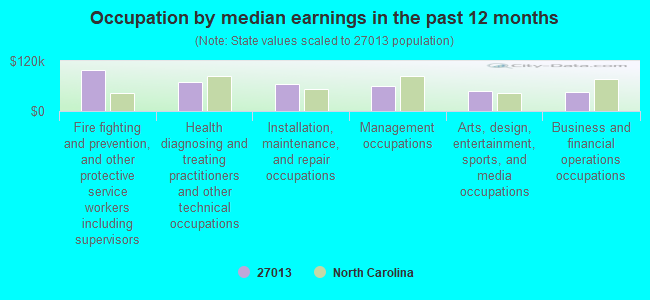
Occupation by median earnings in the past 12 months ($)
98,403Fire fighting and prevention, and other protective service workers including supervisors
68,825Health diagnosing and treating practitioners and other technical occupations
64,811Installation, maintenance, and repair occupations
60,608Management occupations
47,636Arts, design, entertainment, sports, and media occupations
46,723Business and financial operations occupations
Companies with federal contracts located in this zip code:
M&M ASSEMBLY, LLC (2425 UMBERGER RD in CLEVELAND, NC; small business) : $321,289 in 9 contractsfrom 2004 to 2006
Contracts for Refrigeration and Air Conditioning Components, Metal Screening, Miscellaneous Construction Materials, Rivets, and moreby Defense Logistics Agency Signed by year:2000: $0; 2001: $0; 2002: $0; 2003: $0; 2004: $143,810; 2005: $124,379; 2006: $53,100.
Biggest contracts:
$97,350 with Defense Logistics Agency for Refrigeration and Air Conditioning Components. Signed on 2005-12-30. Completion date: 2006-05-31.
$84,185, same as above.Signed on 2004-03-30. Completion date: 2004-06-30.
$59,625, same as above.Signed on 2004-06-10. Completion date: 2004-09-08.
$53,100, same as above.Signed on 2006-02-14. Completion date: 2006-07-26.
WILLIAMS, ROBERT (1890 WOODLEAF BARBER RD in CLEVELAND, NC; small business)
$16,500 with Air Force for Aircraft Ground Servicing Equipment. Taking place in SC. Signed on 2003-09-18. Completion date: 2003-10-27.
Top industries in this zip code by the number of employees in 2005:
Health Care and Social Assistance: Residential Mental Retardation Facilities (100-249 employees: 1 establishment)
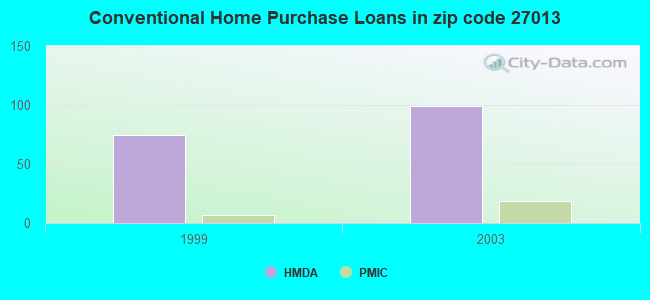
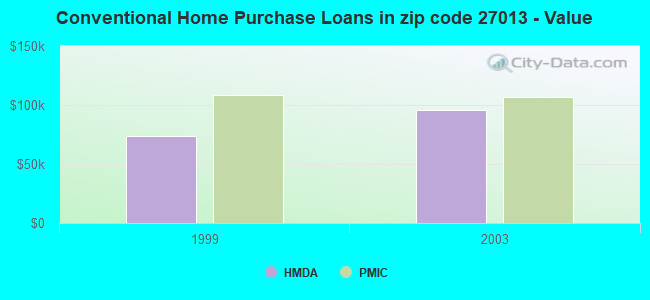
Detailed PMIC statistics for the following Tracts:0519.01
, 0519.02
2002 - 2018 National Fire Incident Reporting System (NFIRS) incidents
Based on the data from the years 2002 - 2018 the average number of fires per year is 28. The highest number of fires - 60 took place in 2015, and the least - 4 in 2003. The data has a rising trend.
When looking into fire subcategories, the most reports belonged to: Structure Fires (57.1%), and Outside Fires (31.6%).
Fire incident types reported to NFIRS in Zip Code 27013


 Nearest zip codes: 28125, 27054, 28147, 27014, 28115, 28166.
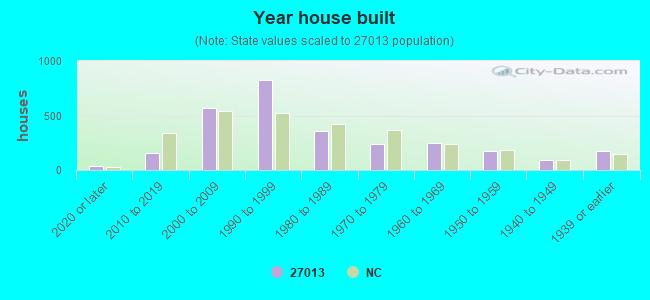


 Based on the data from the years 2002 - 2018 the average number of fires per year is 28. The highest number of fires - 60 took place in 2015, and the least - 4 in 2003. The data has a rising trend.
 When looking into fire subcategories, the most reports belonged to: Structure Fires (57.1%), and Outside Fires (31.6%).