Estimated zip code population in 2022: 31,965 Zip code population in 2010: 29,827 Zip code population in 2000: 25,198
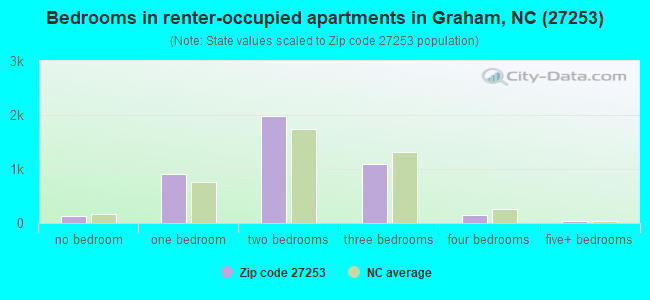
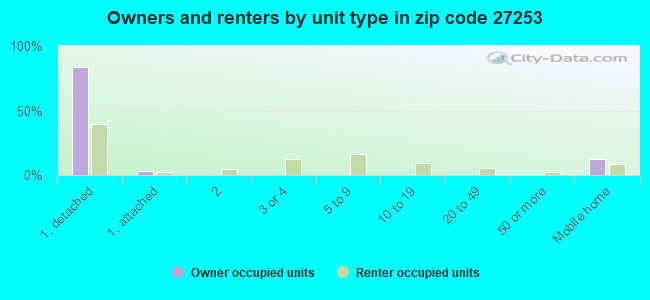
Houses and condos: 14,985 Renter-occupied apartments: 4,309
% of renters here:
31%
State:
33%
March 2022 cost of living index in zip code 27253: 91.5 (less than average, U.S. average is 100)
Land area: 88.1 sq. mi. Water area: 1.8 sq. mi.
Population density: 363 people per square mile
(very low).
OSM Map
General Map
Google Map
MSN Map
OSM Map
General Map
Google Map
MSN Map
OSM Map
General Map
Google Map
MSN Map
OSM Map
General Map
Google Map
MSN Map
Please wait while loading the map...
Real estate property taxes paid for housing units in 2022:
This zip code:
0.6% ($1,347)
North Carolina:
0.6% ($1,769)
Median real estate property taxes paid for housing units with mortgages in 2022: $1,416 (0.6%) Median real estate property taxes paid for housing units with no mortgage in 2022: $1,139 (0.6%)
Averages for the 2020 tax year for zip code 27253, filed in 2021:
Average Adjusted Gross Income (AGI) in 2020: $51,097 (Individual Income Tax Returns)
Here:
$51,097
State:
$70,020
Salary/wage: $45,333 (reported on 84.3% of returns)
Here:
$45,333
State:
$58,387
(% of AGI for various income ranges: 1177.3% for AGIs below $25k, 3810.5% for AGIs $25k-50k, 6900.6% for AGIs $50k-75k, 10484.2% for AGIs $75k-100k, 19686.9% for AGIs $100k-200k, 58617.1% for AGIs over 200k)
Taxable interest for individuals: $832 (reported on 26.0% of returns)
This zip code:
$832
North Carolina:
$1,479
(% of AGI for various income ranges: 12.2% for AGIs below $25k, 13.0% for AGIs $25k-50k, 37.7% for AGIs $50k-75k, 46.1% for AGIs $75k-100k, 92.3% for AGIs $100k-200k, 842.9% for AGIs over 200k)
Ordinary dividends: $3,718 (reported on 12.5% of returns)
Here:
$3,718
State:
$7,888
(% of AGI for various income ranges: 14.3% for AGIs below $25k, 22.1% for AGIs $25k-50k, 67.4% for AGIs $50k-75k, 81.8% for AGIs $75k-100k, 278.3% for AGIs $100k-200k, 2340.0% for AGIs over 200k)
Net capital gain/loss in AGI: +$9,592 (reported on 11.2% of returns)
Here:
+$9,592
State:
+$23,652
(% of AGI for various income ranges: 3.8% for AGIs below $25k, 13.3% for AGIs $25k-50k, 61.7% for AGIs $50k-75k, 124.0% for AGIs $75k-100k, 678.5% for AGIs $100k-200k, 11597.1% for AGIs over 200k)
Profit/loss from business: +$9,076 (reported on 14.9% of returns)
Here:
+$9,076
State:
+$11,710
(% of AGI for various income ranges: 117.9% for AGIs below $25k, 109.7% for AGIs $25k-50k, 179.0% for AGIs $50k-75k, 265.2% for AGIs $75k-100k, 480.8% for AGIs $100k-200k, 4155.7% for AGIs over 200k)
Taxable individual retirement arrangement distribution: $14,837 (reported on 8.5% of returns)
27253:
$14,837
North Carolina:
$20,247
(% of AGI for various income ranges: 52.3% for AGIs below $25k, 80.0% for AGIs $25k-50k, 206.8% for AGIs $50k-75k, 405.1% for AGIs $75k-100k, 633.1% for AGIs $100k-200k, 3181.4% for AGIs over 200k)
Self-employed (Keogh) retirement plans: $13,700 (reported on 0.2% of returns)
27253:
$13,700
North Carolina:
$26,749
(% of AGI for various income ranges: 48.4% for AGIs $75k-100k)
Total itemized deductions: $28,054 (reported on 5.1% of returns)
Here:
$28,054
State:
$34,549
(% of AGI for various income ranges: 30.9% for AGIs below $25k, 83.1% for AGIs $25k-50k, 191.3% for AGIs $50k-75k, 309.9% for AGIs $75k-100k, 928.3% for AGIs $100k-200k, 5887.1% for AGIs over 200k)
Charity contributions: $9,605 (reported on 4.3% of returns)
Here:
$9,605
State:
$13,360
(% of AGI for various income ranges: 3.9% for AGIs below $25k, 15.5% for AGIs $25k-50k, 53.4% for AGIs $50k-75k, 74.8% for AGIs $75k-100k, 296.7% for AGIs $100k-200k, 2307.1% for AGIs over 200k)
Taxes paid: $6,167 (reported on 5.1% of returns)
27253:
$6,167
State:
$7,586
(% of AGI for various income ranges: 3.0% for AGIs below $25k, 11.2% for AGIs $25k-50k, 38.9% for AGIs $50k-75k, 78.8% for AGIs $75k-100k, 248.4% for AGIs $100k-200k, 1261.4% for AGIs over 200k)
Earned income credit: $2,322 (reported on 19.9% of returns)
Here:
$2,322
State:
$2,337
(% of AGI for various income ranges: 109.3% for AGIs below $25k, 74.2% for AGIs $25k-50k, 1.1% for AGIs $50k-75k)
Percentage of individuals using paid preparers for their 2020 taxes: 90.6%
Here:
91%
State:
93%
(% for various income ranges: 88.5% for AGIs below $25k, 91.3% for AGIs $25k-50k, 91.6% for AGIs $50k-75k, 91.8% for AGIs $75k-100k, 92.8% for AGIs $100k-200k, 95.8% for AGIs over 200k)
Averages for the 2012 tax year for zip code 27253, filed in 2013:
Average Adjusted Gross Income (AGI) in 2012: $43,091 (Individual Income Tax Returns)
Here:
$43,091
State:
$54,937
Salary/wage: $38,733 (reported on 85.6% of returns)
Here:
$38,733
State:
$46,336
(% of AGI for various income ranges: 77.3% for AGIs below $25k, 81.8% for AGIs $25k-50k, 77.3% for AGIs $50k-75k, 76.9% for AGIs $75k-100k, 78.0% for AGIs $100k-200k, 54.3% for AGIs over 200k)
Taxable interest for individuals: $913 (reported on 31.1% of returns)
This zip code:
$913
North Carolina:
$1,298
(% of AGI for various income ranges: 0.8% for AGIs below $25k, 0.5% for AGIs $25k-50k, 0.7% for AGIs $50k-75k, 0.6% for AGIs $75k-100k, 0.6% for AGIs $100k-200k, 1.1% for AGIs over 200k)
Ordinary dividends: $2,993 (reported on 14.4% of returns)
Here:
$2,993
State:
$6,213
(% of AGI for various income ranges: 1.2% for AGIs below $25k, 0.7% for AGIs $25k-50k, 0.7% for AGIs $50k-75k, 1.1% for AGIs $75k-100k, 0.9% for AGIs $100k-200k, 2.6% for AGIs over 200k)
Net capital gain/loss in AGI: +$3,249 (reported on 10.7% of returns)
Here:
+$3,249
State:
+$12,740
(% of AGI for various income ranges: 0.2% for AGIs $25k-50k, 0.4% for AGIs $50k-75k, 0.8% for AGIs $75k-100k, 1.3% for AGIs $100k-200k, 4.5% for AGIs over 200k)
Profit/loss from business: +$9,559 (reported on 14.2% of returns)
Here:
+$9,559
State:
+$10,311
(% of AGI for various income ranges: 6.5% for AGIs below $25k, 2.2% for AGIs $25k-50k, 2.1% for AGIs $50k-75k, 1.8% for AGIs $75k-100k, 3.0% for AGIs $100k-200k, 7.4% for AGIs over 200k)
Taxable individual retirement arrangement distribution: $11,611 (reported on 10.1% of returns)
27253:
$11,611
North Carolina:
$15,575
(% of AGI for various income ranges: 3.0% for AGIs below $25k, 2.4% for AGIs $25k-50k, 2.7% for AGIs $50k-75k, 2.5% for AGIs $75k-100k, 3.0% for AGIs $100k-200k, 2.9% for AGIs over 200k)
Self-employment retirement plans: $17,433 (reported on 0.2% of returns)
27253:
$17,433
North Carolina:
$21,078
Total itemized deductions: $18,497 (24% of AGI, reported on 30.2% of returns)
Here:
$18,497
State:
$23,438
Here:
24.0% of AGI
State:
21.5% of AGI
(% of AGI for various income ranges: 7.3% for AGIs below $25k, 11.0% for AGIs $25k-50k, 13.8% for AGIs $50k-75k, 14.8% for AGIs $75k-100k, 16.0% for AGIs $100k-200k, 13.6% for AGIs over 200k)
Charity contributions: $3,690 (reported on 24.6% of returns)
Here:
$3,690
State:
$4,687
(% of AGI for various income ranges: 0.8% for AGIs below $25k, 1.6% for AGIs $25k-50k, 2.3% for AGIs $50k-75k, 2.4% for AGIs $75k-100k, 2.7% for AGIs $100k-200k, 3.0% for AGIs over 200k)
Taxes paid: $5,900 (reported on 30.2% of returns)
27253:
$5,900
State:
$8,823
(% of AGI for various income ranges: 1.1% for AGIs below $25k, 2.4% for AGIs $25k-50k, 3.9% for AGIs $50k-75k, 5.0% for AGIs $75k-100k, 6.6% for AGIs $100k-200k, 6.5% for AGIs over 200k)
Earned income credit: $2,339 (reported on 23.6% of returns)
Here:
$2,339
State:
$2,376
(% of AGI for various income ranges: 7.9% for AGIs below $25k, 1.3% for AGIs $25k-50k)
Percentage of individuals using paid preparers for their 2012 taxes: 50.2%
Here:
50%
State:
53%
(% for various income ranges: 49.5% for AGIs below $25k, 49.1% for AGIs $25k-50k, 50.0% for AGIs $50k-75k, 53.0% for AGIs $75k-100k, 52.1% for AGIs $100k-200k, 80.0% for AGIs over 200k)
Averages for the 2004 tax year for zip code 27253, filed in 2005:
Average Adjusted Gross Income (AGI) in 2004: $37,913 (Individual Income Tax Returns)
Here:
$37,913
State:
$45,376
Salary/wage: $35,009 (reported on 86.9% of returns)
Here:
$35,009
State:
$39,442
(% of AGI for various income ranges: 136.6% for AGIs below $10k, 81.0% for AGIs $10k-25k, 83.7% for AGIs $25k-50k, 83.2% for AGIs $50k-75k, 82.3% for AGIs $75k-100k, 65.5% for AGIs over 100k)
Taxable interest for individuals: $1,186 (reported on 38.1% of returns)
This zip code:
$1,186
North Carolina:
$1,515
(% of AGI for various income ranges: 4.9% for AGIs below $10k, 1.3% for AGIs $10k-25k, 1.1% for AGIs $25k-50k, 0.9% for AGIs $50k-75k, 0.8% for AGIs $75k-100k, 1.7% for AGIs over 100k)
Taxable dividends: $2,318 (reported on 17.6% of returns)
Here:
$2,318
State:
$4,016
(% of AGI for various income ranges: 3.0% for AGIs below $10k, 0.8% for AGIs $10k-25k, 0.8% for AGIs $25k-50k, 0.9% for AGIs $50k-75k, 0.7% for AGIs $75k-100k, 1.8% for AGIs over 100k)
Net capital gain/loss: +$8,087 (reported on 13.2% of returns)
Here:
+$8,087
State:
+$11,152
(% of AGI for various income ranges: 1.7% for AGIs below $10k, 0.1% for AGIs $10k-25k, 0.6% for AGIs $25k-50k, 0.5% for AGIs $50k-75k, 1.4% for AGIs $75k-100k, 11.5% for AGIs over 100k)
Profit/loss from business: +$7,472 (reported on 13.6% of returns)
Here:
+$7,472
State:
+$9,490
(% of AGI for various income ranges: 5.8% for AGIs below $10k, 3.5% for AGIs $10k-25k, 2.5% for AGIs $25k-50k, 1.8% for AGIs $50k-75k, 1.8% for AGIs $75k-100k, 3.9% for AGIs over 100k)
IRA payment deduction: $2,720 (reported on 2.2% of returns)
27253:
$2,720
North Carolina:
$2,967
(% of AGI for various income ranges: 0.2% for AGIs $10k-25k, 0.2% for AGIs $25k-50k, 0.2% for AGIs $50k-75k, 0.1% for AGIs $75k-100k, 0.1% for AGIs over 100k)
Self-employed pension: $7,390 (reported on 0.4% of returns)
Here:
$7,390
North Carolina:
$14,754
(% of AGI for various income ranges: 0.1% for AGIs $10k-25k, 0.1% for AGIs $50k-75k, 0.2% for AGIs over 100k)
Total itemized deductions: $16,031 (24% of AGI, reported on 33.8% of returns)
Here:
$16,031
State:
$19,464
Here:
24.0% of AGI
State:
22.7% of AGI
(% of AGI for various income ranges: 12.8% for AGIs below $10k, 7.8% for AGIs $10k-25k, 13.0% for AGIs $25k-50k, 15.9% for AGIs $50k-75k, 17.4% for AGIs $75k-100k, 15.7% for AGIs over 100k)
Charity contributions deductions: $3,253 (5% of AGI, reported on 29.2% of returns)
Here:
$3,253
State:
$4,035
Here:
4.7% of AGI
State:
4.5% of AGI
(% of AGI for various income ranges: 1.2% for AGIs below $10k, 1.1% for AGIs $10k-25k, 2.0% for AGIs $25k-50k, 2.6% for AGIs $50k-75k, 2.7% for AGIs $75k-100k, 3.8% for AGIs over 100k)
Total tax: $4,728 (reported on 70.8% of returns)
27253:
$4,728
State:
$7,257
(% of AGI for various income ranges: 3.6% for AGIs below $10k, 3.3% for AGIs $10k-25k, 6.3% for AGIs $25k-50k, 8.4% for AGIs $50k-75k, 10.0% for AGIs $75k-100k, 15.8% for AGIs over 100k)
Earned income credit: $1,785 (reported on 19.7% of returns)
Here:
$1,785
State:
$1,851
Percentage of individuals using paid preparers for their 2004 taxes: 57.0%
Here:
57%
State:
62%
(% for various income ranges: 51.0% for AGIs below $10k, 60.5% for AGIs $10k-25k, 56.6% for AGIs $25k-50k, 56.7% for AGIs $50k-75k, 54.5% for AGIs $75k-100k, 66.3% for AGIs over 100k)
Likely homosexual households (counted as self-reported same-sex unmarried-partner households)
Lesbian couples: 0.0% of all households
Gay men: 0.1% of all households
Household received Food Stamps/SNAP in the past 12 months: 2,155 Household did not receive Food Stamps/SNAP in the past 12 months: 11,737
Women who had a birth in the past 12 months: 477 (290 now married, 184 unmarried) Women who did not have a birth in the past 12 months: 6,725 (2,843 now married, 3,880 unmarried)
Housing units in zip code 27253 with a mortgage: 5,909 (680 second mortgage, 11 home equity loan, 624 both second mortgage and home equity loan) Houses without a mortgage: 94
Median monthly owner costs for units with a mortgage: $1,201 Median monthly owner costs for units without a mortgage: $366
Residents with income below the poverty level in 2022:
This zip code:
13.5%
Whole state:
12.8%
Residents with income below 50% of the poverty level in 2022:
This zip code:
7.0%
Whole state:
6.8%
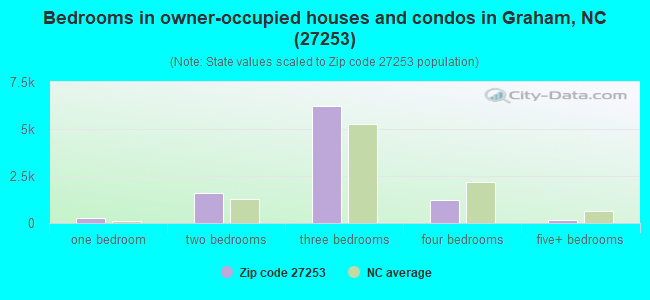
Median number of rooms in houses and condos:
Here:
6.0
State:
6.4
Median number of rooms in apartments:
Here:
4.5
State:
4.4
Notable locations in this zip code not listed on our city pages
Notable locations in zip code 27253: Quarry Hills Country Club and Golf Course (A), Ray Street Recreation Center (B). Display/hide their locations on the map
Churches in zip code 27253 include: Greenway Park Church (A), Hico Church (B), Bethany Church (C), Maxwell Chapel (D), Moores Chapel (E), Burnetts Chapel (F), Mount Hermon Church (G), Woods Chapel (H), Cedar Cliff Church (I). Display/hide their locations on the map
Streams, rivers, and creeks: Bowden Branch (A), Big Branch (B), Big Alamance Creek (C), Varnals Creek (D), Back Creek (E), Pine Hill Branch (F), Motes Creek (G), Meadow Creek (H), Marys Creek (I). Display/hide their locations on the map
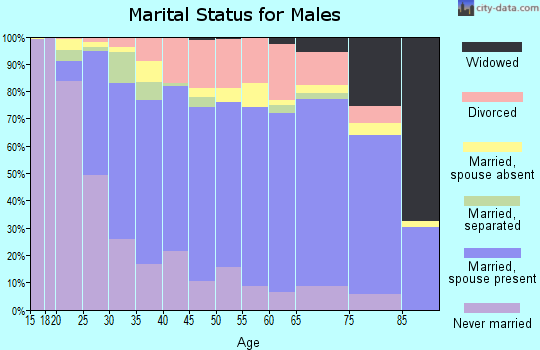
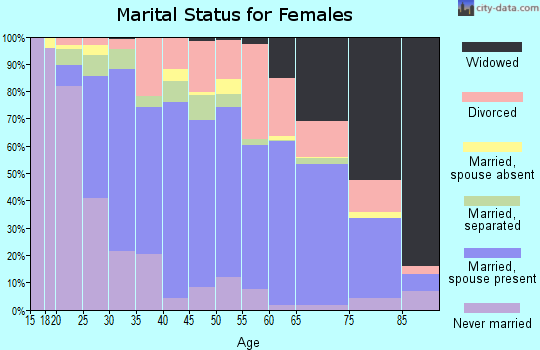
4,000 married couples with children.
1,720 single-parent households (290 men, 1,430 women).
86.2% of residents of 27253 zip code speak English at home.
11.5% of residents speak Spanish at home (62% very well, 14% well, 14% not well, 9% not at all).
0.9% of residents speak other Indo-European language at home (68% very well, 32% well).
0.5% of residents speak Asian or Pacific Island language at home (74% very well, 18% well, 4% not well, 5% not at all).
0.9% of residents speak other language at home (93% very well, 7% not well).
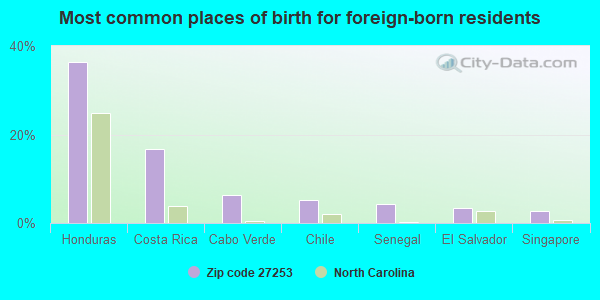
Foreign born population: 2,642 (8.3%) (44.7% of them are naturalized citizens)
This zip code:
8.3%
Whole state:
8.6%
36%Honduras
17%Costa Rica
6%Cabo Verde
5%Chile
4%Senegal
3%El Salvador
3%Singapore
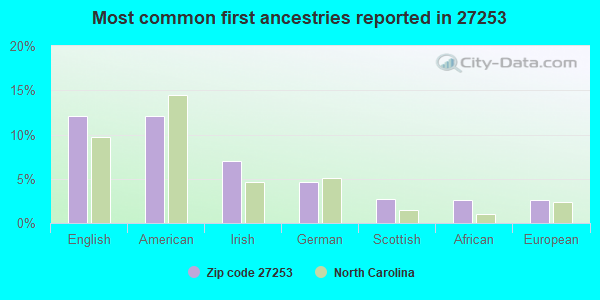
12%English
12%American
7%Irish
5%German
3%Scottish
3%African
3%European
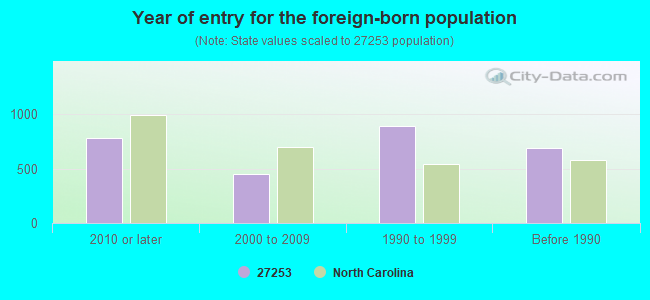
Year of entry for the foreign-born population
7772010 or later
4512000 to 2009
8931990 to 1999
689Before 1990
Major facilities with environmental interests located in this zip code:
BRAXTON S SAWMILL (7519 D LINDLEY MILL ROAD in GRAHAM, NC)
AIR MINOR (AIRS/AFS) STATE MASTER (North Carolina facility info) - AIR PROGRAM STATE MASTER (North Carolina facility info) - -115DA4YG00M69W84AY3WGEUB19, WASTEWATER FACILITY National Pollutant Discharge Elimination System NON-MAJOR (Tracking pollutant discharge elimination systems) - permit National Pollutant Discharge Elimination System NON-MAJOR (Tracking pollutant discharge elimination systems) - permit Business SIC classification: SAWMILLS AND PLANING MILLS, GENERAL Business NAICS classification: SAWMILLS. Alternative names: BRAXTON SAWMILL, INC., BRAXTON'S SAWMILL
APOLLO CHEMICAL CORPORATION (1105 SOUTHERLAND DRIVE in GRAHAM, NC)
AIR MINOR (AIRS/AFS) STATE MASTER (North Carolina facility info) - UNDERGROUND STORAGE TANK PROGRAM, -115DA4YG00M29W84AX3Y80HF6T, WASTEWATER FACILITY, -4436, AIR PROGRAM CRITERIA AND HAZARDOUS AIR POLLUTANT INVENTORY (Inventory of air pollution sources) National Pollutant Discharge Elimination System NON-MAJOR (Tracking pollutant discharge elimination systems) - permit Conditionally Exempt Small Quantity Generators, less than 100 kg/month of hazardous waste (Resource Conservation and Recovery Act (tracking hazardous waste)) - notification TRI REPORTER (Tracking of toxic chemicals releasing facilities) Business SIC classification: SOAP AND OTHER DETERGENTS, EXCEPT SPECIALTY CLEANERS; SURFACE ACTIVE AGENTS, FINISHING AGENTS, SULFONATED OILS, AND ASSISTANTS; NONCLASSIFIABLE ESTABLISHMENTS Business NAICS classification: SOAP AND OTHER DETERGENT MANUFACTURING.; SURFACE ACTIVE AGENT MANUFACTURING. Organizations: DEXTER R. BARBEE (CONTACT/OWNER)
ALEXANDER WILSON ELEMENTARY S (2518 NC 54 in GRAHAM, NC)
STATE MASTER (North Carolina facility info) - UNDERGROUND STORAGE TANK PROGRAM (National Center for Education Statistics) - STATE ID-304 Business SIC classification: NONCLASSIFIABLE ESTABLISHMENTS Organizations: ALAMANCE-BURLINGTON SCHOOLS (SCHOOL DISTRICT)
AMETEK INCORPORATED LAMB ELECTRIC DIVISION (704 MYRTLE DRIVE in GRAHAM, NC)
AIR MINOR (AIRS/AFS) STATE MASTER (North Carolina facility info) - UNDERGROUND STORAGE TANK PROGRAM, -115DA4YG00M29W84AX3YRA1WXV, WASTEWATER FACILITY, -3660, AIR PROGRAM CRITERIA AND HAZARDOUS AIR POLLUTANT INVENTORY (Inventory of air pollution sources) Conditionally Exempt Small Quantity Generators, less than 100 kg/month of hazardous waste (Resource Conservation and Recovery Act (tracking hazardous waste)) - notification Business SIC classification: MOTORS AND GENERATORS; RELAYS AND INDUSTRIAL CONTROLS; NONCLASSIFIABLE ESTABLISHMENTS Business NAICS classification: MOTOR AND GENERATOR MANUFACTURING.; MOTOR AND GENERATOR MANUFACTURING. Alternative names: AMETEK LAMB ELECTRIC
CITY OF BURLINGTON - SOUTH BURLINGTON WWTP (2471 BOYWOOD ROAD in GRAHAM, NC)
AIR MINOR (AIRS/AFS) STATE MASTER (North Carolina facility info) - -115DA4YG00M69W84AY3W843HGQ, WASTEWATER FACILITY, -3688, AIR PROGRAM CRITERIA AND HAZARDOUS AIR POLLUTANT INVENTORY (Inventory of air pollution sources) National Pollutant Discharge Elimination System MAJOR (Tracking pollutant discharge elimination systems) - permit Business SIC classification: SEWERAGE SYSTEMS Alternative names: BURLINGTON - SOUTHSIDE WWTP, city of BURLINGTON WASTEWATER TREATMENT PLANT
CAROLINA FINISHING OF NORTH CAROLINA, LIMITED LIABILITY COMPANY (7141 I-85 SERVICE ROAD WEST in GRAHAM, NC)
AIR MINOR (AIRS/AFS) STATE MASTER (North Carolina facility info) - AIR PROGRAM CRITERIA AND HAZARDOUS AIR POLLUTANT INVENTORY (Inventory of air pollution sources) Business SIC classification: FINISHERS OF BROADWOVEN FABRICS OF MANMADE FIBER AND SILK Business NAICS classification: BROADWOVEN FABRIC FINISHING MILLS.; BROADWOVEN FABRIC FINISHING MILLS. Alternative names: ARMSTRONG FINISHING LIMITED LIABILITY COMPANY, CAROLINA FINISHING OF NORTH CAROLINA LLC
A.T. WILLIAMS OIL CO-ALAMANCE (JIMMY KERR ROAD & I85 in GRAHAM, NC)
STATE MASTER (North Carolina facility info) - -115DA4YG00M29W84AX3X02DCF0, WASTEWATER FACILITY National Pollutant Discharge Elimination System NON-MAJOR (Tracking pollutant discharge elimination systems) - permit Business SIC classification: GASOLINE SERVICE STATIONS Alternative names: AT WILLIAMS OIL COMPANY
BARBOUR, KERMIT T. - RESIDENCE (2523 LOVETTE LANE in GRAHAM, NC)
STATE MASTER (North Carolina facility info) - -115DA4YG00M29W84AY3XG5AA0G, WASTEWATER FACILITY National Pollutant Discharge Elimination System NON-MAJOR (Tracking pollutant discharge elimination systems) - permit Business SIC classification: SEWERAGE SYSTEMS
BERICO FUELS (4848 NC HIGHWAY 54 EAST in GRAHAM, NC)
STATE MASTER (North Carolina facility info) - -115DA4YG00M65D64FBEMG6YS18, WASTEWATER FACILITY National Pollutant Discharge Elimination System NON-MAJOR (Tracking pollutant discharge elimination systems) - permit Business SIC classification: WATER SUPPLY Alternative names: BERICO FUELS - TALBERTS FOOD, T A C INC TALBERTS GROCERY FOR
CAGLE, RUBY (1618 PETTY ROAD in GRAHAM, NC)
STATE MASTER (North Carolina facility info) - -115DA4YG00M69W84AY3XRAD5HU, WASTEWATER FACILITY National Pollutant Discharge Elimination System NON-MAJOR (Tracking pollutant discharge elimination systems) - permit Business SIC classification: SEWERAGE SYSTEMS Alternative names: CAGLE, RUBY - RESIDENCE
CITY OF GRAHAM WASTEWATER TREATMENT PLANT (1204 E GILBREATH ST in GRAHAM, NC)
AIR SYNTHETIC MINOR (AIRS/AFS) STATE MASTER (North Carolina facility info) - -115DA4YG00UT2W84DX0J856U1G, WASTEWATER FACILITY, -4485, AIR PROGRAM, -115DA4YG00UT2W84DX0J8502HP, WASTEWATER FACILITY CRITERIA AND HAZARDOUS AIR POLLUTANT INVENTORY (Inventory of air pollution sources) Business SIC classification: SEWERAGE SYSTEMS; NONCLASSIFIABLE ESTABLISHMENTS
BLYTHE CONSTRUCTION INCORPORATED PLANT #7 (900 JIMMY KERR ROAD in GRAHAM, NC)
AIR SYNTHETIC MINOR (AIRS/AFS) STATE MASTER (North Carolina facility info) - AIR PROGRAM Business SIC classification: ASPHALT PAVING MIXTURES AND BLOCKS Business NAICS classification: ASPHALT PAVING MIXTURE AND BLOCK MANUFACTURING. Alternative names: BLYTHE INDUSTRIES INCORPORATED PLANT 7, BLYTHE INDUSTRIES INCORPORATED PLANT 7 INACTI
ACUCOTE INCORPORATED - GRAHAM (910 E ELM ST in GRAHAM, NC)
National Pollutant Discharge Elimination System NON-MAJOR (Tracking pollutant discharge elimination systems) - permit Conditionally Exempt Small Quantity Generators, less than 100 kg/month of hazardous waste (Resource Conservation and Recovery Act (tracking hazardous waste)) - notification Business SIC classification: PACKAGING PAPER AND PLASTICS FILM, COATED AND LAMINATED Organizations: JOHN B LEATH JR (CONTACT/OWNER)
Housing units lacking complete plumbing facilities: 2.3% Housing units lacking complete kitchen facilities: 1.8%
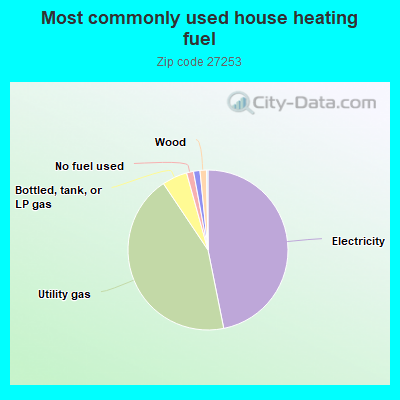
46.9%Electricity
43.8%Utility gas
5.1%Bottled, tank, or LP gas
1.4%No fuel used
1.3%Fuel oil, kerosene, etc.
1.3%Wood
Population in 1990: 19,723. Population change in the 1990s: +5,475 (+27.8%).
Place of birth for U.S.-born residents:
This state: 20,088
Northeast: 3,041
Midwest: 1,817
South: 3,171
West: 833
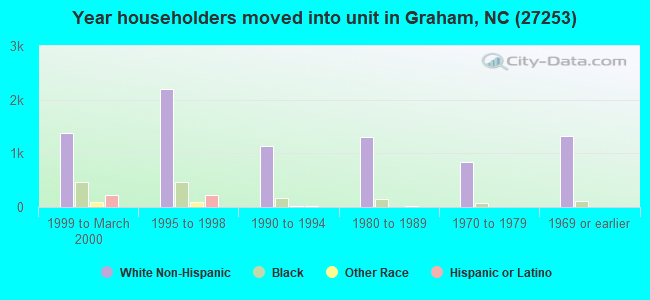
54% of the 27253 zip code residents lived in the same house 5 years ago. Out of people who lived in different houses, 64% lived in this county. Out of people who lived in different counties, 50% lived in North Carolina.
90% of the 27253 zip code residents lived in the same house 1 year ago. Out of people who lived in different houses, 47% moved from this county. Out of people who lived in different houses, 27% moved from different county within same state. Out of people who lived in different houses, 24% moved from different state. Out of people who lived in different houses, 2% moved from abroad.
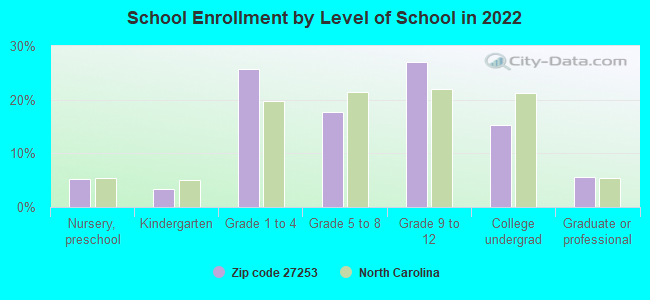
Private vs. public school enrollment:
Students in private schools in grades 1 to 8 (elementary and middle school): 400
Here:
15.4%
North Carolina:
13.8%
Students in private schools in grades 9 to 12 (high school): 261
Here:
16.1%
North Carolina:
11.9%
Students in private undergraduate colleges: 135
Here:
14.9%
North Carolina:
19.3%
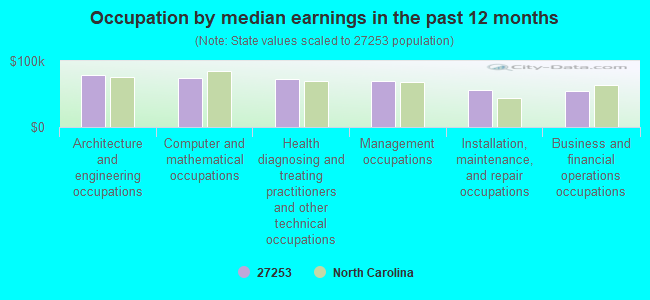
Occupation by median earnings in the past 12 months ($)
78,281Architecture and engineering occupations
73,592Computer and mathematical occupations
73,407Health diagnosing and treating practitioners and other technical occupations
68,950Management occupations
56,489Installation, maintenance, and repair occupations
54,206Business and financial operations occupations
Companies with federal contracts located in this zip code (GRAHAM, NC):
J M HOLT & SONS CONSTRUCTION I (2914 S HWY 87; small business) 70 employees, $6406756 revenue. : $568,000 in 2 contractsfrom 2000 to 2001
$566,000 with NASA for Maintenance, Repair or Alteration of Real Property -- Other Utilities. Taking place in VA. Signed on 2000-09-15. Completion date: 2001-10-15.
$2,000, same as above.Signed on 2001-01-15. Completion date: 2001-10-15.
POWER BACK UPS & SOLUTIONS, IN (113 N MAIN ST; small business) : $56,419 in 4 contractsfrom 2004 to 2005
$36,800 with Navy for Maintenance, Repair and Rebuilding of Equipment -- Electrical and Electronic Equipment Components. Signed on 2004-06-08. Completion date: 2004-06-28.
$9,620 with Navy for Converters, Electrical, Nonrotating. Signed on 2004-08-02. Completion date: 2004-08-06.
$5,749 with Air Force for ADP Support Equipment. Signed on 2005-03-31. Completion date: 2005-04-21.
$4,250 with Navy for Other Quality Control, Testing and Inspection Services -- Miscellaneous. Signed on 2005-04-27. Completion date: 2006-04-30.
MAP ENTERPRISES INC (610 E HANOVER RD; small business) : $36,330 in 15 contractsfrom 2003 to 2005
Contracts for Maintenance, Repair and Rebuilding of Equipment -- Engines, Turbines, and Components, Maintenance, Repair and Rebuilding of Equipment -- Vehicular Equipment Components, Liquid and Gas Flow, Liquid Level, and Mechanical Motion Measuring Instruments, Miscellaneous Items, and moreby Army, Defense Logistics Agency Signed by year:2000: $0; 2001: $0; 2002: $0; 2003: $6,160; 2004: $10,140; 2005: $20,030; 2006: $0.
Biggest contracts:
$9,023 with Army for Maintenance, Repair and Rebuilding of Equipment -- Engines, Turbines, and Components. Signed on 2005-05-18. Completion date: 2005-06-22.
$6,667, same as above.Signed on 2005-05-18. Completion date: 2005-06-22.
$5,100 with Army for Maintenance, Repair and Rebuilding of Equipment -- Vehicular Equipment Components. Taking place in VA. Signed on 2004-01-16. Completion date: 2004-02-06.
$3,640 with Defense Logistics Agency for Liquid and Gas Flow, Liquid Level, and Mechanical Motion Measuring Instruments. Signed on 2005-10-17. Completion date: 2006-09-30.
PURE FLOW INC (1241 JAY LN; small business) : $22,102 in 3 contractsfrom 2005 to 2006
$21,552 with Navy for Water Purification Equipment. Taking place in VA. Signed on 2005-10-03. Completion date: 2006-09-30.
$450, same as above.Signed on 2006-04-10. Completion date: 2006-09-30.
$100, same as above.Signed on 2006-04-19. Completion date: 2006-09-30.
STATE CONSTRUCTION INC (2103 LONG DAIRY RD; small business)
$4,847 with Army for Trucks and Truck Tractors, Wheeled. Signed on 2006-02-21. Completion date: 2006-03-10.
PREMISE NETWORKS, INC (822-A EAST HANOVER ROAD; small business)
$3,504 with Army for Construction of Structures and Facilities -- Highways, Roads, Streets, Bridges, and Railways (includes resurfacing). Signed on 2004-04-01. Completion date: 2004-04-12.
BRM RESOURCES (909 MARTIN AVE; small business)
$2,700 with Army for Technical Assistance. Signed on 2005-07-08. Completion date: 2005-08-31.
Top industries in this zip code by the number of employees in 2005:
2002 - 2018 National Fire Incident Reporting System (NFIRS) incidents
Based on the data from the years 2002 - 2018 the average number of fires per year is 79. The highest number of reported fires - 121 took place in 2004, and the least - 22 in 2002. The data has a growing trend.
When looking into fire subcategories, the most incidents belonged to: Outside Fires (42.9%), and Structure Fires (34.4%).
Fire incident types reported to NFIRS in Zip Code 27253

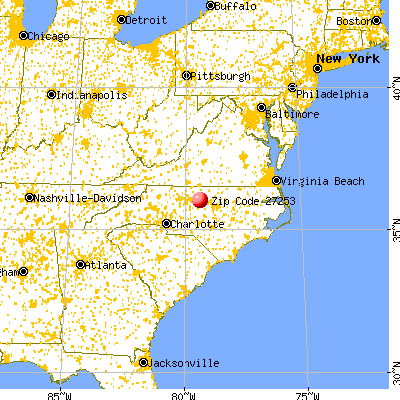


 Nearest zip codes: 27340, 27258, 27349, 27201, 27215, 27243.


 Based on the data from the years 2002 - 2018 the average number of fires per year is 79. The highest number of reported fires - 121 took place in 2004, and the least - 22 in 2002. The data has a growing trend.
 When looking into fire subcategories, the most incidents belonged to: Outside Fires (42.9%), and Structure Fires (34.4%).