Estimated zip code population in 2022: 2,768 Zip code population in 2010: 2,660 Zip code population in 2000: 2,493
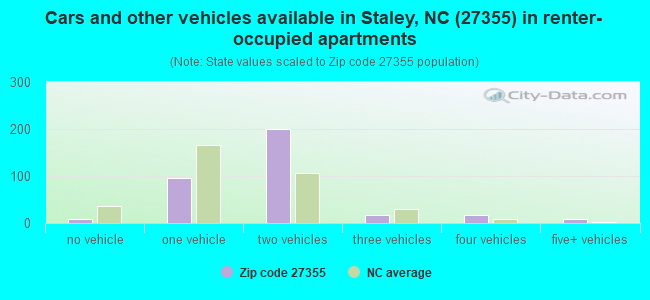
Houses and condos: 1,107 Renter-occupied apartments: 341
% of renters here:
33%
State:
33%
March 2022 cost of living index in zip code 27355: 79.9 (low, U.S. average is 100)
Land area: 34.5 sq. mi. Water area: 0.1 sq. mi.
Population density: 80 people per square mile
(very low).
OSM Map
General Map
Google Map
MSN Map
OSM Map
General Map
Google Map
MSN Map
OSM Map
General Map
Google Map
MSN Map
OSM Map
General Map
Google Map
MSN Map
Please wait while loading the map...
Real estate property taxes paid for housing units in 2022:
This zip code:
0.6% ($1,249)
North Carolina:
0.6% ($1,769)
Median real estate property taxes paid for housing units with mortgages in 2022: $1,632 (0.7%) Median real estate property taxes paid for housing units with no mortgage in 2022: $759 (0.7%)
Business Search- 14 Million verified businesses
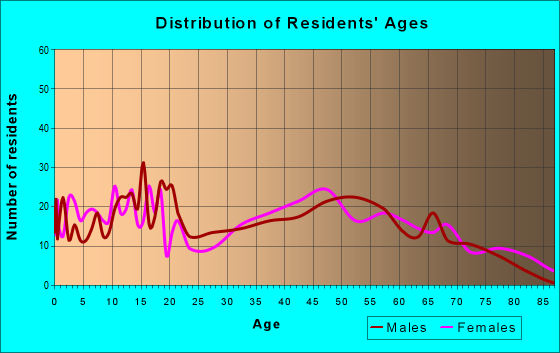
Males: 1,596
(57.7%)
Females: 1,170
(42.3%)
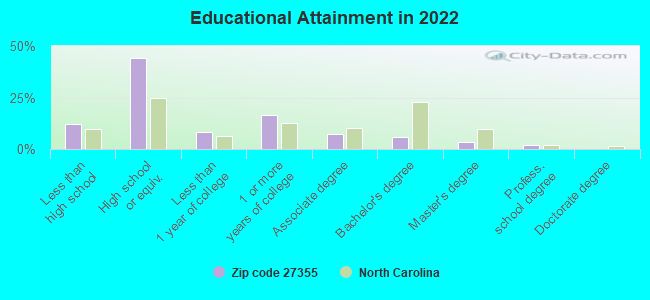
For population 25 years and over in 27355:
High school or higher: 86.0%
Bachelor's degree or higher: 11.5%
Graduate or professional degree: 5.7%
Unemployed: 1.1%
Mean travel time to work (commute): 25.0 minutes
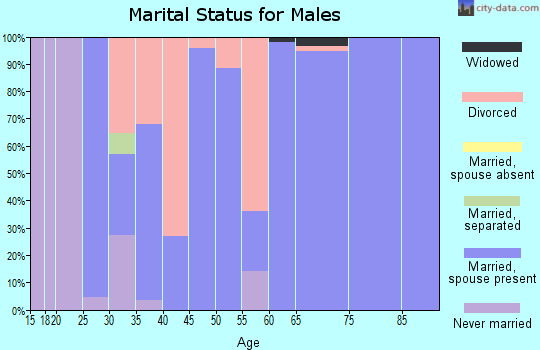
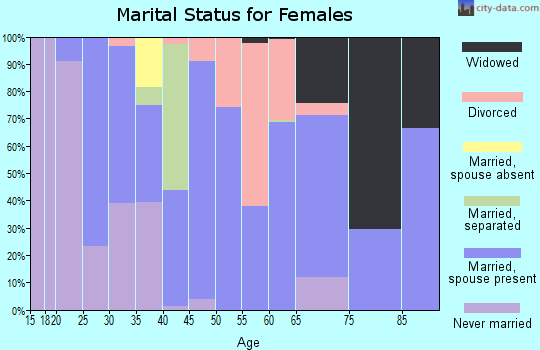
For population 15 years and over in 27355:
Never married: 29.7%
Now married: 50.3%
Separated: 4.5%
Widowed: 6.2%
Divorced: 9.3%
Zip code 27355 compared to state average:
Unemployed percentage significantly below state average.
Length of stay since moving in significantly above state average.
Percentage of population with a bachelor's degree or higher significantly below state average.
Averages for the 2020 tax year for zip code 27355, filed in 2021:
Average Adjusted Gross Income (AGI) in 2020: $47,253 (Individual Income Tax Returns)
Here:
$47,253
State:
$70,020
Salary/wage: $42,944 (reported on 82.8% of returns)
Here:
$42,944
State:
$58,387
(% of AGI for various income ranges: 1273.9% for AGIs below $25k, 3752.2% for AGIs $25k-50k, 6598.5% for AGIs $50k-75k, 11195.0% for AGIs $75k-100k, 23702.0% for AGIs $100k-200k)
Taxable interest for individuals: $489 (reported on 24.1% of returns)
This zip code:
$489
North Carolina:
$1,479
(% of AGI for various income ranges: 7.4% for AGIs below $25k, 11.9% for AGIs $25k-50k, 23.1% for AGIs $50k-75k, 18.3% for AGIs $75k-100k, 82.0% for AGIs $100k-200k)
Ordinary dividends: $1,773 (reported on 9.5% of returns)
Here:
$1,773
State:
$7,888
(% of AGI for various income ranges: 2.6% for AGIs below $25k, 6.7% for AGIs $25k-50k, 30.8% for AGIs $50k-75k, 258.0% for AGIs $100k-200k)
Net capital gain/loss in AGI: +$8,200 (reported on 9.5% of returns)
Here:
+$8,200
State:
+$23,652
(% of AGI for various income ranges: 43.7% for AGIs $25k-50k, 6.2% for AGIs $50k-75k, 1554.0% for AGIs $100k-200k)
Profit/loss from business: +$8,660 (reported on 17.2% of returns)
Here:
+$8,660
State:
+$11,710
(% of AGI for various income ranges: 147.4% for AGIs below $25k, 121.5% for AGIs $25k-50k, 575.4% for AGIs $50k-75k, 398.0% for AGIs $100k-200k)
Taxable individual retirement arrangement distribution: $10,189 (reported on 7.8% of returns)
27355:
$10,189
North Carolina:
$20,247
(% of AGI for various income ranges: 58.7% for AGIs below $25k, 160.0% for AGIs $25k-50k, 505.0% for AGIs $75k-100k)
Total itemized deductions: $22,633 (reported on 2.6% of returns)
Here:
$22,633
State:
$34,549
(% of AGI for various income ranges: 522.3% for AGIs $50k-75k)
Charity contributions: $7,000 (reported on 1.7% of returns)
Here:
$7,000
State:
$13,360
(% of AGI for various income ranges: 51.9% for AGIs $25k-50k)
Taxes paid: $6,500 (reported on 2.6% of returns)
27355:
$6,500
State:
$7,586
(% of AGI for various income ranges: 150.0% for AGIs $50k-75k)
Earned income credit: $2,188 (reported on 20.7% of returns)
Here:
$2,188
State:
$2,337
(% of AGI for various income ranges: 104.8% for AGIs below $25k, 74.1% for AGIs $25k-50k)
Percentage of individuals using paid preparers for their 2020 taxes: 92.2%
Here:
92%
State:
93%
(% for various income ranges: 90.7% for AGIs below $25k, 94.1% for AGIs $25k-50k, 94.4% for AGIs $50k-75k, 90.0% for AGIs $75k-100k, 90.9% for AGIs $100k-200k)
Averages for the 2012 tax year for zip code 27355, filed in 2013:
Average Adjusted Gross Income (AGI) in 2012: $35,411 (Individual Income Tax Returns)
Here:
$35,411
State:
$54,937
Salary/wage: $33,133 (reported on 83.0% of returns)
Here:
$33,133
State:
$46,336
(% of AGI for various income ranges: 77.4% for AGIs below $25k, 79.7% for AGIs $25k-50k, 77.1% for AGIs $50k-75k, 83.5% for AGIs $75k-100k, 70.4% for AGIs $100k-200k)
Taxable interest for individuals: $600 (reported on 25.0% of returns)
This zip code:
$600
North Carolina:
$1,298
(% of AGI for various income ranges: 0.9% for AGIs below $25k, 0.4% for AGIs $25k-50k, 0.2% for AGIs $75k-100k, 0.6% for AGIs $100k-200k)
Ordinary dividends: $1,482 (reported on 9.8% of returns)
Here:
$1,482
State:
$6,213
(% of AGI for various income ranges: 0.2% for AGIs below $25k, 1.1% for AGIs $25k-50k, 0.1% for AGIs $50k-75k, 0.2% for AGIs $75k-100k)
Net capital gain/loss in AGI: +$450 (reported on 7.1% of returns)
Here:
+$450
State:
+$12,740
Profit/loss from business: +$8,825 (reported on 14.3% of returns)
Here:
+$8,825
State:
+$10,311
(% of AGI for various income ranges: 7.5% for AGIs below $25k, 3.3% for AGIs $25k-50k, 0.6% for AGIs $50k-75k, 8.1% for AGIs $75k-100k)
Taxable individual retirement arrangement distribution: $9,575 (reported on 7.1% of returns)
27355:
$9,575
North Carolina:
$15,575
(% of AGI for various income ranges: 2.1% for AGIs below $25k, 2.2% for AGIs $25k-50k, 4.2% for AGIs $50k-75k)
Total itemized deductions: $16,326 (25% of AGI, reported on 24.1% of returns)
Here:
$16,326
State:
$23,438
Here:
24.8% of AGI
State:
21.5% of AGI
(% of AGI for various income ranges: 6.5% for AGIs below $25k, 9.4% for AGIs $25k-50k, 11.7% for AGIs $50k-75k, 14.9% for AGIs $75k-100k, 14.8% for AGIs $100k-200k)
Charity contributions: $3,623 (reported on 19.6% of returns)
Here:
$3,623
State:
$4,687
(% of AGI for various income ranges: 1.0% for AGIs below $25k, 1.8% for AGIs $25k-50k, 1.6% for AGIs $50k-75k, 2.8% for AGIs $75k-100k, 3.3% for AGIs $100k-200k)
Taxes paid: $4,807 (reported on 24.1% of returns)
27355:
$4,807
State:
$8,823
(% of AGI for various income ranges: 0.8% for AGIs below $25k, 2.3% for AGIs $25k-50k, 3.0% for AGIs $50k-75k, 5.3% for AGIs $75k-100k, 6.2% for AGIs $100k-200k)
Earned income credit: $2,352 (reported on 25.9% of returns)
Here:
$2,352
State:
$2,376
(% of AGI for various income ranges: 8.1% for AGIs below $25k, 1.1% for AGIs $25k-50k)
Percentage of individuals using paid preparers for their 2012 taxes: 62.5%
Here:
62%
State:
53%
(% for various income ranges: 59.3% for AGIs below $25k, 65.6% for AGIs $25k-50k, 64.3% for AGIs $50k-75k, 71.4% for AGIs $75k-100k, 60.0% for AGIs $100k-200k)
Averages for the 2004 tax year for zip code 27355, filed in 2005:
Average Adjusted Gross Income (AGI) in 2004: $32,560 (Individual Income Tax Returns)
Here:
$32,560
State:
$45,376
Salary/wage: $31,410 (reported on 87.0% of returns)
Here:
$31,410
State:
$39,442
(% of AGI for various income ranges: 94.4% for AGIs below $10k, 81.6% for AGIs $10k-25k, 87.9% for AGIs $25k-50k, 85.3% for AGIs $50k-75k, 77.2% for AGIs $75k-100k, 73.7% for AGIs over 100k)
Taxable interest for individuals: $885 (reported on 32.9% of returns)
This zip code:
$885
North Carolina:
$1,515
(% of AGI for various income ranges: 4.5% for AGIs below $10k, 2.0% for AGIs $10k-25k, 0.9% for AGIs $25k-50k, 0.5% for AGIs $50k-75k, 0.2% for AGIs $75k-100k, 0.3% for AGIs over 100k)
Taxable dividends: $422 (reported on 12.4% of returns)
Here:
$422
State:
$4,016
(% of AGI for various income ranges: 0.4% for AGIs below $10k, 0.1% for AGIs $10k-25k, 0.2% for AGIs $25k-50k, 0.2% for AGIs $50k-75k, 0.2% for AGIs over 100k)
Net capital gain/loss: +$2,000 (reported on 9.2% of returns)
Here:
+$2,000
State:
+$11,152
(% of AGI for various income ranges: -0.6% for AGIs $10k-25k, 0.3% for AGIs $25k-50k, 1.3% for AGIs $50k-75k, 1.6% for AGIs over 100k)
Profit/loss from business: +$4,539 (reported on 17.4% of returns)
Here:
+$4,539
State:
+$9,490
(% of AGI for various income ranges: 15.4% for AGIs below $10k, 6.4% for AGIs $10k-25k, 1.8% for AGIs $25k-50k, 1.8% for AGIs $50k-75k)
Profit/loss from farming: +$2,812 (reported on 6.7% of returns)
Here:
+$2,812
State:
-$3,231
(% of AGI for various income ranges: 1.6% for AGIs below $10k, -0.7% for AGIs $10k-25k, 0.6% for AGIs $25k-50k, 1.4% for AGIs $50k-75k)
IRA payment deduction: $3,619 (reported on 2.0% of returns)
27355:
$3,619
North Carolina:
$2,967
Total itemized deductions: $14,348 (26% of AGI, reported on 30.0% of returns)
Here:
$14,348
State:
$19,464
Here:
26.1% of AGI
State:
22.7% of AGI
(% of AGI for various income ranges: 10.7% for AGIs below $10k, 7.5% for AGIs $10k-25k, 11.5% for AGIs $25k-50k, 16.2% for AGIs $50k-75k, 16.0% for AGIs $75k-100k, 16.4% for AGIs over 100k)
Charity contributions deductions: $3,149 (5% of AGI, reported on 24.0% of returns)
Here:
$3,149
State:
$4,035
Here:
5.5% of AGI
State:
4.5% of AGI
(% of AGI for various income ranges: 1.4% for AGIs $10k-25k, 2.2% for AGIs $25k-50k, 2.5% for AGIs $50k-75k, 3.0% for AGIs $75k-100k, 3.6% for AGIs over 100k)
Total tax: $3,467 (reported on 71.7% of returns)
27355:
$3,467
State:
$7,257
(% of AGI for various income ranges: 4.2% for AGIs below $10k, 3.9% for AGIs $10k-25k, 6.5% for AGIs $25k-50k, 7.6% for AGIs $50k-75k, 10.5% for AGIs $75k-100k, 15.0% for AGIs over 100k)
Earned income credit: $1,804 (reported on 21.7% of returns)
Here:
$1,804
State:
$1,851
Percentage of individuals using paid preparers for their 2004 taxes: 70.1%
Here:
70%
State:
62%
(% for various income ranges: 61.4% for AGIs below $10k, 74.6% for AGIs $10k-25k, 67.6% for AGIs $25k-50k, 77.4% for AGIs $50k-75k, 71.4% for AGIs $75k-100k, 73.1% for AGIs over 100k)
Household received Food Stamps/SNAP in the past 12 months: 106 Household did not receive Food Stamps/SNAP in the past 12 months: 926
Women who had a birth in the past 12 months: 37 (29 now married, 7 unmarried) Women who did not have a birth in the past 12 months: 470 (136 now married, 333 unmarried)
Housing units in zip code 27355 with a mortgage: 423 (26 second mortgage, 27 both second mortgage and home equity loan) Houses without a mortgage: 23
Median monthly owner costs for units with a mortgage: $1,370 Median monthly owner costs for units without a mortgage: $308
Residents with income below the poverty level in 2022:
This zip code:
9.8%
Whole state:
12.8%
Residents with income below 50% of the poverty level in 2022:
This zip code:
5.0%
Whole state:
6.8%
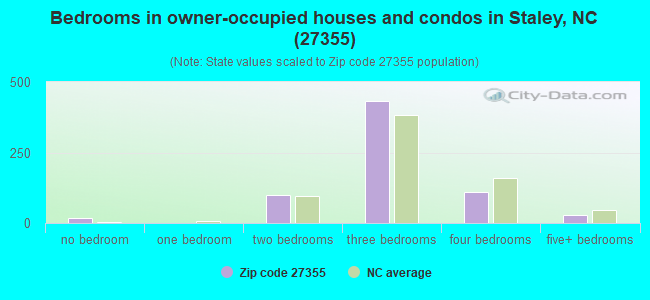
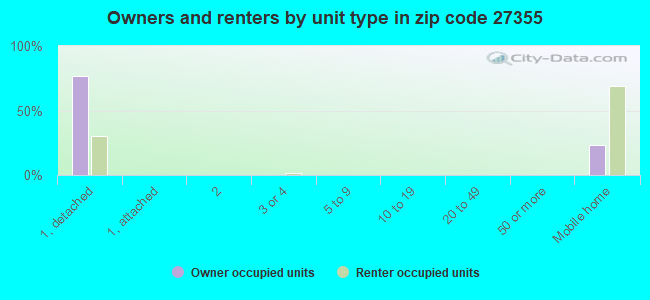
Median number of rooms in houses and condos:
Here:
6.1
State:
6.4
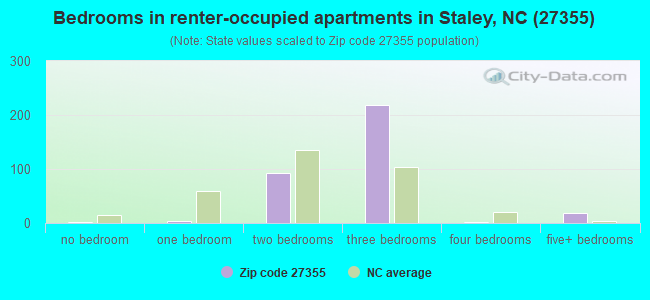
Median number of rooms in apartments:
Here:
5.2
State:
4.4
Notable locations in this zip code not listed on our city pages
Churches in zip code 27355 include: Bethany Church (A), White Cross Church (B), Mount Pleasant Church (C), Olivers Chapel (D), Zion Church (E), Pine View Church (F), Shady Grove Church (G). Display/hide their locations on the map
Cemeteries: Marley Cemetery (1), Old McMasters Cemetery (2), Old Shady Grove Cemetery (3), Olivers Chapel Cemetery (4). Display/hide their locations on the map
Size of family households: 240 2-persons, 231 3-persons, 104 4-persons, 71 5-persons, 2 6-persons, 33 7-or-more-persons
Size of nonfamily households: 308 1-person, 26 2-persons, 15 4-persons
265 married couples with children.
73 single-parent households (48 men, 25 women).
84.6% of residents of 27355 zip code speak English at home.
11.1% of residents speak Spanish at home (37% very well, 25% well, 33% not well, 5% not at all).
4.3% of residents speak other Indo-European language at home (100% very well).
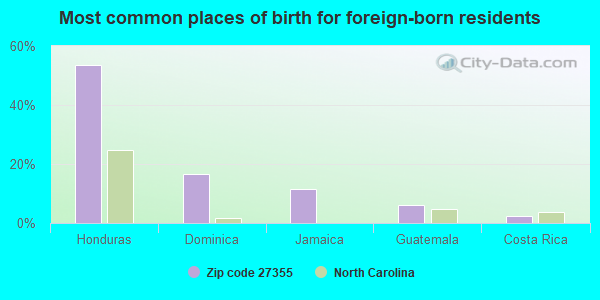
Foreign born population: 294 (10.6%) (42.7% of them are naturalized citizens)
This zip code:
10.6%
Whole state:
8.6%
53%Honduras
17%Dominica
12%Jamaica
6%Guatemala
2%Costa Rica
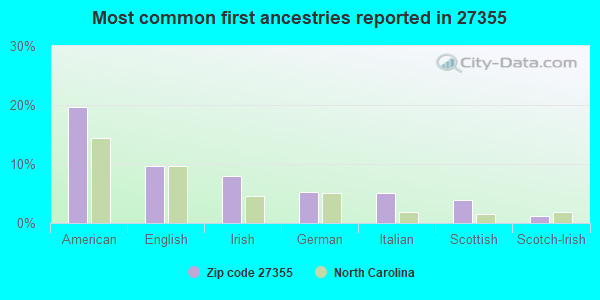
20%American
10%English
8%Irish
5%German
5%Italian
4%Scottish
1%Scotch-Irish
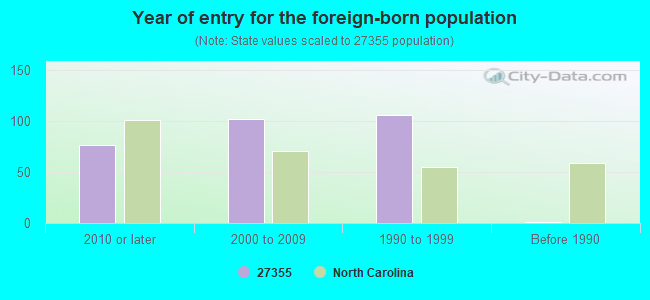
Year of entry for the foreign-born population
772010 or later
1022000 to 2009
1061990 to 1999
1Before 1990
Facilities with environmental interests located in this zip code:
APAC CAROLINA, INCORPORATED (340 COOPER ROAD in STALEY, NC)
AIR SYNTHETIC MINOR (AIRS/AFS) STATE MASTER (North Carolina facility info) - -66AN2CF000WEWDA489NU81P7E7, WASTEWATER FACILITY STATE MASTER (North Carolina facility info) - AIR PROGRAM Business SIC classification: ASPHALT PAVING MIXTURES AND BLOCKS Business NAICS classification: ASPHALT PAVING MIXTURE AND BLOCK MANUFACTURING. Alternative names: APAC CAROLINA INCORPORATED INACITVE
BROWER COMPANY INCORPORATED (NORTH WEEDEN STREET in STALEY, NC)
AIR MINOR (AIRS/AFS) STATE MASTER (North Carolina facility info) - AIR PROGRAM (Resource Conservation and Recovery Act (tracking hazardous waste)) Business SIC classification: WOOD HOUSEHOLD FURNITURE, EXCEPT UPHOLSTERED Organizations: DENNIS E. LILLY (CONTACT/OWNER)
DOWELL AGGREGATE INCORPORATED (2435 OLD HIGHWAY 421 NORTH in STALEY, NC)
AIR MINOR (AIRS/AFS) CRITERIA AND HAZARDOUS AIR POLLUTANT INVENTORY (Inventory of air pollution sources) Business SIC classification: NONMETALLIC MINERAL PRODUCTS Business NAICS classification: ALL OTHER MISCELLANEOUS NONMETALLIC MINERAL PRODUCT MANUFACTURING.
DOWELL AGGREGATE INC (US HWY 421 NORTH in STALEY, NC)
Conditionally Exempt Small Quantity Generators, less than 100 kg/month of hazardous waste (Resource Conservation and Recovery Act (tracking hazardous waste)) - notification
Housing units lacking complete plumbing facilities: 6.9% Housing units lacking complete kitchen facilities: 6.8%
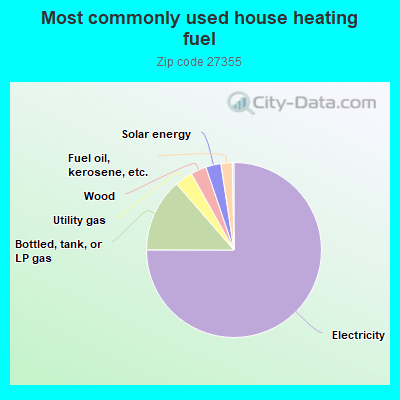
75.1%Electricity
13.6%Bottled, tank, or LP gas
3.3%Utility gas
2.9%Wood
2.8%Solar energy
2.1%Fuel oil, kerosene, etc.
Population in 1990: 1,747. Population change in the 1990s: +746 (+42.7%).
Place of birth for U.S.-born residents:
This state: 1,876
Northeast: 187
Midwest: 115
South: 263
West: 9
65% of the 27355 zip code residents lived in the same house 5 years ago. Out of people who lived in different houses, 34% lived in this county. Out of people who lived in different counties, 50% lived in North Carolina.
96% of the 27355 zip code residents lived in the same house 1 year ago. Out of people who lived in different houses, 66% moved from this county. Out of people who lived in different houses, 20% moved from different county within same state. Out of people who lived in different houses, 24% moved from different state.
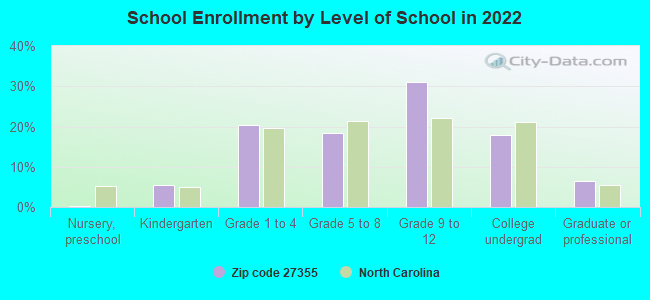
Private vs. public school enrollment:
Students in private schools in grades 1 to 8 (elementary and middle school): 6
Here:
3.0%
North Carolina:
13.8%
Students in private schools in grades 9 to 12 (high school): 33
Here:
19.4%
North Carolina:
11.9%
Students in private undergraduate colleges: 32
Here:
33.5%
North Carolina:
19.3%
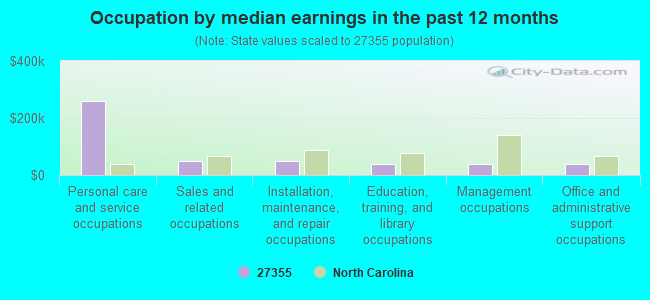
Occupation by median earnings in the past 12 months ($)
259,727Personal care and service occupations
48,467Sales and related occupations
48,199Installation, maintenance, and repair occupations
40,217Education, training, and library occupations
39,379Management occupations
38,780Office and administrative support occupations
Top industries in this zip code by the number of employees in 2005:
Accommodation and Food Services: Full-Service Restaurants (20-49 employees: 1 establishment)
Construction: Plumbing, Heating, and Air-Conditioning Contractors (10-19: 1, 1-4: 1)
Fatal accident statistics in 2013:
Fatal accident count: 2
Vehicles involved in fatal accidents: 4
Fatal accidents caused by drunken drivers: 0
Fatalities: 2
Persons involved in fatal accidents: 7
Pedestrians involved in fatal accidents: 0
Fatal accident statistics in 2010:
Fatal accident count: 1
Vehicles involved in fatal accidents: 1
Fatal accidents caused by drunken drivers: 0
Fatalities: 1
Persons involved in fatal accidents: 1
Pedestrians involved in fatal accidents: 1
Home Mortgage Disclosure Act Aggregated Statistics For Year 2009 (Based on 6 partial tracts)
A) FHA, FSA/RHS & VA Home Purchase Loans
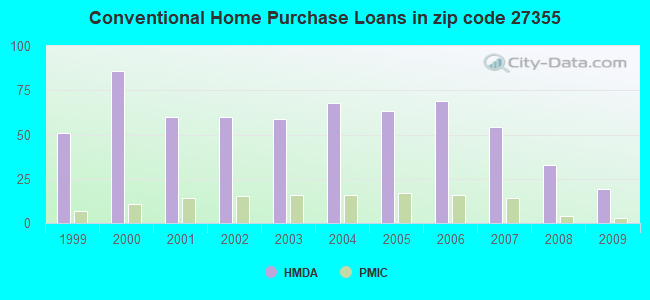
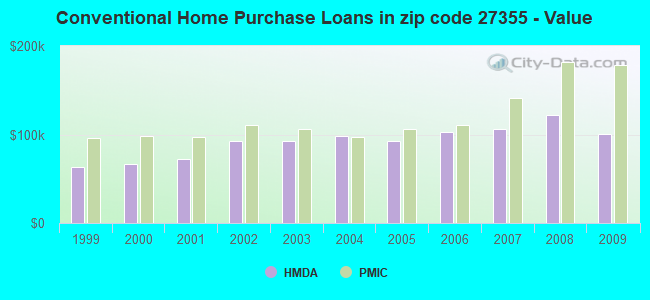
B) Conventional Home Purchase Loans
C) Refinancings
D) Home Improvement Loans
F) Non-occupant Loans on < 5 Family Dwellings (A B C & D)
G) Loans On Manufactured Home Dwelling (A B C & D)
Number
Average Value
Number
Average Value
Number
Average Value
Number
Average Value
Number
Average Value
Number
Average Value
LOANS ORIGINATED
19
$118,976
19
$100,926
91
$122,197
6
$46,175
6
$71,182
17
$78,244
APPLICATIONS APPROVED, NOT ACCEPTED
1
$83,030
1
$83,750
6
$123,727
0
$0
1
$58,480
0
$0
APPLICATIONS DENIED
5
$103,482
8
$68,198
52
$119,345
10
$48,367
2
$37,105
20
$74,493
APPLICATIONS WITHDRAWN
6
$107,577
2
$112,260
18
$116,438
1
$32,930
0
$0
5
$91,180
FILES CLOSED FOR INCOMPLETENESS
1
$133,570
0
$0
4
$157,748
0
$0
0
$0
0
$0
Aggregated Statistics For Year 2008 (Based on 6 partial tracts)
A) FHA, FSA/RHS & VA Home Purchase Loans
B) Conventional Home Purchase Loans
C) Refinancings
D) Home Improvement Loans
F) Non-occupant Loans on < 5 Family Dwellings (A B C & D)
G) Loans On Manufactured Home Dwelling (A B C & D)
Number
Average Value
Number
Average Value
Number
Average Value
Number
Average Value
Number
Average Value
Number
Average Value
LOANS ORIGINATED
26
$120,555
33
$122,005
77
$112,684
6
$47,312
17
$92,659
16
$74,500
APPLICATIONS APPROVED, NOT ACCEPTED
2
$85,245
2
$99,615
12
$91,260
0
$0
1
$7,820
4
$83,212
APPLICATIONS DENIED
5
$100,582
11
$81,029
80
$107,081
10
$34,925
1
$51,710
22
$71,068
APPLICATIONS WITHDRAWN
3
$124,040
3
$155,673
22
$124,485
2
$98,530
2
$93,080
2
$62,105
FILES CLOSED FOR INCOMPLETENESS
3
$80,623
1
$203,020
2
$130,150
0
$0
0
$0
1
$65,700
Aggregated Statistics For Year 2007 (Based on 6 partial tracts)
A) FHA, FSA/RHS & VA Home Purchase Loans
B) Conventional Home Purchase Loans
C) Refinancings
D) Home Improvement Loans
E) Loans on Dwellings For 5+ Families
F) Non-occupant Loans on < 5 Family Dwellings (A B C & D)
G) Loans On Manufactured Home Dwelling (A B C & D)
Number
Average Value
Number
Average Value
Number
Average Value
Number
Average Value
Number
Average Value
Number
Average Value
Number
Average Value
LOANS ORIGINATED
11
$109,805
54
$106,598
86
$112,096
15
$36,001
1
$285,910
17
$142,154
25
$74,212
APPLICATIONS APPROVED, NOT ACCEPTED
0
$0
6
$115,732
18
$78,728
2
$87,430
0
$0
1
$29,040
2
$55,645
APPLICATIONS DENIED
1
$93,140
16
$75,501
108
$100,523
26
$63,375
0
$0
5
$67,516
28
$64,382
APPLICATIONS WITHDRAWN
2
$119,255
8
$112,406
42
$110,876
4
$162,005
0
$0
1
$109,820
6
$76,353
FILES CLOSED FOR INCOMPLETENESS
0
$0
1
$20,240
6
$125,983
0
$0
0
$0
0
$0
0
$0
Aggregated Statistics For Year 2006 (Based on 6 partial tracts)
A) FHA, FSA/RHS & VA Home Purchase Loans
B) Conventional Home Purchase Loans
C) Refinancings
D) Home Improvement Loans
E) Loans on Dwellings For 5+ Families
F) Non-occupant Loans on < 5 Family Dwellings (A B C & D)
G) Loans On Manufactured Home Dwelling (A B C & D)
Number
Average Value
Number
Average Value
Number
Average Value
Number
Average Value
Number
Average Value
Number
Average Value
Number
Average Value
LOANS ORIGINATED
21
$110,584
69
$102,635
107
$92,844
14
$66,454
1
$135,970
22
$76,825
26
$83,126
APPLICATIONS APPROVED, NOT ACCEPTED
2
$121,035
9
$71,722
25
$84,282
4
$34,350
0
$0
1
$40,760
9
$52,923
APPLICATIONS DENIED
4
$118,165
34
$74,936
113
$98,348
18
$30,727
0
$0
4
$61,198
36
$60,848
APPLICATIONS WITHDRAWN
2
$99,010
9
$108,834
41
$130,841
6
$67,675
0
$0
0
$0
6
$81,640
FILES CLOSED FOR INCOMPLETENESS
1
$103,250
2
$115,535
14
$97,175
1
$50,540
0
$0
1
$128,440
0
$0
Aggregated Statistics For Year 2005 (Based on 6 partial tracts)
A) FHA, FSA/RHS & VA Home Purchase Loans
B) Conventional Home Purchase Loans
C) Refinancings
D) Home Improvement Loans
F) Non-occupant Loans on < 5 Family Dwellings (A B C & D)
G) Loans On Manufactured Home Dwelling (A B C & D)
Number
Average Value
Number
Average Value
Number
Average Value
Number
Average Value
Number
Average Value
Number
Average Value
LOANS ORIGINATED
15
$109,113
63
$92,847
117
$88,694
24
$41,359
20
$57,161
37
$66,866
APPLICATIONS APPROVED, NOT ACCEPTED
3
$90,243
11
$95,264
29
$107,968
7
$49,401
1
$24,820
7
$36,141
APPLICATIONS DENIED
4
$83,072
43
$102,661
131
$86,609
28
$51,180
5
$71,148
50
$69,096
APPLICATIONS WITHDRAWN
1
$97,770
10
$113,762
64
$100,735
8
$124,918
5
$69,442
11
$91,705
FILES CLOSED FOR INCOMPLETENESS
0
$0
3
$109,147
13
$101,928
1
$18,050
0
$0
1
$122,460
Aggregated Statistics For Year 2004 (Based on 6 partial tracts)
A) FHA, FSA/RHS & VA Home Purchase Loans
B) Conventional Home Purchase Loans
C) Refinancings
D) Home Improvement Loans
F) Non-occupant Loans on < 5 Family Dwellings (A B C & D)
G) Loans On Manufactured Home Dwelling (A B C & D)
Number
Average Value
Number
Average Value
Number
Average Value
Number
Average Value
Number
Average Value
Number
Average Value
LOANS ORIGINATED
16
$105,502
68
$98,041
112
$103,590
14
$42,923
23
$72,572
25
$62,723
APPLICATIONS APPROVED, NOT ACCEPTED
1
$97,250
9
$87,390
25
$90,489
2
$22,090
1
$37,320
6
$53,747
APPLICATIONS DENIED
5
$88,450
28
$84,593
126
$97,678
15
$53,259
8
$73,595
40
$69,779
APPLICATIONS WITHDRAWN
3
$107,147
8
$92,461
61
$94,587
2
$97,275
3
$68,943
10
$83,381
FILES CLOSED FOR INCOMPLETENESS
0
$0
2
$128,535
11
$106,385
1
$22,820
0
$0
2
$84,525
Aggregated Statistics For Year 2003 (Based on 6 partial tracts)
A) FHA, FSA/RHS & VA Home Purchase Loans
B) Conventional Home Purchase Loans
C) Refinancings
D) Home Improvement Loans
F) Non-occupant Loans on < 5 Family Dwellings (A B C & D)
Number
Average Value
Number
Average Value
Number
Average Value
Number
Average Value
Number
Average Value
LOANS ORIGINATED
17
$95,579
59
$92,513
223
$94,748
11
$22,408
24
$61,670
APPLICATIONS APPROVED, NOT ACCEPTED
0
$0
10
$70,409
35
$83,828
3
$11,563
1
$39,060
APPLICATIONS DENIED
4
$91,475
21
$76,625
132
$82,039
14
$19,206
4
$130,778
APPLICATIONS WITHDRAWN
2
$95,335
9
$100,372
60
$96,047
2
$23,370
1
$73,910
FILES CLOSED FOR INCOMPLETENESS
0
$0
0
$0
8
$82,652
1
$25,270
0
$0
Aggregated Statistics For Year 2002 (Based on 6 partial tracts)
A) FHA, FSA/RHS & VA Home Purchase Loans
B) Conventional Home Purchase Loans
C) Refinancings
D) Home Improvement Loans
E) Loans on Dwellings For 5+ Families
F) Non-occupant Loans on < 5 Family Dwellings (A B C & D)
Number
Average Value
Number
Average Value
Number
Average Value
Number
Average Value
Number
Average Value
Number
Average Value
LOANS ORIGINATED
10
$100,922
60
$92,921
164
$95,824
8
$14,516
1
$394,930
16
$60,229
APPLICATIONS APPROVED, NOT ACCEPTED
2
$76,320
13
$53,246
30
$78,265
5
$17,618
0
$0
3
$54,630
APPLICATIONS DENIED
3
$100,147
39
$58,038
97
$80,956
10
$13,940
0
$0
1
$60,860
APPLICATIONS WITHDRAWN
1
$71,460
5
$89,462
29
$88,329
2
$14,705
0
$0
1
$46,930
FILES CLOSED FOR INCOMPLETENESS
0
$0
4
$95,950
14
$89,556
0
$0
0
$0
1
$38,990
Aggregated Statistics For Year 2001 (Based on 6 partial tracts)
A) FHA, FSA/RHS & VA Home Purchase Loans
B) Conventional Home Purchase Loans
C) Refinancings
D) Home Improvement Loans
F) Non-occupant Loans on < 5 Family Dwellings (A B C & D)
Number
Average Value
Number
Average Value
Number
Average Value
Number
Average Value
Number
Average Value
LOANS ORIGINATED
10
$76,736
60
$72,195
153
$91,929
16
$19,934
16
$44,539
APPLICATIONS APPROVED, NOT ACCEPTED
1
$40,760
29
$54,128
32
$81,844
1
$10,470
1
$72,440
APPLICATIONS DENIED
3
$74,210
69
$52,813
98
$75,393
13
$13,720
3
$51,687
APPLICATIONS WITHDRAWN
0
$0
7
$78,546
39
$71,789
4
$25,598
1
$67,150
FILES CLOSED FOR INCOMPLETENESS
1
$46,910
1
$144,350
6
$110,527
1
$20,320
0
$0
Aggregated Statistics For Year 2000 (Based on 6 partial tracts)
A) FHA, FSA/RHS & VA Home Purchase Loans
B) Conventional Home Purchase Loans
C) Refinancings
D) Home Improvement Loans
F) Non-occupant Loans on < 5 Family Dwellings (A B C & D)
Number
Average Value
Number
Average Value
Number
Average Value
Number
Average Value
Number
Average Value
LOANS ORIGINATED
7
$93,430
86
$66,181
66
$71,358
14
$11,771
12
$46,167
APPLICATIONS APPROVED, NOT ACCEPTED
3
$44,373
37
$40,504
27
$68,614
4
$23,415
2
$31,950
APPLICATIONS DENIED
9
$48,472
123
$49,769
81
$63,379
9
$28,707
5
$61,170
APPLICATIONS WITHDRAWN
1
$124,620
11
$80,542
37
$71,177
2
$42,625
1
$72,920
FILES CLOSED FOR INCOMPLETENESS
0
$0
2
$129,550
6
$71,170
0
$0
0
$0
Aggregated Statistics For Year 1999 (Based on 3 partial tracts)
A) FHA, FSA/RHS & VA Home Purchase Loans
B) Conventional Home Purchase Loans
C) Refinancings
D) Home Improvement Loans
F) Non-occupant Loans on < 5 Family Dwellings (A B C & D)
2002 - 2018 National Fire Incident Reporting System (NFIRS) incidents
According to the data from the years 2002 - 2018 the average number of fires per year is 7. The highest number of reported fire incidents - 17 took place in 2007, and the least - 0 in 2003. The data has a rising trend.
When looking into fire subcategories, the most incidents belonged to: Structure Fires (56.0%), and Outside Fires (27.6%).
Fire incident types reported to NFIRS in Zip Code 27355


+$2,812
-$3,231
(% of AGI for various income ranges: 1.6% for AGIs below $10k, -0.7% for AGIs $10k-25k, 0.6% for AGIs $25k-50k, 1.4% for AGIs $50k-75k) Nearest zip codes: 27298, 27316, 27248, 27344, 27233, 27283.
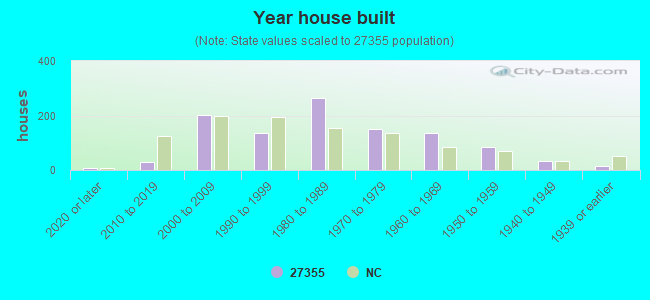


 According to the data from the years 2002 - 2018 the average number of fires per year is 7. The highest number of reported fire incidents - 17 took place in 2007, and the least - 0 in 2003. The data has a rising trend.
 When looking into fire subcategories, the most incidents belonged to: Structure Fires (56.0%), and Outside Fires (27.6%).