Estimated zip code population in 2022: 5,813 Zip code population in 2010: 5,008 Zip code population in 2000: 5,191
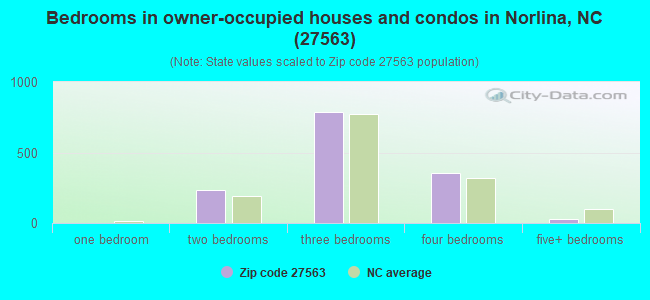
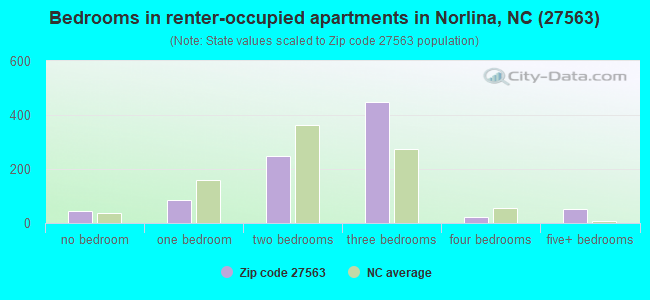
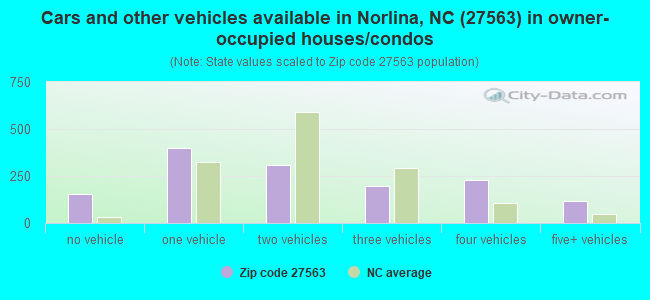
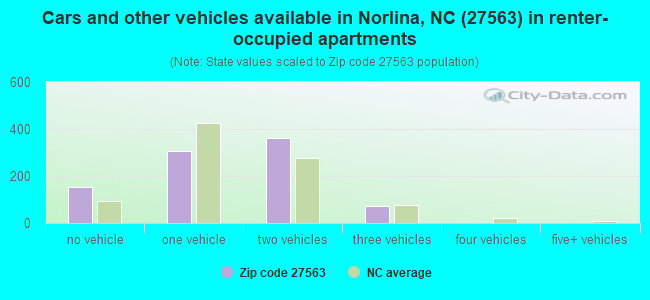
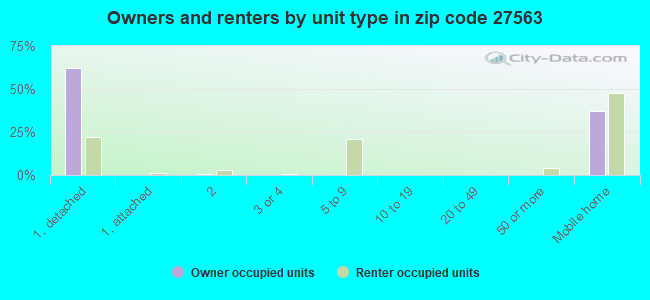
Houses and condos: 2,757 Renter-occupied apartments: 902
% of renters here:
39%
State:
33%
March 2022 cost of living index in zip code 27563: 78.9 (low, U.S. average is 100)
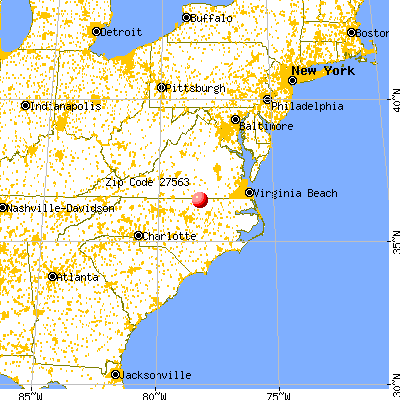
Land area: 70.8 sq. mi. Water area: 0.2 sq. mi.
Population density: 82 people per square mile
(very low).
OSM Map
General Map
Google Map
MSN Map
OSM Map
General Map
Google Map
MSN Map
OSM Map
General Map
Google Map
MSN Map
OSM Map
General Map
Google Map
MSN Map
Please wait while loading the map...
Real estate property taxes paid for housing units in 2022:
This zip code:
0.8% ($865)
North Carolina:
0.6% ($1,769)
Median real estate property taxes paid for housing units with mortgages in 2022: $881 (0.7%) Median real estate property taxes paid for housing units with no mortgage in 2022: $862 (0.9%)
Business Search- 14 Million verified businesses
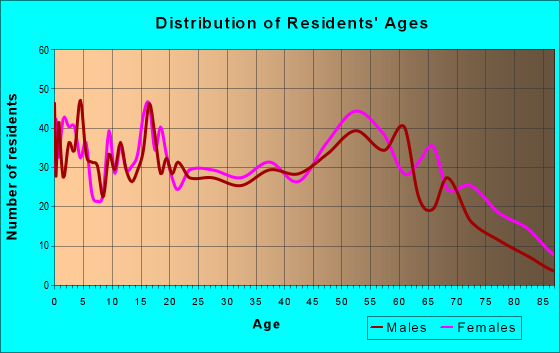
Males: 3,019
(52.0%)
Females: 2,792
(48.0%)
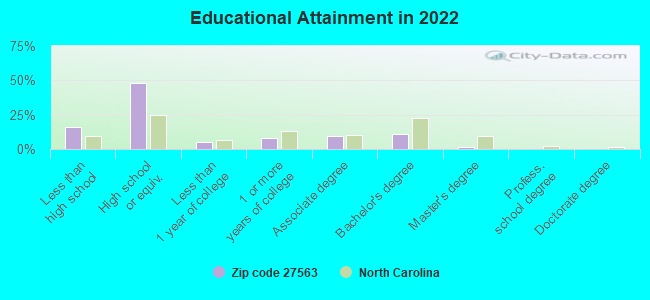
For population 25 years and over in 27563:
High school or higher: 82.7%
Bachelor's degree or higher: 13.1%
Graduate or professional degree: 2.2%
Unemployed: 5.6%
Mean travel time to work (commute): 29.7 minutes
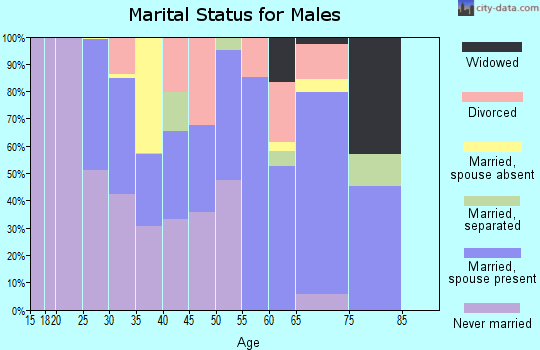
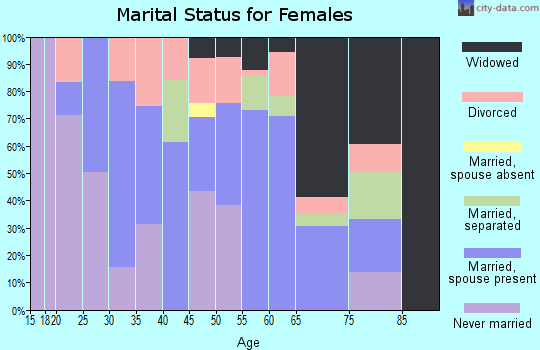
For population 15 years and over in 27563:
Never married: 41.2%
Now married: 34.3%
Separated: 5.5%
Widowed: 7.7%
Divorced: 11.3%
Zip code 27563 compared to state average:
Median household income below state average.
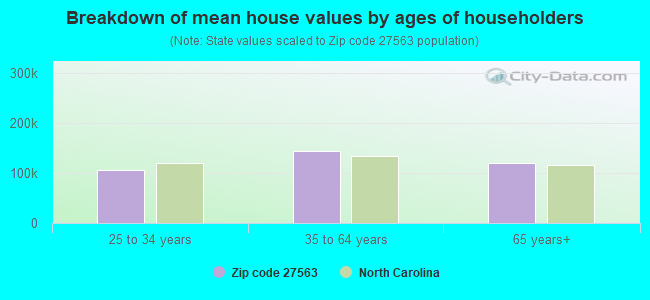
Median house value significantly below state average.
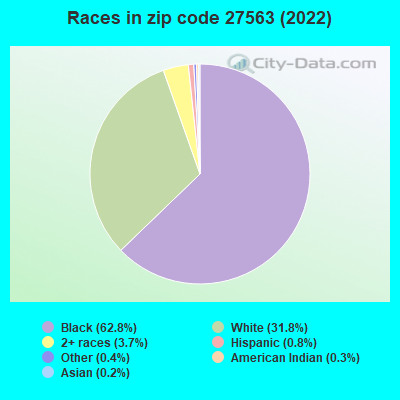
Black race population percentage significantly above state average.
Hispanic race population percentage significantly below state average.
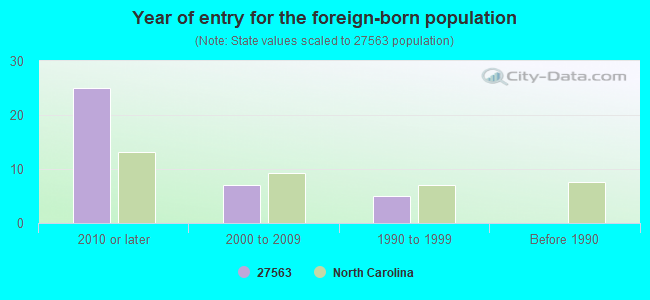
Foreign-born population percentage significantly below state average.
Length of stay since moving in significantly above state average.
Percentage of population with a bachelor's degree or higher significantly below state average.
Averages for the 2020 tax year for zip code 27563, filed in 2021:
Average Adjusted Gross Income (AGI) in 2020: $36,522 (Individual Income Tax Returns)
Here:
$36,522
State:
$70,020
Salary/wage: $33,558 (reported on 85.5% of returns)
Here:
$33,558
State:
$58,387
(% of AGI for various income ranges: 1308.6% for AGIs below $25k, 3827.3% for AGIs $25k-50k, 6858.3% for AGIs $50k-75k, 10424.3% for AGIs $75k-100k, 15606.0% for AGIs $100k-200k)
Taxable interest for individuals: $553 (reported on 19.0% of returns)
This zip code:
$553
North Carolina:
$1,479
(% of AGI for various income ranges: 6.2% for AGIs below $25k, 5.5% for AGIs $25k-50k, 21.1% for AGIs $50k-75k, 27.1% for AGIs $75k-100k, 164.0% for AGIs $100k-200k)
Ordinary dividends: $2,564 (reported on 5.5% of returns)
Here:
$2,564
State:
$7,888
(% of AGI for various income ranges: 5.5% for AGIs below $25k, 15.9% for AGIs $25k-50k, 50.0% for AGIs $50k-75k, 134.0% for AGIs $100k-200k)
Net capital gain/loss in AGI: +$3,522 (reported on 4.5% of returns)
Here:
+$3,522
State:
+$23,652
(% of AGI for various income ranges: 1.5% for AGIs below $25k, 24.8% for AGIs $25k-50k, 240.0% for AGIs $75k-100k)
Profit/loss from business: +$1,517 (reported on 14.5% of returns)
Here:
+$1,517
State:
+$11,710
(% of AGI for various income ranges: 42.5% for AGIs below $25k, 292.9% for AGIs $75k-100k)
Taxable individual retirement arrangement distribution: $8,708 (reported on 6.0% of returns)
27563:
$8,708
North Carolina:
$20,247
(% of AGI for various income ranges: 28.0% for AGIs below $25k, 95.7% for AGIs $25k-50k, 467.1% for AGIs $75k-100k)
Total itemized deductions: $25,186 (reported on 3.5% of returns)
Here:
$25,186
State:
$34,549
(% of AGI for various income ranges: 108.7% for AGIs $25k-50k, 641.1% for AGIs $50k-75k)
Charity contributions: $8,660 (reported on 2.5% of returns)
Here:
$8,660
State:
$13,360
(% of AGI for various income ranges: 18.0% for AGIs below $25k, 175.6% for AGIs $50k-75k)
Taxes paid: $3,657 (reported on 3.5% of returns)
27563:
$3,657
State:
$7,586
(% of AGI for various income ranges: 13.0% for AGIs $25k-50k, 101.7% for AGIs $50k-75k)
Earned income credit: $2,433 (reported on 30.5% of returns)
Here:
$2,433
State:
$2,337
(% of AGI for various income ranges: 148.9% for AGIs below $25k, 92.1% for AGIs $25k-50k)
Percentage of individuals using paid preparers for their 2020 taxes: 87.0%
Here:
87%
State:
93%
(% for various income ranges: 85.9% for AGIs below $25k, 87.1% for AGIs $25k-50k, 88.0% for AGIs $50k-75k, 90.9% for AGIs $75k-100k, 88.9% for AGIs $100k-200k)
Averages for the 2012 tax year for zip code 27563, filed in 2013:
Average Adjusted Gross Income (AGI) in 2012: $30,157 (Individual Income Tax Returns)
Here:
$30,157
State:
$54,937
Salary/wage: $26,413 (reported on 86.7% of returns)
Here:
$26,413
State:
$46,336
(% of AGI for various income ranges: 81.9% for AGIs below $25k, 85.6% for AGIs $25k-50k, 73.2% for AGIs $50k-75k, 70.1% for AGIs $75k-100k, 41.2% for AGIs $100k-200k)
Taxable interest for individuals: $843 (reported on 20.6% of returns)
This zip code:
$843
North Carolina:
$1,298
(% of AGI for various income ranges: 0.5% for AGIs below $25k, 0.4% for AGIs $25k-50k, 0.6% for AGIs $50k-75k, 0.5% for AGIs $75k-100k, 1.4% for AGIs $100k-200k)
Ordinary dividends: $3,415 (reported on 7.2% of returns)
Here:
$3,415
State:
$6,213
(% of AGI for various income ranges: 0.4% for AGIs below $25k, 0.4% for AGIs $25k-50k, 1.0% for AGIs $50k-75k, 3.1% for AGIs $75k-100k)
Net capital gain/loss in AGI: +$6,225 (reported on 6.7% of returns)
Here:
+$6,225
State:
+$12,740
(% of AGI for various income ranges: 0.8% for AGIs below $25k, 0.4% for AGIs $25k-50k, 1.3% for AGIs $50k-75k, 6.5% for AGIs $75k-100k)
Profit/loss from business: +$4,633 (reported on 13.3% of returns)
Here:
+$4,633
State:
+$10,311
(% of AGI for various income ranges: 4.1% for AGIs below $25k, 0.7% for AGIs $25k-50k, 3.6% for AGIs $50k-75k, 1.2% for AGIs $75k-100k)
Taxable individual retirement arrangement distribution: $7,550 (reported on 6.7% of returns)
27563:
$7,550
North Carolina:
$15,575
(% of AGI for various income ranges: 1.7% for AGIs below $25k, 1.0% for AGIs $25k-50k, 2.4% for AGIs $50k-75k, 3.7% for AGIs $75k-100k)
Total itemized deductions: $17,879 (35% of AGI, reported on 21.7% of returns)
Here:
$17,879
State:
$23,438
Here:
35.4% of AGI
State:
21.5% of AGI
(% of AGI for various income ranges: 7.6% for AGIs below $25k, 15.2% for AGIs $25k-50k, 13.4% for AGIs $50k-75k, 15.3% for AGIs $75k-100k, 12.6% for AGIs $100k-200k)
Charity contributions: $4,303 (reported on 17.2% of returns)
Here:
$4,303
State:
$4,687
(% of AGI for various income ranges: 0.9% for AGIs below $25k, 2.5% for AGIs $25k-50k, 2.7% for AGIs $50k-75k, 3.2% for AGIs $75k-100k, 4.3% for AGIs $100k-200k)
Taxes paid: $3,733 (reported on 21.7% of returns)
27563:
$3,733
State:
$8,823
(% of AGI for various income ranges: 0.8% for AGIs below $25k, 2.4% for AGIs $25k-50k, 3.2% for AGIs $50k-75k, 4.5% for AGIs $75k-100k, 4.6% for AGIs $100k-200k)
Earned income credit: $2,512 (reported on 38.3% of returns)
Here:
$2,512
State:
$2,376
(% of AGI for various income ranges: 10.9% for AGIs below $25k, 2.0% for AGIs $25k-50k)
Percentage of individuals using paid preparers for their 2012 taxes: 38.9%
Here:
39%
State:
53%
(% for various income ranges: 37.9% for AGIs below $25k, 32.7% for AGIs $25k-50k, 50.0% for AGIs $50k-75k, 50.0% for AGIs $75k-100k, 75.0% for AGIs $100k-200k)
Averages for the 2004 tax year for zip code 27563, filed in 2005:
Average Adjusted Gross Income (AGI) in 2004: $26,325 (Individual Income Tax Returns)
Here:
$26,325
State:
$45,376
Salary/wage: $23,684 (reported on 86.6% of returns)
Here:
$23,684
State:
$39,442
(% of AGI for various income ranges: 119.0% for AGIs below $10k, 83.4% for AGIs $10k-25k, 85.8% for AGIs $25k-50k, 76.3% for AGIs $50k-75k, 66.4% for AGIs $75k-100k, 26.3% for AGIs over 100k)
Taxable interest for individuals: $1,179 (reported on 26.2% of returns)
This zip code:
$1,179
North Carolina:
$1,515
(% of AGI for various income ranges: 2.6% for AGIs below $10k, 1.1% for AGIs $10k-25k, 0.9% for AGIs $25k-50k, 0.7% for AGIs $50k-75k, 2.4% for AGIs $75k-100k, 1.9% for AGIs over 100k)
Taxable dividends: $2,349 (reported on 9.8% of returns)
Here:
$2,349
State:
$4,016
(% of AGI for various income ranges: 1.9% for AGIs below $10k, 0.5% for AGIs $10k-25k, 0.7% for AGIs $25k-50k, 0.5% for AGIs $50k-75k, 0.8% for AGIs $75k-100k, 3.2% for AGIs over 100k)
Net capital gain/loss: +$6,309 (reported on 6.4% of returns)
Here:
+$6,309
State:
+$11,152
(% of AGI for various income ranges: -1.4% for AGIs below $10k, 0.5% for AGIs $10k-25k, 1.1% for AGIs $25k-50k, 0.0% for AGIs $50k-75k, 11.1% for AGIs $75k-100k)
Profit/loss from business: +$4,222 (reported on 11.8% of returns)
Here:
+$4,222
State:
+$9,490
(% of AGI for various income ranges: 3.5% for AGIs below $10k, 3.0% for AGIs $10k-25k, 0.6% for AGIs $25k-50k, 2.0% for AGIs $50k-75k, 4.3% for AGIs $75k-100k)
IRA payment deduction: $3,312 (reported on 0.9% of returns)
27563:
$3,312
North Carolina:
$2,967
Total itemized deductions: $16,133 (34% of AGI, reported on 21.8% of returns)
Here:
$16,133
State:
$19,464
Here:
34.5% of AGI
State:
22.7% of AGI
(% of AGI for various income ranges: 8.8% for AGIs below $10k, 6.7% for AGIs $10k-25k, 17.6% for AGIs $25k-50k, 14.9% for AGIs $50k-75k, 15.6% for AGIs $75k-100k, 12.4% for AGIs over 100k)
Charity contributions deductions: $3,824 (8% of AGI, reported on 19.7% of returns)
Here:
$3,824
State:
$4,035
Here:
8.5% of AGI
State:
4.5% of AGI
(% of AGI for various income ranges: 1.3% for AGIs $10k-25k, 3.5% for AGIs $25k-50k, 3.1% for AGIs $50k-75k, 5.5% for AGIs $75k-100k, 2.7% for AGIs over 100k)
Total tax: $2,707 (reported on 58.2% of returns)
27563:
$2,707
State:
$7,257
(% of AGI for various income ranges: 2.4% for AGIs below $10k, 3.1% for AGIs $10k-25k, 5.0% for AGIs $25k-50k, 8.1% for AGIs $50k-75k, 10.0% for AGIs $75k-100k, 11.2% for AGIs over 100k)
Earned income credit: $2,044 (reported on 38.4% of returns)
Here:
$2,044
State:
$1,851
Percentage of individuals using paid preparers for their 2004 taxes: 56.9%
Here:
57%
State:
62%
(% for various income ranges: 52.4% for AGIs below $10k, 60.7% for AGIs $10k-25k, 53.9% for AGIs $25k-50k, 56.4% for AGIs $50k-75k, 60.8% for AGIs $75k-100k, 68.2% for AGIs over 100k)
Household received Food Stamps/SNAP in the past 12 months: 721 Household did not receive Food Stamps/SNAP in the past 12 months: 1,629
Women who had a birth in the past 12 months: 14 (14 now married, 0 unmarried) Women who did not have a birth in the past 12 months: 1,217 (275 now married, 936 unmarried)
Housing units in zip code 27563 with a mortgage: 433 (20 second mortgage, 21 both second mortgage and home equity loan) Houses without a mortgage: 28
Median monthly owner costs for units with a mortgage: $990 Median monthly owner costs for units without a mortgage: $441
Residents with income below the poverty level in 2022:
This zip code:
22.3%
Whole state:
12.8%
Residents with income below 50% of the poverty level in 2022:
This zip code:
16.1%
Whole state:
6.8%
Median number of rooms in houses and condos:
Here:
5.8
State:
6.4
Median number of rooms in apartments:
Here:
4.7
State:
4.4
Notable locations in this zip code not listed on our city pages
Churches in zip code 27563 include: Jones Chapel (A), Kerne Chapel (B), Union Chapel (C), Browns Church (D), Whites Grove Church (E), Chapel Hill Church (F), Zion Church (G), Pleasant Grove Church (H), Saint Pauls Church (I). Display/hide their locations on the map
Streams, rivers, and creeks: Buzzard Branch (A), Blue Mud Creek (B), Terrapin Creek (C), Rocky Creek (D), Newmans Creek (E), Matthews Creek (F), Malones Creek (G), Lees Branch (H). Display/hide their locations on the map
In group quarters: 639 (-1 institutionalized population)
Size of family households: 748 2-persons, 439 3-persons, 150 4-persons, 90 5-persons, 16 6-persons, 14 7-or-more-persons
Size of nonfamily households: 824 1-person, 28 2-persons
333 married couples with children.
504 single-parent households (92 men, 412 women).
96.8% of residents of 27563 zip code speak English at home.
1.1% of residents speak Spanish at home (10% very well, 15% well, 76% not well).
1.7% of residents speak other Indo-European language at home (100% very well).
0.1% of residents speak other language at home (100% very well).
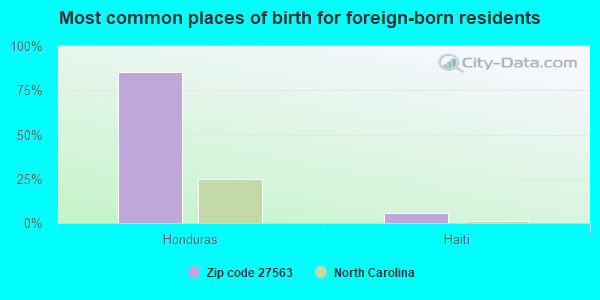
Foreign born population: 33 (0.6%) (0.0% of them are naturalized citizens)
:
0.6%
Whole state:
8.6%
85%Honduras
6%Haiti
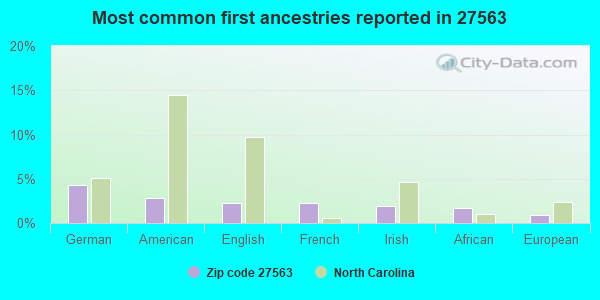
4%German
3%American
2%English
2%French
2%Irish
2%African
1%European
Year of entry for the foreign-born population
252010 or later
72000 to 2009
51990 to 1999
0Before 1990
Facilities with environmental interests located in this zip code:
BAKERY FEEDS INCORPORATED (HIGHWAY 1 AND 158 in NORLINA, NC)
AIR MAJOR (AIRS/AFS) STATE MASTER (North Carolina facility info) - AIR PROGRAM Business SIC classification: PREPARED FEEDS AND FEED INGREDIENTS FOR ANIMALS AND FOWLS, EXCEPT DOGS AND CATS
Housing units lacking complete plumbing facilities: 5.4% Housing units lacking complete kitchen facilities: 3.7%
73.5%Electricity
12.6%Bottled, tank, or LP gas
5.9%Utility gas
5.3%Fuel oil, kerosene, etc.
2.8%Wood
Population in 1990: 3,605. Population change in the 1990s: +1,586 (+44.0%).
Place of birth for U.S.-born residents:
This state: 4,055
Northeast: 568
Midwest: 41
South: 1,015
West: 38
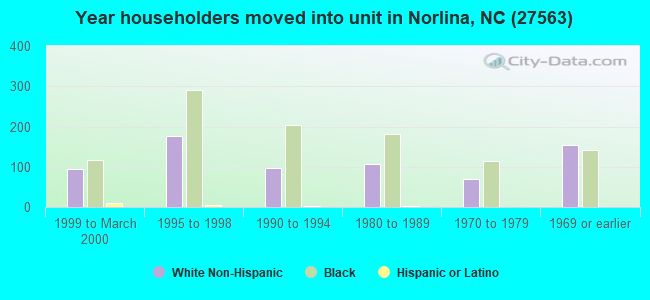
58% of the 27563 zip code residents lived in the same house 5 years ago. Out of people who lived in different houses, 43% lived in this county. Out of people who lived in different counties, 50% lived in North Carolina.
85% of the 27563 zip code residents lived in the same house 1 year ago. Out of people who lived in different houses, 13% moved from this county. Out of people who lived in different houses, 61% moved from different county within same state. Out of people who lived in different houses, 29% moved from different state.
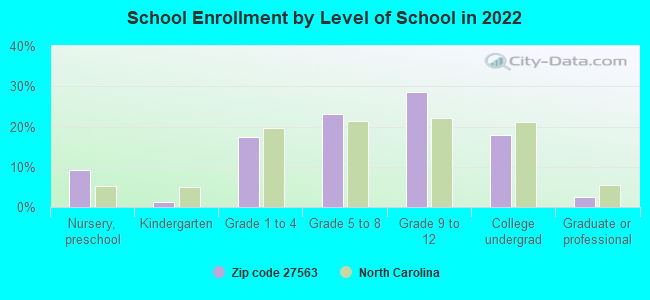
Private vs. public school enrollment:
Students in private schools in grades 1 to 8 (elementary and middle school): 114
Here:
23.7%
North Carolina:
13.8%
Students in private schools in grades 9 to 12 (high school): 12
Here:
3.7%
North Carolina:
11.9%
Students in private undergraduate colleges: 12
Here:
6.0%
North Carolina:
19.3%
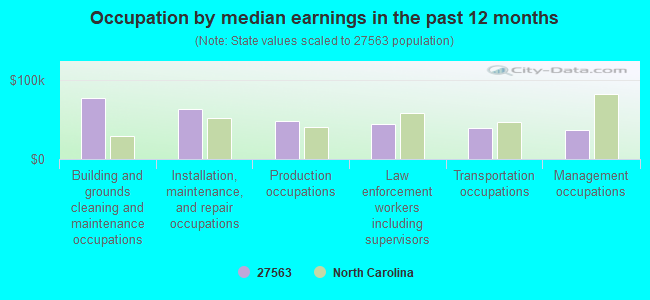
Occupation by median earnings in the past 12 months ($)
77,393Building and grounds cleaning and maintenance occupations
63,672Installation, maintenance, and repair occupations
48,708Production occupations
45,056Law enforcement workers including supervisors
39,400Transportation occupations
37,297Management occupations
Top industries in this zip code by the number of employees in 2005:
Educational Services: Elementary and Secondary Schools (20-49: 1)
Construction: Water and Sewer Line and Related Structures Construction (10-19: 1, 1-4: 1)
Construction: Masonry Contractors (10-19: 1)
Construction: Power and Communication Line and Related Structures Construction (10-19: 1)
People in group quarters in 2010:
12 people in residential treatment centers for adults
12 people in workers' group living quarters and job corps centers
People in group quarters in 2000:
592 people in state prisons
39 people in other noninstitutional group quarters
Fatal accident statistics in 2012:
Fatal accident count: 3
Vehicles involved in fatal accidents: 3
Fatal accidents caused by drunken drivers: 0
Fatalities: 3
Persons involved in fatal accidents: 3
Pedestrians involved in fatal accidents: 2
Fatal accident statistics in 2010:
Fatal accident count: 2
Vehicles involved in fatal accidents: 3
Fatal accidents caused by drunken drivers: 1
Fatalities: 2
Persons involved in fatal accidents: 3
Pedestrians involved in fatal accidents: 0
2004 - 2018 National Fire Incident Reporting System (NFIRS) incidents
According to the data from the years 2004 - 2018 the average number of fire incidents per year is 22. The highest number of reported fire incidents - 51 took place in 2010, and the least - 0 in 2005. The data has a rising trend.
When looking into fire subcategories, the most incidents belonged to: Structure Fires (51.6%), and Outside Fires (26.9%).
Fire incident types reported to NFIRS in Zip Code 27563


 Nearest zip codes: 27556, 27553, 27589, 27537, 27551, 27536.


 According to the data from the years 2004 - 2018 the average number of fire incidents per year is 22. The highest number of reported fire incidents - 51 took place in 2010, and the least - 0 in 2005. The data has a rising trend.
 When looking into fire subcategories, the most incidents belonged to: Structure Fires (51.6%), and Outside Fires (26.9%).