Estimated zip code population in 2022: 6,060
Zip code population in 2010: 5,903
Zip code population in 2000: 4,377
Houses and condos: 2,677
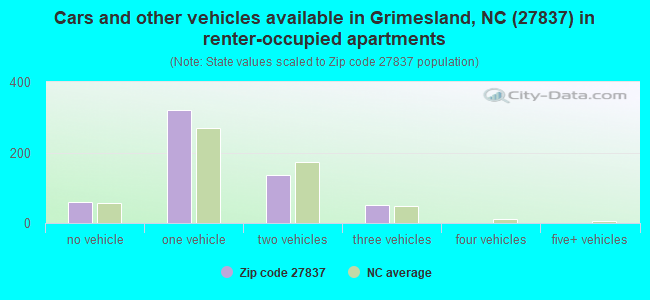
Renter-occupied apartments: 568
% of renters here:
23%State:
33%
March 2022 cost of living index in zip code 27837: 78.7
(low, U.S. average is 100)
Land area: 59.6
sq. mi.
Water area: 0.4
sq. mi.
Population density: 102 people per square mile (very low).
OSM Map
General Map
Google Map
MSN Map
OSM Map
General Map
Google Map
MSN Map
OSM Map
General Map
Google Map
MSN Map
OSM Map
General Map
Google Map
MSN Map
Please wait while loading the map...
Real estate property taxes paid for housing units in 2022:
This zip code:
0.7% ($1,167)North Carolina:
0.6% ($1,769)
Median real estate property taxes paid for housing units with mortgages in 2022: $1,464 (0.7%)
Median real estate property taxes paid for housing units with no mortgage in 2022: $708 (0.7%)
Profiles of local businesses
Business Search - 14 Million verified businesses
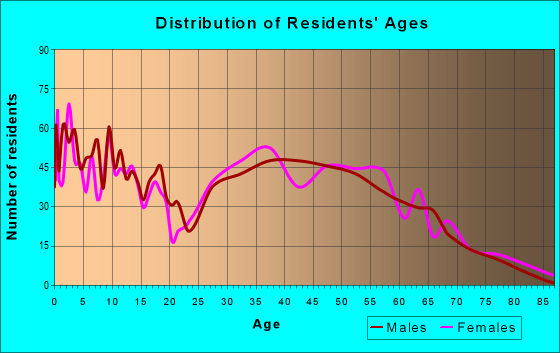
Males: 2,936 Females: 3,124
For population 25 years and over in 27837:
High school or higher: 87.1%Bachelor's degree or higher: 28.2%Graduate or professional degree: 8.0%Unemployed: 2.9%Mean travel time to work (commute): 29.7 minutes
For population 15 years and over in 27837:
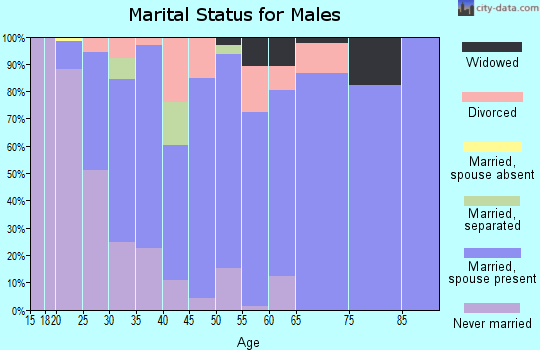
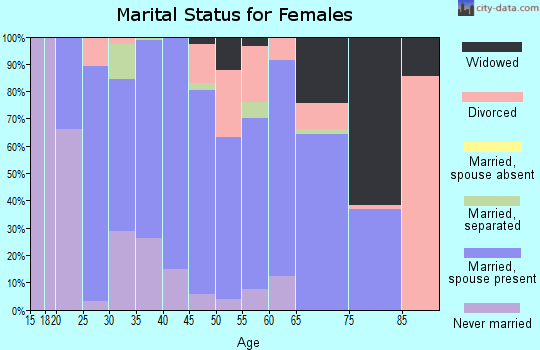
Never married: 21.9%Now married: 65.8%Separated: 2.7%Widowed: 2.0%Divorced: 7.5%
Zip code 27837 compared to state average:
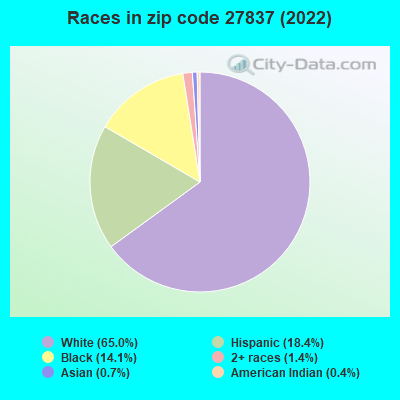
Median house value below state average. Hispanic race population percentage above state average. Length of stay since moving in significantly above state average. House age below state average. 3,940 65.0% White 1,117 18.4% Hispanic or Latino 853 14.1% Black 82 1.4% Two or more races 42 0.7% Asian 23 0.4% American Indian
Data:
Median household income ($)
Median household income (% change since 2000)
Household income diversity
Ratio of average income to average house value (%)
Ratio of average income to average rent
Median household income ($) - White
Median household income ($) - Black or African American
Median household income ($) - Asian
Median household income ($) - Hispanic or Latino
Median household income ($) - American Indian and Alaska Native
Median household income ($) - Multirace
Median household income ($) - Other Race
Median household income for houses/condos with a mortgage ($)
Median household income for apartments without a mortgage ($)
Races - White alone (%)
Races - White alone (% change since 2000)
Races - Black alone (%)
Races - Black alone (% change since 2000)
Races - American Indian alone (%)
Races - American Indian alone (% change since 2000)
Races - Asian alone (%)
Races - Asian alone (% change since 2000)
Races - Hispanic (%)
Races - Hispanic (% change since 2000)
Races - Native Hawaiian and Other Pacific Islander alone (%)
Races - Native Hawaiian and Other Pacific Islander alone (% change since 2000)
Races - Two or more races (%)
Races - Two or more races (% change since 2000)
Races - Other race alone (%)
Races - Other race alone (% change since 2000)
Racial diversity
Unemployment (%)
Unemployment (% change since 2000)
Unemployment (%) - White
Unemployment (%) - Black or African American
Unemployment (%) - Asian
Unemployment (%) - Hispanic or Latino
Unemployment (%) - American Indian and Alaska Native
Unemployment (%) - Multirace
Unemployment (%) - Other Race
Population density (people per square mile)
Population - Males (%)
Population - Females (%)
Population - Males (%) - White
Population - Males (%) - Black or African American
Population - Males (%) - Asian
Population - Males (%) - Hispanic or Latino
Population - Males (%) - American Indian and Alaska Native
Population - Males (%) - Multirace
Population - Males (%) - Other Race
Population - Females (%) - White
Population - Females (%) - Black or African American
Population - Females (%) - Asian
Population - Females (%) - Hispanic or Latino
Population - Females (%) - American Indian and Alaska Native
Population - Females (%) - Multirace
Population - Females (%) - Other Race
Coronavirus confirmed cases (Apr 19, 2024)
Deaths caused by coronavirus (Apr 19, 2024)
Coronavirus confirmed cases (per 100k population) (Apr 19, 2024)
Deaths caused by coronavirus (per 100k population) (Apr 19, 2024)
Daily increase in number of cases (Apr 19, 2024)
Weekly increase in number of cases (Apr 19, 2024)
Cases doubled (in days) (Apr 19, 2024)
Hospitalized patients (Apr 18, 2022)
Negative test results (Apr 18, 2022)
Total test results (Apr 18, 2022)
COVID Vaccine doses distributed (per 100k population) (Sep 19, 2023)
COVID Vaccine doses administered (per 100k population) (Sep 19, 2023)
COVID Vaccine doses distributed (Sep 19, 2023)
COVID Vaccine doses administered (Sep 19, 2023)
Likely homosexual households (%)
Likely homosexual households (% change since 2000)
Likely homosexual households - Lesbian couples (%)
Likely homosexual households - Lesbian couples (% change since 2000)
Likely homosexual households - Gay men (%)
Likely homosexual households - Gay men (% change since 2000)
Cost of living index
Median gross rent ($)
Median contract rent ($)
Median monthly housing costs ($)
Median house or condo value ($)
Median house or condo value ($ change since 2000)
Mean house or condo value by units in structure - 1, detached ($)
Mean house or condo value by units in structure - 1, attached ($)
Mean house or condo value by units in structure - 2 ($)
Mean house or condo value by units in structure by units in structure - 3 or 4 ($)
Mean house or condo value by units in structure - 5 or more ($)
Mean house or condo value by units in structure - Boat, RV, van, etc. ($)
Mean house or condo value by units in structure - Mobile home ($)
Median house or condo value ($) - White
Median house or condo value ($) - Black or African American
Median house or condo value ($) - Asian
Median house or condo value ($) - Hispanic or Latino
Median house or condo value ($) - American Indian and Alaska Native
Median house or condo value ($) - Multirace
Median house or condo value ($) - Other Race
Median resident age
Resident age diversity
Median resident age - Males
Median resident age - Females
Median resident age - White
Median resident age - Black or African American
Median resident age - Asian
Median resident age - Hispanic or Latino
Median resident age - American Indian and Alaska Native
Median resident age - Multirace
Median resident age - Other Race
Median resident age - Males - White
Median resident age - Males - Black or African American
Median resident age - Males - Asian
Median resident age - Males - Hispanic or Latino
Median resident age - Males - American Indian and Alaska Native
Median resident age - Males - Multirace
Median resident age - Males - Other Race
Median resident age - Females - White
Median resident age - Females - Black or African American
Median resident age - Females - Asian
Median resident age - Females - Hispanic or Latino
Median resident age - Females - American Indian and Alaska Native
Median resident age - Females - Multirace
Median resident age - Females - Other Race
Commute - mean travel time to work (minutes)
Travel time to work - Less than 5 minutes (%)
Travel time to work - Less than 5 minutes (% change since 2000)
Travel time to work - 5 to 9 minutes (%)
Travel time to work - 5 to 9 minutes (% change since 2000)
Travel time to work - 10 to 19 minutes (%)
Travel time to work - 10 to 19 minutes (% change since 2000)
Travel time to work - 20 to 29 minutes (%)
Travel time to work - 20 to 29 minutes (% change since 2000)
Travel time to work - 30 to 39 minutes (%)
Travel time to work - 30 to 39 minutes (% change since 2000)
Travel time to work - 40 to 59 minutes (%)
Travel time to work - 40 to 59 minutes (% change since 2000)
Travel time to work - 60 to 89 minutes (%)
Travel time to work - 60 to 89 minutes (% change since 2000)
Travel time to work - 90 or more minutes (%)
Travel time to work - 90 or more minutes (% change since 2000)
Marital status - Never married (%)
Marital status - Now married (%)
Marital status - Separated (%)
Marital status - Widowed (%)
Marital status - Divorced (%)
Median family income ($)
Median family income (% change since 2000)
Median non-family income ($)
Median non-family income (% change since 2000)
Median per capita income ($)
Median per capita income (% change since 2000)
Median family income ($) - White
Median family income ($) - Black or African American
Median family income ($) - Asian
Median family income ($) - Hispanic or Latino
Median family income ($) - American Indian and Alaska Native
Median family income ($) - Multirace
Median family income ($) - Other Race
Median year house/condo built
Median year apartment built
Year house built - Built 2005 or later (%)
Year house built - Built 2000 to 2004 (%)
Year house built - Built 1990 to 1999 (%)
Year house built - Built 1980 to 1989 (%)
Year house built - Built 1970 to 1979 (%)
Year house built - Built 1960 to 1969 (%)
Year house built - Built 1950 to 1959 (%)
Year house built - Built 1940 to 1949 (%)
Year house built - Built 1939 or earlier (%)
Average household size
Household density (households per square mile)
Average household size - White
Average household size - Black or African American
Average household size - Asian
Average household size - Hispanic or Latino
Average household size - American Indian and Alaska Native
Average household size - Multirace
Average household size - Other Race
Occupied housing units (%)
Vacant housing units (%)
Owner occupied housing units (%)
Renter occupied housing units (%)
Vacancy status - For rent (%)
Vacancy status - For sale only (%)
Vacancy status - Rented or sold, not occupied (%)
Vacancy status - For seasonal, recreational, or occasional use (%)
Vacancy status - For migrant workers (%)
Vacancy status - Other vacant (%)
Residents with income below the poverty level (%)
Residents with income below 50% of the poverty level (%)
Children below poverty level (%)
Poor families by family type - Married-couple family (%)
Poor families by family type - Male, no wife present (%)
Poor families by family type - Female, no husband present (%)
Poverty status for native-born residents (%)
Poverty status for foreign-born residents (%)
Poverty among high school graduates not in families (%)
Poverty among people who did not graduate high school not in families (%)
Residents with income below the poverty level (%) - White
Residents with income below the poverty level (%) - Black or African American
Residents with income below the poverty level (%) - Asian
Residents with income below the poverty level (%) - Hispanic or Latino
Residents with income below the poverty level (%) - American Indian and Alaska Native
Residents with income below the poverty level (%) - Multirace
Residents with income below the poverty level (%) - Other Race
Air pollution - Air Quality Index (AQI)
Air pollution - CO
Air pollution - NO2
Air pollution - SO2
Air pollution - Ozone
Air pollution - PM10
Air pollution - PM25
Air pollution - Pb
Crime - Murders per 100,000 population
Crime - Rapes per 100,000 population
Crime - Robberies per 100,000 population
Crime - Assaults per 100,000 population
Crime - Burglaries per 100,000 population
Crime - Thefts per 100,000 population
Crime - Auto thefts per 100,000 population
Crime - Arson per 100,000 population
Crime - City-data.com crime index
Crime - Violent crime index
Crime - Property crime index
Crime - Murders per 100,000 population (5 year average)
Crime - Rapes per 100,000 population (5 year average)
Crime - Robberies per 100,000 population (5 year average)
Crime - Assaults per 100,000 population (5 year average)
Crime - Burglaries per 100,000 population (5 year average)
Crime - Thefts per 100,000 population (5 year average)
Crime - Auto thefts per 100,000 population (5 year average)
Crime - Arson per 100,000 population (5 year average)
Crime - City-data.com crime index (5 year average)
Crime - Violent crime index (5 year average)
Crime - Property crime index (5 year average)
1996 Presidential Elections Results (%) - Democratic Party (Clinton)
1996 Presidential Elections Results (%) - Republican Party (Dole)
1996 Presidential Elections Results (%) - Other
2000 Presidential Elections Results (%) - Democratic Party (Gore)
2000 Presidential Elections Results (%) - Republican Party (Bush)
2000 Presidential Elections Results (%) - Other
2004 Presidential Elections Results (%) - Democratic Party (Kerry)
2004 Presidential Elections Results (%) - Republican Party (Bush)
2004 Presidential Elections Results (%) - Other
2008 Presidential Elections Results (%) - Democratic Party (Obama)
2008 Presidential Elections Results (%) - Republican Party (McCain)
2008 Presidential Elections Results (%) - Other
2012 Presidential Elections Results (%) - Democratic Party (Obama)
2012 Presidential Elections Results (%) - Republican Party (Romney)
2012 Presidential Elections Results (%) - Other
2016 Presidential Elections Results (%) - Democratic Party (Clinton)
2016 Presidential Elections Results (%) - Republican Party (Trump)
2016 Presidential Elections Results (%) - Other
2020 Presidential Elections Results (%) - Democratic Party (Biden)
2020 Presidential Elections Results (%) - Republican Party (Trump)
2020 Presidential Elections Results (%) - Other
Ancestries Reported - Arab (%)
Ancestries Reported - Czech (%)
Ancestries Reported - Danish (%)
Ancestries Reported - Dutch (%)
Ancestries Reported - English (%)
Ancestries Reported - French (%)
Ancestries Reported - French Canadian (%)
Ancestries Reported - German (%)
Ancestries Reported - Greek (%)
Ancestries Reported - Hungarian (%)
Ancestries Reported - Irish (%)
Ancestries Reported - Italian (%)
Ancestries Reported - Lithuanian (%)
Ancestries Reported - Norwegian (%)
Ancestries Reported - Polish (%)
Ancestries Reported - Portuguese (%)
Ancestries Reported - Russian (%)
Ancestries Reported - Scotch-Irish (%)
Ancestries Reported - Scottish (%)
Ancestries Reported - Slovak (%)
Ancestries Reported - Subsaharan African (%)
Ancestries Reported - Swedish (%)
Ancestries Reported - Swiss (%)
Ancestries Reported - Ukrainian (%)
Ancestries Reported - United States (%)
Ancestries Reported - Welsh (%)
Ancestries Reported - West Indian (%)
Ancestries Reported - Other (%)
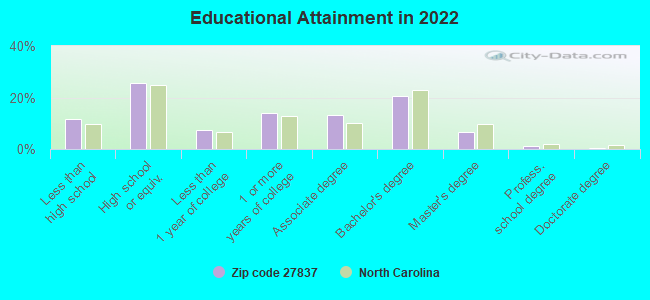
Educational Attainment - No schooling completed (%)
Educational Attainment - Less than high school (%)
Educational Attainment - High school or equivalent (%)
Educational Attainment - Less than 1 year of college (%)
Educational Attainment - 1 or more years of college (%)
Educational Attainment - Associate degree (%)
Educational Attainment - Bachelor's degree (%)
Educational Attainment - Master's degree (%)
Educational Attainment - Professional school degree (%)
Educational Attainment - Doctorate degree (%)
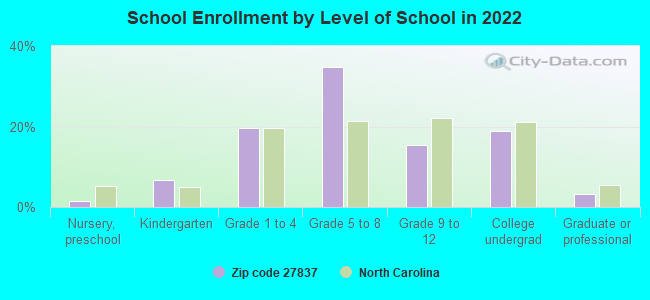
School Enrollment - Nursery, preschool (%)
School Enrollment - Kindergarten (%)
School Enrollment - Grade 1 to 4 (%)
School Enrollment - Grade 5 to 8 (%)
School Enrollment - Grade 9 to 12 (%)
School Enrollment - College undergrad (%)
School Enrollment - Graduate or professional (%)
School Enrollment - Not enrolled in school (%)
School enrollment - Public schools (%)
School enrollment - Private schools (%)
School enrollment - Not enrolled (%)
Median number of rooms in houses and condos
Median number of rooms in apartments
Housing units lacking complete plumbing facilities (%)
Housing units lacking complete kitchen facilities (%)
Density of houses
Urban houses (%)
Rural houses (%)
Households with people 60 years and over (%)
Households with people 65 years and over (%)
Households with people 75 years and over (%)
Households with one or more nonrelatives (%)
Households with no nonrelatives (%)
Population in households (%)
Family households (%)
Nonfamily households (%)
Population in families (%)
Family households with own children (%)
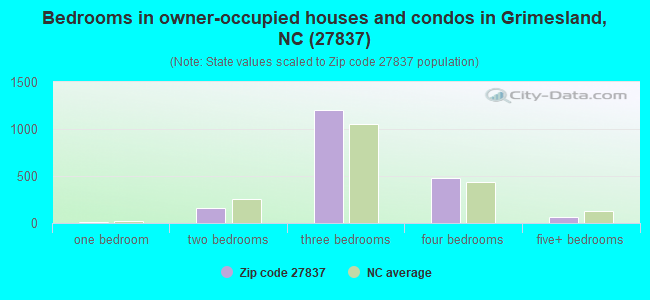
Median number of bedrooms in owner occupied houses
Mean number of bedrooms in owner occupied houses
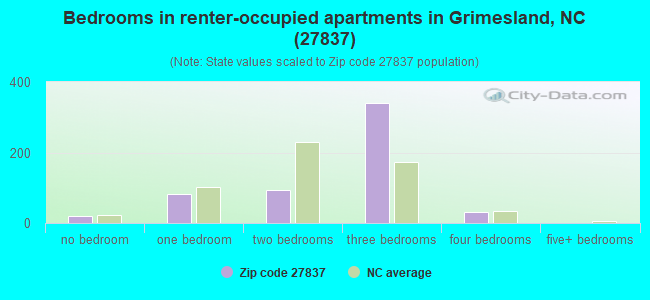
Median number of bedrooms in renter occupied houses
Mean number of bedrooms in renter occupied houses
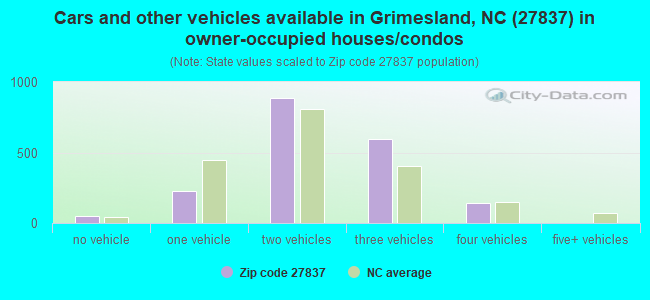
Median number of vehichles in owner occupied houses
Mean number of vehichles in owner occupied houses
Median number of vehichles in renter occupied houses
Mean number of vehichles in renter occupied houses
Mortgage status - with mortgage (%)
Mortgage status - with second mortgage (%)
Mortgage status - with home equity loan (%)
Mortgage status - with both second mortgage and home equity loan (%)
Mortgage status - without a mortgage (%)
Average family size
Average family size - White
Average family size - Black or African American
Average family size - Asian
Average family size - Hispanic or Latino
Average family size - American Indian and Alaska Native
Average family size - Multirace
Average family size - Other Race
Geographical mobility - Same house 1 year ago (%)
Geographical mobility - Moved within same county (%)
Geographical mobility - Moved from different county within same state (%)
Geographical mobility - Moved from different state (%)
Geographical mobility - Moved from abroad (%)
Place of birth - Born in state of residence (%)
Place of birth - Born in other state (%)
Place of birth - Native, outside of US (%)
Place of birth - Foreign born (%)
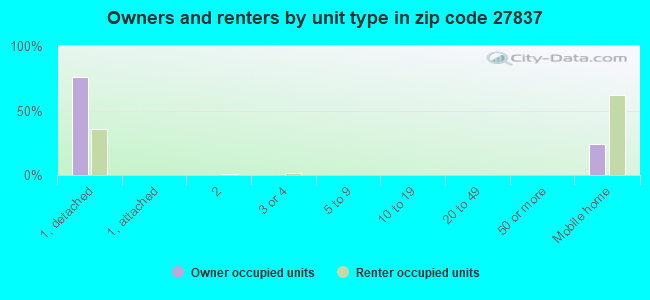
Housing units in structures - 1, detached (%)
Housing units in structures - 1, attached (%)
Housing units in structures - 2 (%)
Housing units in structures - 3 or 4 (%)
Housing units in structures - 5 to 9 (%)
Housing units in structures - 10 to 19 (%)
Housing units in structures - 20 to 49 (%)
Housing units in structures - 50 or more (%)
Housing units in structures - Mobile home (%)
Housing units in structures - Boat, RV, van, etc. (%)
House/condo owner moved in on average (years ago)
Renter moved in on average (years ago)
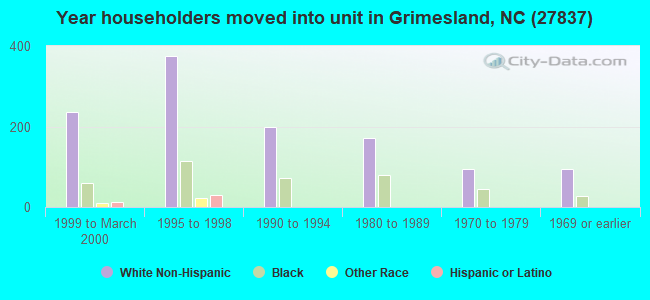
Year householder moved into unit - Moved in 1999 to March 2000 (%)
Year householder moved into unit - Moved in 1995 to 1998 (%)
Year householder moved into unit - Moved in 1990 to 1994 (%)
Year householder moved into unit - Moved in 1980 to 1989 (%)
Year householder moved into unit - Moved in 1970 to 1979 (%)
Year householder moved into unit - Moved in 1969 or earlier (%)
Means of transportation to work - Drove car alone (%)
Means of transportation to work - Carpooled (%)
Means of transportation to work - Public transportation (%)
Means of transportation to work - Bus or trolley bus (%)
Means of transportation to work - Streetcar or trolley car (%)
Means of transportation to work - Subway or elevated (%)
Means of transportation to work - Railroad (%)
Means of transportation to work - Ferryboat (%)
Means of transportation to work - Taxicab (%)
Means of transportation to work - Motorcycle (%)
Means of transportation to work - Bicycle (%)
Means of transportation to work - Walked (%)
Means of transportation to work - Other means (%)
Working at home (%)
Industry diversity
Most Common Industries - Agriculture, forestry, fishing and hunting, and mining (%)
Most Common Industries - Agriculture, forestry, fishing and hunting (%)
Most Common Industries - Mining, quarrying, and oil and gas extraction (%)
Most Common Industries - Construction (%)
Most Common Industries - Manufacturing (%)
Most Common Industries - Wholesale trade (%)
Most Common Industries - Retail trade (%)
Most Common Industries - Transportation and warehousing, and utilities (%)
Most Common Industries - Transportation and warehousing (%)
Most Common Industries - Utilities (%)
Most Common Industries - Information (%)
Most Common Industries - Finance and insurance, and real estate and rental and leasing (%)
Most Common Industries - Finance and insurance (%)
Most Common Industries - Real estate and rental and leasing (%)
Most Common Industries - Professional, scientific, and management, and administrative and waste management services (%)
Most Common Industries - Professional, scientific, and technical services (%)
Most Common Industries - Management of companies and enterprises (%)
Most Common Industries - Administrative and support and waste management services (%)
Most Common Industries - Educational services, and health care and social assistance (%)
Most Common Industries - Educational services (%)
Most Common Industries - Health care and social assistance (%)
Most Common Industries - Arts, entertainment, and recreation, and accommodation and food services (%)
Most Common Industries - Arts, entertainment, and recreation (%)
Most Common Industries - Accommodation and food services (%)
Most Common Industries - Other services, except public administration (%)
Most Common Industries - Public administration (%)
Occupation diversity
Most Common Occupations - Management, business, science, and arts occupations (%)
Most Common Occupations - Management, business, and financial occupations (%)
Most Common Occupations - Management occupations (%)
Most Common Occupations - Business and financial operations occupations (%)
Most Common Occupations - Computer, engineering, and science occupations (%)
Most Common Occupations - Computer and mathematical occupations (%)
Most Common Occupations - Architecture and engineering occupations (%)
Most Common Occupations - Life, physical, and social science occupations (%)
Most Common Occupations - Education, legal, community service, arts, and media occupations (%)
Most Common Occupations - Community and social service occupations (%)
Most Common Occupations - Legal occupations (%)
Most Common Occupations - Education, training, and library occupations (%)
Most Common Occupations - Arts, design, entertainment, sports, and media occupations (%)
Most Common Occupations - Healthcare practitioners and technical occupations (%)
Most Common Occupations - Health diagnosing and treating practitioners and other technical occupations (%)
Most Common Occupations - Health technologists and technicians (%)
Most Common Occupations - Service occupations (%)
Most Common Occupations - Healthcare support occupations (%)
Most Common Occupations - Protective service occupations (%)
Most Common Occupations - Fire fighting and prevention, and other protective service workers including supervisors (%)
Most Common Occupations - Law enforcement workers including supervisors (%)
Most Common Occupations - Food preparation and serving related occupations (%)
Most Common Occupations - Building and grounds cleaning and maintenance occupations (%)
Most Common Occupations - Personal care and service occupations (%)
Most Common Occupations - Sales and office occupations (%)
Most Common Occupations - Sales and related occupations (%)
Most Common Occupations - Office and administrative support occupations (%)
Most Common Occupations - Natural resources, construction, and maintenance occupations (%)
Most Common Occupations - Farming, fishing, and forestry occupations (%)
Most Common Occupations - Construction and extraction occupations (%)
Most Common Occupations - Installation, maintenance, and repair occupations (%)
Most Common Occupations - Production, transportation, and material moving occupations (%)
Most Common Occupations - Production occupations (%)
Most Common Occupations - Transportation occupations (%)
Most Common Occupations - Material moving occupations (%)
People in Group quarters - Institutionalized population (%)
People in Group quarters - Correctional institutions (%)
People in Group quarters - Federal prisons and detention centers (%)
People in Group quarters - Halfway houses (%)
People in Group quarters - Local jails and other confinement facilities (including police lockups) (%)
People in Group quarters - Military disciplinary barracks (%)
People in Group quarters - State prisons (%)
People in Group quarters - Other types of correctional institutions (%)
People in Group quarters - Nursing homes (%)
People in Group quarters - Hospitals/wards, hospices, and schools for the handicapped (%)
People in Group quarters - Hospitals/wards and hospices for chronically ill (%)
People in Group quarters - Hospices or homes for chronically ill (%)
People in Group quarters - Military hospitals or wards for chronically ill (%)
People in Group quarters - Other hospitals or wards for chronically ill (%)
People in Group quarters - Hospitals or wards for drug/alcohol abuse (%)
People in Group quarters - Mental (Psychiatric) hospitals or wards (%)
People in Group quarters - Schools, hospitals, or wards for the mentally retarded (%)
People in Group quarters - Schools, hospitals, or wards for the physically handicapped (%)
People in Group quarters - Institutions for the deaf (%)
People in Group quarters - Institutions for the blind (%)
People in Group quarters - Orthopedic wards and institutions for the physically handicapped (%)
People in Group quarters - Wards in general hospitals for patients who have no usual home elsewhere (%)
People in Group quarters - Wards in military hospitals for patients who have no usual home elsewhere (%)
People in Group quarters - Juvenile institutions (%)
People in Group quarters - Long-term care (%)
People in Group quarters - Homes for abused, dependent, and neglected children (%)
People in Group quarters - Residential treatment centers for emotionally disturbed children (%)
People in Group quarters - Training schools for juvenile delinquents (%)
People in Group quarters - Short-term care, detention or diagnostic centers for delinquent children (%)
People in Group quarters - Type of juvenile institution unknown (%)
People in Group quarters - Noninstitutionalized population (%)
People in Group quarters - College dormitories (includes college quarters off campus) (%)
People in Group quarters - Military quarters (%)
People in Group quarters - On base (%)
People in Group quarters - Barracks, unaccompanied personnel housing (UPH), (Enlisted/Officer), ;and similar group living quarters for military personnel (%)
People in Group quarters - Transient quarters for temporary residents (%)
People in Group quarters - Military ships (%)
People in Group quarters - Group homes (%)
People in Group quarters - Homes or halfway houses for drug/alcohol abuse (%)
People in Group quarters - Homes for the mentally ill (%)
People in Group quarters - Homes for the mentally retarded (%)
People in Group quarters - Homes for the physically handicapped (%)
People in Group quarters - Other group homes (%)
People in Group quarters - Religious group quarters (%)
People in Group quarters - Dormitories (%)
People in Group quarters - Agriculture workers' dormitories on farms (%)
People in Group quarters - Job Corps and vocational training facilities (%)
People in Group quarters - Other workers' dormitories (%)
People in Group quarters - Crews of maritime vessels (%)
People in Group quarters - Other nonhousehold living situations (%)
People in Group quarters - Other noninstitutional group quarters (%)
Residents speaking English at home (%)
Residents speaking English at home - Born in the United States (%)
Residents speaking English at home - Native, born elsewhere (%)
Residents speaking English at home - Foreign born (%)
Residents speaking Spanish at home (%)
Residents speaking Spanish at home - Born in the United States (%)
Residents speaking Spanish at home - Native, born elsewhere (%)
Residents speaking Spanish at home - Foreign born (%)
Residents speaking other language at home (%)
Residents speaking other language at home - Born in the United States (%)
Residents speaking other language at home - Native, born elsewhere (%)
Residents speaking other language at home - Foreign born (%)
Class of Workers - Employee of private company (%)
Class of Workers - Self-employed in own incorporated business (%)
Class of Workers - Private not-for-profit wage and salary workers (%)
Class of Workers - Local government workers (%)
Class of Workers - State government workers (%)
Class of Workers - Federal government workers (%)
Class of Workers - Self-employed workers in own not incorporated business and Unpaid family workers (%)
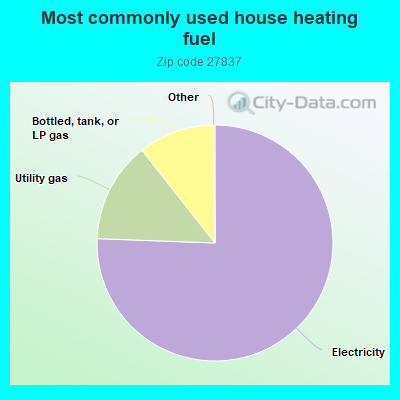
House heating fuel used in houses and condos - Utility gas (%)
House heating fuel used in houses and condos - Bottled, tank, or LP gas (%)
House heating fuel used in houses and condos - Electricity (%)
House heating fuel used in houses and condos - Fuel oil, kerosene, etc. (%)
House heating fuel used in houses and condos - Coal or coke (%)
House heating fuel used in houses and condos - Wood (%)
House heating fuel used in houses and condos - Solar energy (%)
House heating fuel used in houses and condos - Other fuel (%)
House heating fuel used in houses and condos - No fuel used (%)
House heating fuel used in apartments - Utility gas (%)
House heating fuel used in apartments - Bottled, tank, or LP gas (%)
House heating fuel used in apartments - Electricity (%)
House heating fuel used in apartments - Fuel oil, kerosene, etc. (%)
House heating fuel used in apartments - Coal or coke (%)
House heating fuel used in apartments - Wood (%)
House heating fuel used in apartments - Solar energy (%)
House heating fuel used in apartments - Other fuel (%)
House heating fuel used in apartments - No fuel used (%)
Armed forces status - In Armed Forces (%)
Armed forces status - Civilian (%)
Armed forces status - Civilian - Veteran (%)
Armed forces status - Civilian - Nonveteran (%)
Fatal accidents locations in years 2005-2021
Fatal accidents locations in 2005
Fatal accidents locations in 2006
Fatal accidents locations in 2007
Fatal accidents locations in 2008
Fatal accidents locations in 2009
Fatal accidents locations in 2010
Fatal accidents locations in 2011
Fatal accidents locations in 2012
Fatal accidents locations in 2013
Fatal accidents locations in 2014
Fatal accidents locations in 2015
Fatal accidents locations in 2016
Fatal accidents locations in 2017
Fatal accidents locations in 2018
Fatal accidents locations in 2019
Fatal accidents locations in 2020
Fatal accidents locations in 2021
Alcohol use - People drinking some alcohol every month (%)
Alcohol use - People not drinking at all (%)
Alcohol use - Average days/month drinking alcohol
Alcohol use - Average drinks/week
Alcohol use - Average days/year people drink much
Audiometry - Average condition of hearing (%)
Audiometry - People that can hear a whisper from across a quiet room (%)
Audiometry - People that can hear normal voice from across a quiet room (%)
Audiometry - Ears ringing, roaring, buzzing (%)
Audiometry - Had a job exposure to loud noise (%)
Audiometry - Had off-work exposure to loud noise (%)
Blood Pressure & Cholesterol - Has high blood pressure (%)
Blood Pressure & Cholesterol - Checking blood pressure at home (%)
Blood Pressure & Cholesterol - Frequently checking blood cholesterol (%)
Blood Pressure & Cholesterol - Has high cholesterol level (%)
Consumer Behavior - Money monthly spent on food at supermarket/grocery store
Consumer Behavior - Money monthly spent on food at other stores
Consumer Behavior - Money monthly spent on eating out
Consumer Behavior - Money monthly spent on carryout/delivered foods
Consumer Behavior - Income spent on food at supermarket/grocery store (%)
Consumer Behavior - Income spent on food at other stores (%)
Consumer Behavior - Income spent on eating out (%)
Consumer Behavior - Income spent on carryout/delivered foods (%)
Current Health Status - General health condition (%)
Current Health Status - Blood donors (%)
Current Health Status - Has blood ever tested for HIV virus (%)
Current Health Status - Left-handed people (%)
Dermatology - People using sunscreen (%)
Diabetes - Diabetics (%)
Diabetes - Had a blood test for high blood sugar (%)
Diabetes - People taking insulin (%)
Diet Behavior & Nutrition - Diet health (%)
Diet Behavior & Nutrition - Milk product consumption (# of products/month)
Diet Behavior & Nutrition - Meals not home prepared (#/week)
Diet Behavior & Nutrition - Meals from fast food or pizza place (#/week)
Diet Behavior & Nutrition - Ready-to-eat foods (#/month)
Diet Behavior & Nutrition - Frozen meals/pizza (#/month)
Drug Use - People that ever used marijuana or hashish (%)
Drug Use - Ever used hard drugs (%)
Drug Use - Ever used any form of cocaine (%)
Drug Use - Ever used heroin (%)
Drug Use - Ever used methamphetamine (%)
Health Insurance - People covered by health insurance (%)
Kidney Conditions-Urology - Avg. # of times urinating at night
Medical Conditions - People with asthma (%)
Medical Conditions - People with anemia (%)
Medical Conditions - People with psoriasis (%)
Medical Conditions - People with overweight (%)
Medical Conditions - Elderly people having difficulties in thinking or remembering (%)
Medical Conditions - People who ever received blood transfusion (%)
Medical Conditions - People having trouble seeing even with glass/contacts (%)
Medical Conditions - People with arthritis (%)
Medical Conditions - People with gout (%)
Medical Conditions - People with congestive heart failure (%)
Medical Conditions - People with coronary heart disease (%)
Medical Conditions - People with angina pectoris (%)
Medical Conditions - People who ever had heart attack (%)
Medical Conditions - People who ever had stroke (%)
Medical Conditions - People with emphysema (%)
Medical Conditions - People with thyroid problem (%)
Medical Conditions - People with chronic bronchitis (%)
Medical Conditions - People with any liver condition (%)
Medical Conditions - People who ever had cancer or malignancy (%)
Mental Health - People who have little interest in doing things (%)
Mental Health - People feeling down, depressed, or hopeless (%)
Mental Health - People who have trouble sleeping or sleeping too much (%)
Mental Health - People feeling tired or having little energy (%)
Mental Health - People with poor appetite or overeating (%)
Mental Health - People feeling bad about themself (%)
Mental Health - People who have trouble concentrating on things (%)
Mental Health - People moving or speaking slowly or too fast (%)
Mental Health - People having thoughts they would be better off dead (%)
Oral Health - Average years since last visit a dentist
Oral Health - People embarrassed because of mouth (%)
Oral Health - People with gum disease (%)
Oral Health - General health of teeth and gums (%)
Oral Health - Average days a week using dental floss/device
Oral Health - Average days a week using mouthwash for dental problem
Oral Health - Average number of teeth
Pesticide Use - Households using pesticides to control insects (%)
Pesticide Use - Households using pesticides to kill weeds (%)
Physical Activity - People doing vigorous-intensity work activities (%)
Physical Activity - People doing moderate-intensity work activities (%)
Physical Activity - People walking or bicycling (%)
Physical Activity - People doing vigorous-intensity recreational activities (%)
Physical Activity - People doing moderate-intensity recreational activities (%)
Physical Activity - Average hours a day doing sedentary activities
Physical Activity - Average hours a day watching TV or videos
Physical Activity - Average hours a day using computer
Physical Functioning - People having limitations keeping them from working (%)
Physical Functioning - People limited in amount of work they can do (%)
Physical Functioning - People that need special equipment to walk (%)
Physical Functioning - People experiencing confusion/memory problems (%)
Physical Functioning - People requiring special healthcare equipment (%)
Prescription Medications - Average number of prescription medicines taking
Preventive Aspirin Use - Adults 40+ taking low-dose aspirin (%)
Reproductive Health - Vaginal deliveries (%)
Reproductive Health - Cesarean deliveries (%)
Reproductive Health - Deliveries resulted in a live birth (%)
Reproductive Health - Pregnancies resulted in a delivery (%)
Reproductive Health - Women breastfeeding newborns (%)
Reproductive Health - Women that had a hysterectomy (%)
Reproductive Health - Women that had both ovaries removed (%)
Reproductive Health - Women that have ever taken birth control pills (%)
Reproductive Health - Women taking birth control pills (%)
Reproductive Health - Women that have ever used Depo-Provera or injectables (%)
Reproductive Health - Women that have ever used female hormones (%)
Sexual Behavior - People 18+ that ever had sex (vaginal, anal, or oral) (%)
Sexual Behavior - Males 18+ that ever had vaginal sex with a woman (%)
Sexual Behavior - Males 18+ that ever performed oral sex on a woman (%)
Sexual Behavior - Males 18+ that ever had anal sex with a woman (%)
Sexual Behavior - Males 18+ that ever had any sex with a man (%)
Sexual Behavior - Females 18+ that ever had vaginal sex with a man (%)
Sexual Behavior - Females 18+ that ever performed oral sex on a man (%)
Sexual Behavior - Females 18+ that ever had anal sex with a man (%)
Sexual Behavior - Females 18+ that ever had any kind of sex with a woman (%)
Sexual Behavior - Average age people first had sex
Sexual Behavior - Average number of female sex partners in lifetime (males 18+)
Sexual Behavior - Average number of female vaginal sex partners in lifetime (males 18+)
Sexual Behavior - Average age people first performed oral sex on a woman (18+)
Sexual Behavior - Average number of woman performed oral sex on in lifetime (18+)
Sexual Behavior - Average number of male sex partners in lifetime (males 18+)
Sexual Behavior - Average number of male anal sex partners in lifetime (males 18+)
Sexual Behavior - Average age people first performed oral sex on a man (18+)
Sexual Behavior - Average number of male oral sex partners in lifetime (18+)
Sexual Behavior - People using protection when performing oral sex (%)
Sexual Behavior - Average number of times people have vaginal or anal sex a year
Sexual Behavior - People having sex without condom (%)
Sexual Behavior - Average number of male sex partners in lifetime (females 18+)
Sexual Behavior - Average number of male vaginal sex partners in lifetime (females 18+)
Sexual Behavior - Average number of female sex partners in lifetime (females 18+)
Sexual Behavior - Circumcised males 18+ (%)
Sleep Disorders - Average hours sleeping at night
Sleep Disorders - People that has trouble sleeping (%)
Smoking-Cigarette Use - People smoking cigarettes (%)
Taste & Smell - People 40+ having problems with smell (%)
Taste & Smell - People 40+ having problems with taste (%)
Taste & Smell - People 40+ that ever had wisdom teeth removed (%)
Taste & Smell - People 40+ that ever had tonsils teeth removed (%)
Taste & Smell - People 40+ that ever had a loss of consciousness because of a head injury (%)
Taste & Smell - People 40+ that ever had a broken nose or other serious injury to face or skull (%)
Taste & Smell - People 40+ that ever had two or more sinus infections (%)
Weight - Average height (inches)
Weight - Average weight (pounds)
Weight - Average BMI
Weight - People that are obese (%)
Weight - People that ever were obese (%)
Weight - People trying to lose weight (%)
Urban population: 70
Rural population: 5,989
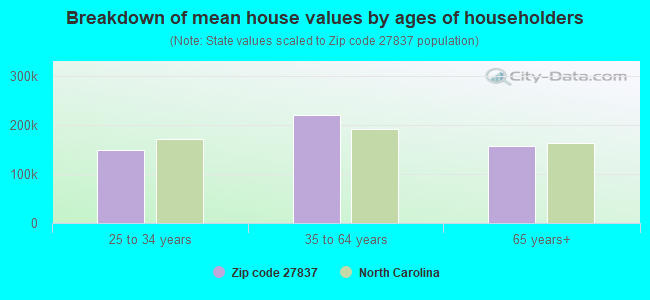
Estimated median house/condo value in 2022: $159,114
27837:
$159,114North Carolina:
$280,600
According to our research of North Carolina and other state lists, there were 12 registered sex offenders living in 27837 zip code as of April 19, 2024 . The ratio of all residents to sex offenders in zip code 27837 is 555 to 1.The ratio of registered sex offenders to all residents in this zip code is near the state average.
Median resident age: This zip code:
42.6 yearsNorth Carolina median age:
39.2 years
Average household size: This zip code:
2.4 peopleNorth Carolina:
2.4 people
Averages for the 2020 tax year for zip code 27837, filed in 2021:
Average Adjusted Gross Income (AGI) in 2020: $68,808 (Individual Income Tax Returns) Here:
$68,808State:
$70,020
Salary/wage: $57,870 (reported on 83.8% of returns )Here:
$57,870State:
$58,387
(% of AGI for various income ranges: 1172.4% for AGIs below $25k , 4048.4% for AGIs $25k-50k , 6650.0% for AGIs $50k-75k , 10164.4% for AGIs $75k-100k , 18500.8% for AGIs $100k-200k , 68830.0% for AGIs over 200k ) Taxable interest for individuals: $1,173 (reported on 31.0% of returns )This zip code:
$1,173North Carolina:
$1,479
(% of AGI for various income ranges: 9.9% for AGIs below $25k , 11.8% for AGIs $25k-50k , 31.6% for AGIs $50k-75k , 57.5% for AGIs $75k-100k , 65.4% for AGIs $100k-200k , 1335.0% for AGIs over 200k ) Ordinary dividends: $4,731 (reported on 13.3% of returns )(% of AGI for various income ranges: 12.3% for AGIs below $25k , 34.9% for AGIs $25k-50k , 49.2% for AGIs $50k-75k , 146.2% for AGIs $75k-100k , 139.2% for AGIs $100k-200k , 1920.0% for AGIs over 200k ) Net capital gain/loss in AGI: +$19,753 (reported on 13.3% of returns )Here:
+$19,753State:
+$23,652
(% of AGI for various income ranges: 11.4% for AGIs below $25k , 8.4% for AGIs $25k-50k , 84.8% for AGIs $50k-75k , 149.4% for AGIs $75k-100k , 474.2% for AGIs $100k-200k , 13507.5% for AGIs over 200k ) Profit/loss from business: +$12,853 (reported on 18.1% of returns )Here:
+$12,853State:
+$11,710
(% of AGI for various income ranges: 164.6% for AGIs below $25k , 94.7% for AGIs $25k-50k , 304.8% for AGIs $50k-75k , 56.9% for AGIs $75k-100k , 669.2% for AGIs $100k-200k , 5610.0% for AGIs over 200k ) Taxable individual retirement arrangement distribution: $15,283 (reported on 6.6% of returns )27837:
$15,283North Carolina:
$20,247
(% of AGI for various income ranges: 49.2% for AGIs below $25k , 35.8% for AGIs $25k-50k , 228.8% for AGIs $50k-75k , 227.5% for AGIs $75k-100k , 543.8% for AGIs $100k-200k ) Total itemized deductions: $36,865 (reported on 7.4% of returns )Here:
$36,865State:
$34,549
(% of AGI for various income ranges: 110.6% for AGIs below $25k , 308.4% for AGIs $50k-75k , 531.2% for AGIs $75k-100k , 974.6% for AGIs $100k-200k , 6570.0% for AGIs over 200k ) Charity contributions: $12,724 (reported on 6.3% of returns )Here:
$12,724State:
$13,360
(% of AGI for various income ranges: 156.0% for AGIs $50k-75k , 145.6% for AGIs $75k-100k , 305.4% for AGIs $100k-200k , 2017.5% for AGIs over 200k ) Taxes paid: $7,135 (reported on 7.4% of returns )(% of AGI for various income ranges: 13.9% for AGIs below $25k , 54.8% for AGIs $50k-75k , 87.5% for AGIs $75k-100k , 230.0% for AGIs $100k-200k , 1247.5% for AGIs over 200k ) Earned income credit: $2,704 (reported on 19.9% of returns )(% of AGI for various income ranges: 150.4% for AGIs below $25k , 87.1% for AGIs $25k-50k ) Percentage of individuals using paid preparers for their 2020 taxes: 94.1%(% for various income ranges: 92.7% for AGIs below $25k , 93.4% for AGIs $25k-50k , 94.4% for AGIs $50k-75k , 95.8% for AGIs $75k-100k , 95.2% for AGIs $100k-200k , 100.0% for AGIs over 200k )
Averages for the 2012 tax year for zip code 27837, filed in 2013:
Average Adjusted Gross Income (AGI) in 2012: $55,165 (Individual Income Tax Returns) Here:
$55,165State:
$54,937
Salary/wage: $47,560 (reported on 87.2% of returns )Here:
$47,560State:
$46,336
(% of AGI for various income ranges: 75.3% for AGIs below $25k , 81.1% for AGIs $25k-50k , 82.2% for AGIs $50k-75k , 85.2% for AGIs $75k-100k , 81.8% for AGIs $100k-200k , 44.8% for AGIs over 200k ) Taxable interest for individuals: $626 (reported on 34.2% of returns )This zip code:
$626North Carolina:
$1,298
(% of AGI for various income ranges: 0.4% for AGIs below $25k , 0.4% for AGIs $25k-50k , 0.5% for AGIs $50k-75k , 0.3% for AGIs $75k-100k , 0.3% for AGIs $100k-200k , 0.4% for AGIs over 200k ) Ordinary dividends: $2,719 (reported on 13.2% of returns )(% of AGI for various income ranges: 0.4% for AGIs below $25k , 0.4% for AGIs $25k-50k , 0.5% for AGIs $50k-75k , 0.2% for AGIs $75k-100k , 1.2% for AGIs $100k-200k , 0.8% for AGIs over 200k ) Net capital gain/loss in AGI: +$6,246 (reported on 11.1% of returns )Here:
+$6,246State:
+$12,740
(% of AGI for various income ranges: 0.1% for AGIs $25k-50k , 0.2% for AGIs $50k-75k , 1.2% for AGIs $100k-200k , 5.2% for AGIs over 200k ) Profit/loss from business: +$6,843 (reported on 17.9% of returns )Here:
+$6,843State:
+$10,311
(% of AGI for various income ranges: 11.0% for AGIs below $25k , 2.2% for AGIs $25k-50k , 2.2% for AGIs $50k-75k , 0.9% for AGIs $75k-100k , 1.7% for AGIs $100k-200k ) Taxable individual retirement arrangement distribution: $12,275 (reported on 6.8% of returns )27837:
$12,275North Carolina:
$15,575
(% of AGI for various income ranges: 2.0% for AGIs below $25k , 1.8% for AGIs $25k-50k , 2.1% for AGIs $50k-75k , 1.6% for AGIs $75k-100k , 1.9% for AGIs $100k-200k ) Total itemized deductions: $20,841 (21% of AGI, reported on 37.6% of returns )Here:
$20,841State:
$23,438
Here:
21.0% of AGIState:
21.5% of AGI
(% of AGI for various income ranges: 6.8% for AGIs below $25k , 12.1% for AGIs $25k-50k , 14.7% for AGIs $50k-75k , 16.0% for AGIs $75k-100k , 17.8% for AGIs $100k-200k , 12.5% for AGIs over 200k ) Charity contributions: $3,969 (reported on 31.6% of returns )(% of AGI for various income ranges: 1.0% for AGIs below $25k , 1.7% for AGIs $25k-50k , 2.6% for AGIs $50k-75k , 2.9% for AGIs $75k-100k , 2.9% for AGIs $100k-200k , 1.6% for AGIs over 200k ) Taxes paid: $7,797 (reported on 37.6% of returns )(% of AGI for various income ranges: 0.9% for AGIs below $25k , 2.8% for AGIs $25k-50k , 4.3% for AGIs $50k-75k , 5.5% for AGIs $75k-100k , 7.2% for AGIs $100k-200k , 7.7% for AGIs over 200k ) Earned income credit: $2,658 (reported on 22.6% of returns )(% of AGI for various income ranges: 9.8% for AGIs below $25k , 1.4% for AGIs $25k-50k ) Percentage of individuals using paid preparers for their 2012 taxes: 52.6%(% for various income ranges: 51.1% for AGIs below $25k , 48.3% for AGIs $25k-50k , 53.3% for AGIs $50k-75k , 57.7% for AGIs $75k-100k , 56.0% for AGIs $100k-200k , 80.0% for AGIs over 200k )
Averages for the 2004 tax year for zip code 27837, filed in 2005:
Average Adjusted Gross Income (AGI) in 2004: $43,284 (Individual Income Tax Returns) Here:
$43,284State:
$45,376
Salary/wage: $38,006 (reported on 89.6% of returns )Here:
$38,006State:
$39,442
(% of AGI for various income ranges: 119.0% for AGIs below $10k , 85.4% for AGIs $10k-25k , 88.2% for AGIs $25k-50k , 87.7% for AGIs $50k-75k , 87.0% for AGIs $75k-100k , 55.8% for AGIs over 100k ) Taxable interest for individuals: $1,067 (reported on 35.0% of returns )This zip code:
$1,067North Carolina:
$1,515
(% of AGI for various income ranges: 1.9% for AGIs below $10k , 0.8% for AGIs $10k-25k , 0.3% for AGIs $25k-50k , 0.5% for AGIs $50k-75k , 0.4% for AGIs $75k-100k , 1.7% for AGIs over 100k ) Taxable dividends: $1,415 (reported on 13.1% of returns )(% of AGI for various income ranges: 0.4% for AGIs below $10k , 0.1% for AGIs $10k-25k , 0.2% for AGIs $25k-50k , 0.2% for AGIs $50k-75k , 0.5% for AGIs $75k-100k , 0.9% for AGIs over 100k ) Net capital gain/loss: +$5,642 (reported on 10.8% of returns )Here:
+$5,642State:
+$11,152
(% of AGI for various income ranges: -1.4% for AGIs below $10k , -0.1% for AGIs $10k-25k , 0.0% for AGIs $25k-50k , -0.1% for AGIs $50k-75k , 1.1% for AGIs $75k-100k , 4.3% for AGIs over 100k ) Profit/loss from business: +$6,500 (reported on 18.4% of returns )Here:
+$6,500State:
+$9,490
(% of AGI for various income ranges: 8.5% for AGIs below $10k , 5.4% for AGIs $10k-25k , 2.8% for AGIs $25k-50k , 1.8% for AGIs $50k-75k , 0.5% for AGIs $75k-100k , 3.4% for AGIs over 100k ) Profit/loss from farming: +$538 (reported on 0.7% of returns )
Here : State :
IRA payment deduction: $2,951 (reported on 2.1% of returns )27837:
$2,951North Carolina:
$2,967
Total itemized deductions: $17,458 (22% of AGI, reported on 37.8% of returns )Here:
$17,458State:
$19,464
Here:
22.4% of AGIState:
22.7% of AGI
(% of AGI for various income ranges: 11.8% for AGIs below $10k , 9.1% for AGIs $10k-25k , 14.8% for AGIs $25k-50k , 16.4% for AGIs $50k-75k , 18.6% for AGIs $75k-100k , 15.2% for AGIs over 100k ) Charity contributions deductions: $3,214 (4% of AGI, reported on 33.9% of returns )Here:
4.0% of AGIState:
4.5% of AGI
(% of AGI for various income ranges: 1.5% for AGIs $10k-25k , 2.4% for AGIs $25k-50k , 2.7% for AGIs $50k-75k , 2.8% for AGIs $75k-100k , 2.8% for AGIs over 100k ) Total tax: $6,394 (reported on 70.0% of returns )(% of AGI for various income ranges: 3.3% for AGIs below $10k , 3.1% for AGIs $10k-25k , 5.8% for AGIs $25k-50k , 8.1% for AGIs $50k-75k , 9.6% for AGIs $75k-100k , 18.7% for AGIs over 100k ) Earned income credit: $2,019 (reported on 24.4% of returns )Percentage of individuals using paid preparers for their 2004 taxes: 64.2%(% for various income ranges: 63.4% for AGIs below $10k , 67.9% for AGIs $10k-25k , 63.7% for AGIs $25k-50k , 56.3% for AGIs $50k-75k , 64.3% for AGIs $75k-100k , 71.5% for AGIs over 100k )
Estimated median household income in 2022: This zip code:
$72,119North Carolina:
$67,481
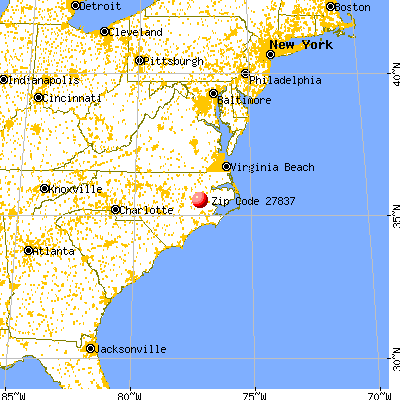
Nearest zip codes: 27858 ,
27879 ,
27817 ,
28513 ,
27884 ,
28590 .
Simpson Zip Code Map
Percentage of family households: This zip code:
54.3%North Carolina:
46.1%
Percentage of households with unmarried partners: This zip code:
7.5%North Carolina:
47.9%
No gay or lesbian households reported
Household received Food Stamps/SNAP in the past 12 months: 366Household did not receive Food Stamps/SNAP in the past 12 months: 2,114
Women who had a birth in the past 12 months: 5 (5 now married , 0 unmarried) Women who did not have a birth in the past 12 months: 1,250 (723 now married , 531 unmarried)
Housing units in zip code 27837 with a mortgage: 1,126 (42
second mortgage , 34
both second mortgage and home equity loan )
Houses without a mortgage: 96
Median monthly owner costs for units with a mortgage: $1,190
Median monthly owner costs for units without a mortgage: $408
Residents with income below the poverty level in 2022:
This zip code:
14.9%Whole state:
12.8%
Residents with income below 50% of the poverty level in 2022:
This zip code:
6.3%Whole state:
6.8%
Median number of rooms in houses and condos: Median number of rooms in apartments: Notable locations in this zip code not listed on our city pages
Click to draw/clear zip code borders Notable locations in zip code 27837: (A) , Voice of America (B) , Fire Department and Town Hall (C) . Display/hide their locations on the map
Churches in zip code 27837 include: (A) , White Oak Church (B) , Tabernacle Church (C) , First Born Church (D) , Pleasant Hill Church (E) , Holy Ghost Deliverance Church (F) , Grimesland Pentecostal Church (G) . Display/hide their locations on the map
Cemetery: (1) . Display/hide its location on the map
Lakes and swamps: (A) , Island Swamp (B) . Display/hide their locations on the map
Streams, rivers, and creeks: (A) , Bear Creek (B) , Cow Swamp (C) , Harding Swamp (D) , Juniper Branch (E) , Thorofare Swamp (F) , Island Swamp (G) , Pillippi Branch (H) . Display/hide their locations on the map
Year house built (houses)
25 2020 or later273 2010 to 2019876 2000 to 2009523 1990 to 1999506 1980 to 1989125 1970 to 1979170 1960 to 196947 1950 to 195951 1940 to 194924 1939 or earlier
Zip code 27837 household income distribution in 2022 176 Less than $10,00039 $10,000 to $14,99933 $15,000 to $19,99954 $20,000 to $24,999205 $25,000 to $29,999144 $30,000 to $34,99938 $35,000 to $39,999111 $40,000 to $44,999120 $45,000 to $49,999142 $50,000 to $59,999178 $60,000 to $74,999428 $75,000 to $99,999326 $100,000 to $124,99941 $125,000 to $149,999343 $150,000 to $199,99996 $200,000 or moreEstimate of home value of owner-occupied houses/condos in 2022 in zip code 27837 91 Less than $10,00014 $10,000 to $14,99963 $15,000 to $19,99911 $30,000 to $34,99928 $35,000 to $39,99934 $40,000 to $49,99958 $50,000 to $59,99918 $60,000 to $69,99968 $70,000 to $79,99935 $80,000 to $89,999115 $90,000 to $99,999175 $100,000 to $124,999113 $125,000 to $149,99989 $150,000 to $174,99999 $175,000 to $199,999199 $200,000 to $249,99967 $250,000 to $299,999232 $300,000 to $399,99993 $400,000 to $499,99934 $500,000 to $749,9999 $1,500,000 to $1,999,999Rent paid by renters in 2022 in zip code 27837 6 Less than $1004 $150 to $19950 $350 to $39929 $400 to $4494 $450 to $499170 $500 to $54975 $550 to $59920 $600 to $6497 $650 to $69942 $800 to $89912 $900 to $999125 No cash rent
Median gross rent in 2022: $757.
Estimated median house (or condo) value in 2022 for: White Non-Hispanic householders: $202,935Black or African American householders: $155,833Two or more races householders: $199,185Hispanic or Latino householders: $380,796Estimated median house or condo value in 2022: $159,114
27837:
$159,114North Carolina:
$280,600
Lower value quartile - upper value quartile: $105,892 - $264,915
Mean price in 2022: Detached houses: $232,732Here:
$232,732State:
$375,326
Mobile homes: $67,459Here:
$67,459State:
$124,933
Housing units in structures:
One, detached: 1,733Two: 43 or 4: 810 to 19: 1Mobile homes: 872Unemployment : 2.9%
Means of transportation to work in zip code 27837 69.3% 2,036 Drove a car alone18.1% 532 Carpooled1.3% 38 Other means9.5% 278 Worked at homeTravel time to work (commute) in zip code 27837 5 Less than 5 minutes202 5 to 9 minutes265 10 to 14 minutes368 15 to 19 minutes558 20 to 24 minutes98 25 to 29 minutes363 30 to 34 minutes12 35 to 39 minutes100 40 to 44 minutes208 45 to 59 minutes341 60 to 89 minutes67 90 or more minutes
Percentage of zip code residents living and working in this county: 79.6%
Household type by relationship:
Households: 6,060
Male householders: 1,389 (267 living alone ), Female householders: 1,083 (136 living alone )1,422 spouses (1,408 opposite-sex spouses ), 122 unmarried partners , (122 opposite-sex unmarried partners ), 1,717 children (1,565 natural , 32 adopted , 121 stepchildren ), 146 grandchildren , 11 brothers or sisters , 77 parents , 0 foster children , 95 other relatives , 19 non-relatives
Size of family households: 978 2-persons , 383 3-persons , 415 4-persons , 176 5-persons , 70 7-or-more-persons
Size of nonfamily households: 403 1-person , 48 2-persons , 2 3-persons
953 married couples with children. single-parent households (44 men , 312 women ).
82.6% of residents of 27837 zip code speak English at home. of residents speak Spanish at home (66% very well, 8% well, 21% not well, 5% not at all ).of residents speak other Indo-European language at home (100% very well ).of residents speak Asian or Pacific Island language at home (57% very well, 36% well, 5% not well, 2% not at all ).
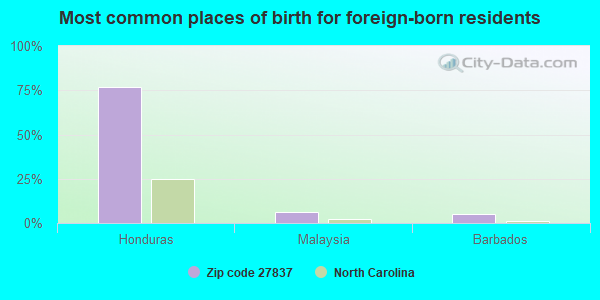
Foreign born population: 559 (9.2%)
(29.7%
of them are naturalized citizens )
This zip code:
9.2%Whole state:
8.6%
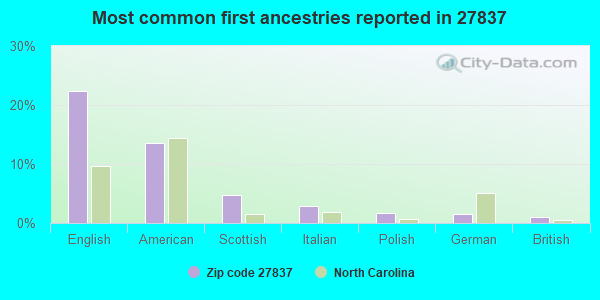
77% Honduras 6% Malaysia 5% Barbados 22% English 14% American 5% Scottish 3% Italian 2% Polish 1% German 1% British
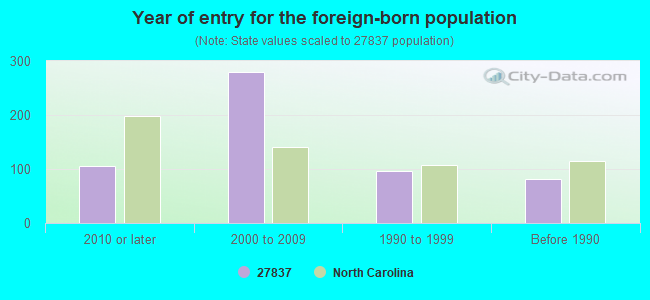
Year of entry for the foreign-born population
105 2010 or later 279 2000 to 2009 96 1990 to 1999 82 Before 1990
Facilities with environmental interests located in this zip code:
ANGEL, DAVID - RESIDENCE (302 ASH CIRCLE in GRIMESLAND, NC)
STATE MASTER (North Carolina facility info) - -115DA4YG00M29W84AX3YRF6B7Y, WASTEWATER FACILITY National Pollutant Discharge Elimination System NON-MAJOR (Tracking pollutant discharge elimination systems) - permit Business SIC classification: SEWERAGE SYSTEMSAlternative names: SANGMEISTER RESIDENCE
BANKS, TIMOTHY - RESIDENCE (2916 MAPLE CIRCLE in GRIMESLAND, NC)
STATE MASTER (North Carolina facility info) - -115DA4YG00M29W84AY3XGB7Q8B, WASTEWATER FACILITY National Pollutant Discharge Elimination System NON-MAJOR (Tracking pollutant discharge elimination systems) - permit Business SIC classification: SEWERAGE SYSTEMS
BLUE SKY LLC PIT #1 (NC HWY 33 in GRIMESLAND, NC)
National Pollutant Discharge Elimination System NON-MAJOR (Tracking pollutant discharge elimination systems) - permit Business SIC classification: CONSTRUCTION SAND AND GRAVEL
Housing units lacking complete plumbing facilities: 0.1%
Housing units lacking complete kitchen facilities: 0.1%
75.6% Electricity 13.8% Utility gas 10.4% Bottled, tank, or LP gas
Population in 1990: 6,998.
Place of birth for U.S.-born residents:
This state: 4,222Northeast: 176Midwest: 392South: 554West: 83
58% of the 27837 zip code residents lived in the same house 5 years ago.
Out of people who lived in different houses, 68% lived in this county.
Out of people who lived in different counties, 50% lived in North Carolina.
92% of the 27837 zip code residents lived in the same house 1 year ago.
Out of people who lived in different houses, 69% moved from this county.
Out of people who lived in different houses, 23% moved from different county within same state.
Out of people who lived in different houses, 4% moved from different state.
Private vs. public school enrollment:
Students in private schools in grades 1 to 8 (elementary and middle school): 186
Here:
22.4%North Carolina:
13.8%
Students in private schools in grades 9 to 12 (high school): 47
Here:
20.4%North Carolina:
11.9%
Students in private undergraduate colleges: 6
Here:
2.3%North Carolina:
19.3%
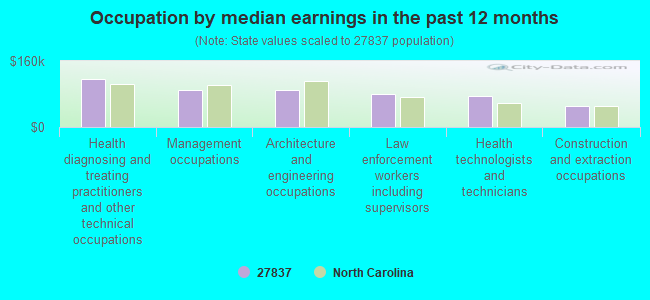
Occupation by median earnings in the past 12 months ($)
117,201 Health diagnosing and treating practitioners and other technical occupations 89,469 Management occupations 89,308 Architecture and engineering occupations 79,296 Law enforcement workers including supervisors 74,172 Health technologists and technicians 52,060 Construction and extraction occupations
Top industries in this zip code by the number of employees in 2005:
Construction: Electrical Contractors (10-19 employees: 1 establishment, 1-4 employees: 4 establishments)Construction: Plumbing, Heating, and Air-Conditioning Contractors (10-19: 1)Construction: Painting and Wall Covering Contractors (10-19: 1)Wholesale Trade: Industrial Machinery and Equipment Merchant Wholesalers (10-19: 1)Administrative and Support and Waste Management and Remediation Services: Landscaping Services (5-9: 1, 1-4: 2)Construction: New Single-Family Housing Construction (except Operative Builders) (1-4: 4)Administrative and Support and Waste Management and Remediation Services: Repossession Services (5-9: 1)Wholesale Trade: Farm Supplies Merchant Wholesalers (5-9: 1)Real Estate and Rental and Leasing: Lessors of Residential Buildings and Dwellings (5-9: 1)
Fatal accident statistics in 2013:
Fatal accident count: 1Vehicles involved in fatal accidents: 1Fatal accidents caused by drunken drivers: 0Fatalities: 1Persons involved in fatal accidents: 2Pedestrians involved in fatal accidents: 1
Fatal accident statistics in 2012:
Fatal accident count: 1Vehicles involved in fatal accidents: 1Fatal accidents caused by drunken drivers: 1Fatalities: 1Persons involved in fatal accidents: 2Pedestrians involved in fatal accidents: 0
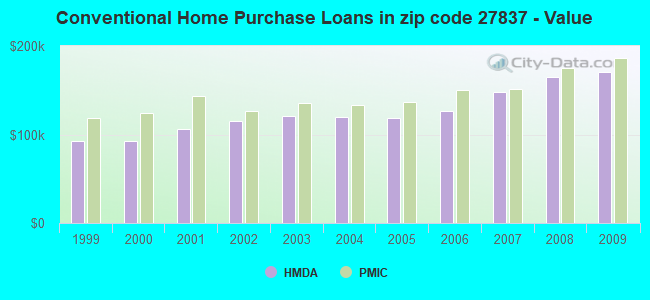
Home Mortgage Disclosure Act Aggregated Statistics For Year 2009(Based on 6 partial tracts) A) FHA, FSA/RHS & VA B) Conventional C) Refinancings D) Home Improvement Loans E) Loans on Dwellings For 5+ Families F) Non-occupant Loans on G) Loans On Manufactured Number Average Value Number Average Value Number Average Value Number Average Value Number Average Value Number Average Value Number Average Value
LOANS ORIGINATED 132 $161,736 141 $170,314 581 $168,322 24 $91,055 1 $1,894,200 47 $138,371 12 $64,879 APPLICATIONS APPROVED, NOT ACCEPTED 3 $76,870 5 $173,404 18 $154,939 2 $60,435 0 $0 3 $179,910 3 $63,947 APPLICATIONS DENIED 18 $178,073 19 $118,871 144 $165,000 12 $44,936 0 $0 9 $101,527 9 $51,781 APPLICATIONS WITHDRAWN 11 $178,339 11 $210,499 104 $163,723 1 $16,810 0 $0 4 $218,322 1 $40,530 FILES CLOSED FOR INCOMPLETENESS 1 $279,990 3 $180,340 27 $155,346 2 $79,090 0 $0 2 $183,795 1 $129,890
Aggregated Statistics For Year 2008(Based on 6 partial tracts) A) FHA, FSA/RHS & VA B) Conventional C) Refinancings D) Home Improvement Loans E) Loans on Dwellings For 5+ Families F) Non-occupant Loans on G) Loans On Manufactured Number Average Value Number Average Value Number Average Value Number Average Value Number Average Value Number Average Value Number Average Value
LOANS ORIGINATED 96 $152,068 230 $164,718 333 $156,330 24 $64,487 0 $0 65 $121,070 27 $69,958 APPLICATIONS APPROVED, NOT ACCEPTED 4 $121,562 16 $112,689 54 $126,379 3 $87,593 0 $0 9 $202,978 7 $79,697 APPLICATIONS DENIED 11 $123,839 37 $130,440 177 $131,055 27 $47,665 0 $0 8 $161,676 22 $88,854 APPLICATIONS WITHDRAWN 18 $170,829 33 $166,653 74 $164,247 6 $114,950 1 $31,670,790 5 $116,388 2 $69,235 FILES CLOSED FOR INCOMPLETENESS 2 $110,680 3 $222,690 18 $125,287 0 $0 0 $0 0 $0 0 $0
Aggregated Statistics For Year 2007(Based on 6 partial tracts) A) FHA, FSA/RHS & VA B) Conventional C) Refinancings D) Home Improvement Loans E) Loans on Dwellings For 5+ Families F) Non-occupant Loans on G) Loans On Manufactured Number Average Value Number Average Value Number Average Value Number Average Value Number Average Value Number Average Value Number Average Value
LOANS ORIGINATED 65 $144,842 402 $147,848 312 $127,870 44 $46,350 5 $337,996 74 $128,978 29 $58,974 APPLICATIONS APPROVED, NOT ACCEPTED 1 $226,950 49 $117,159 76 $109,257 14 $33,654 0 $0 9 $133,677 7 $60,136 APPLICATIONS DENIED 6 $131,248 58 $120,206 252 $128,603 31 $38,853 0 $0 9 $119,817 41 $60,573 APPLICATIONS WITHDRAWN 6 $109,470 38 $176,065 84 $132,771 11 $74,055 0 $0 5 $93,528 5 $51,442 FILES CLOSED FOR INCOMPLETENESS 1 $120,610 15 $161,989 18 $144,861 5 $41,702 0 $0 4 $95,692 0 $0
Aggregated Statistics For Year 2006(Based on 6 partial tracts) A) FHA, FSA/RHS & VA B) Conventional C) Refinancings D) Home Improvement Loans F) Non-occupant Loans on G) Loans On Manufactured Number Average Value Number Average Value Number Average Value Number Average Value Number Average Value Number Average Value
LOANS ORIGINATED 49 $138,619 536 $126,543 328 $120,314 54 $41,853 99 $135,345 24 $67,276 APPLICATIONS APPROVED, NOT ACCEPTED 2 $131,505 49 $94,342 73 $93,394 13 $44,745 3 $73,327 15 $38,086 APPLICATIONS DENIED 3 $128,470 92 $91,642 219 $112,968 64 $56,580 19 $94,540 42 $61,290 APPLICATIONS WITHDRAWN 2 $144,335 63 $134,483 98 $162,433 13 $98,776 10 $132,988 4 $58,235 FILES CLOSED FOR INCOMPLETENESS 0 $0 7 $148,359 30 $189,417 1 $10,820 1 $124,650 1 $200,690
Aggregated Statistics For Year 2005(Based on 6 partial tracts) A) FHA, FSA/RHS & VA B) Conventional C) Refinancings D) Home Improvement Loans E) Loans on Dwellings For 5+ Families F) Non-occupant Loans on G) Loans On Manufactured Number Average Value Number Average Value Number Average Value Number Average Value Number Average Value Number Average Value Number Average Value
LOANS ORIGINATED 62 $130,655 524 $118,876 341 $109,832 49 $53,315 1 $173,990 101 $93,960 28 $50,520 APPLICATIONS APPROVED, NOT ACCEPTED 2 $152,245 33 $107,132 54 $112,183 3 $57,687 0 $0 0 $0 9 $60,700 APPLICATIONS DENIED 8 $91,831 89 $92,394 233 $124,815 54 $61,781 0 $0 10 $96,775 62 $55,059 APPLICATIONS WITHDRAWN 4 $128,298 51 $135,553 104 $130,849 18 $96,340 0 $0 8 $141,585 7 $57,756 FILES CLOSED FOR INCOMPLETENESS 0 $0 11 $76,807 25 $144,042 4 $66,948 0 $0 2 $92,645 2 $58,320
Aggregated Statistics For Year 2004(Based on 6 partial tracts) A) FHA, FSA/RHS & VA B) Conventional C) Refinancings D) Home Improvement Loans F) Non-occupant Loans on G) Loans On Manufactured Number Average Value Number Average Value Number Average Value Number Average Value Number Average Value Number Average Value
LOANS ORIGINATED 47 $123,352 437 $120,216 341 $121,610 32 $25,558 74 $93,093 44 $52,425 APPLICATIONS APPROVED, NOT ACCEPTED 2 $76,405 23 $100,416 47 $113,983 9 $47,734 3 $93,497 17 $47,310 APPLICATIONS DENIED 12 $86,583 79 $93,170 223 $98,927 51 $47,215 11 $101,392 76 $58,145 APPLICATIONS WITHDRAWN 4 $125,518 46 $114,004 111 $107,357 12 $66,743 5 $89,926 14 $73,924 FILES CLOSED FOR INCOMPLETENESS 1 $114,730 7 $121,511 25 $132,173 2 $20,945 3 $59,507 3 $75,137
Aggregated Statistics For Year 2003(Based on 6 partial tracts) A) FHA, FSA/RHS & VA B) Conventional C) Refinancings D) Home Improvement Loans E) Loans on Dwellings For 5+ Families F) Non-occupant Loans on Number Average Value Number Average Value Number Average Value Number Average Value Number Average Value Number Average Value
LOANS ORIGINATED 63 $124,111 347 $120,387 862 $117,585 30 $22,295 5 $708,150 50 $83,665 APPLICATIONS APPROVED, NOT ACCEPTED 1 $166,080 26 $97,288 84 $108,858 5 $34,094 0 $0 2 $81,515 APPLICATIONS DENIED 4 $71,838 50 $86,133 248 $103,852 21 $20,330 0 $0 10 $60,898 APPLICATIONS WITHDRAWN 8 $95,380 30 $117,216 150 $108,037 7 $31,251 0 $0 6 $79,472 FILES CLOSED FOR INCOMPLETENESS 2 $131,980 5 $95,460 19 $115,231 0 $0 0 $0 2 $60,205
Aggregated Statistics For Year 2002(Based on 6 partial tracts) A) FHA, FSA/RHS & VA B) Conventional C) Refinancings D) Home Improvement Loans E) Loans on Dwellings For 5+ Families F) Non-occupant Loans on Number Average Value Number Average Value Number Average Value Number Average Value Number Average Value Number Average Value
LOANS ORIGINATED 51 $117,805 296 $115,611 556 $115,073 15 $33,587 1 $1,661,840 45 $85,601 APPLICATIONS APPROVED, NOT ACCEPTED 3 $99,470 52 $79,638 65 $94,148 3 $29,223 0 $0 2 $73,155 APPLICATIONS DENIED 4 $155,325 122 $53,231 188 $81,608 22 $31,486 0 $0 6 $65,148 APPLICATIONS WITHDRAWN 4 $120,530 26 $186,352 111 $99,854 5 $26,032 0 $0 1 $66,240 FILES CLOSED FOR INCOMPLETENESS 0 $0 2 $54,425 21 $126,946 1 $74,140 0 $0 1 $101,630
Aggregated Statistics For Year 2001(Based on 6 partial tracts) A) FHA, FSA/RHS & VA B) Conventional C) Refinancings D) Home Improvement Loans F) Non-occupant Loans on Number Average Value Number Average Value Number Average Value Number Average Value Number Average Value
LOANS ORIGINATED 70 $111,533 271 $105,831 459 $106,612 33 $15,185 47 $80,127 APPLICATIONS APPROVED, NOT ACCEPTED 3 $122,203 57 $49,545 48 $80,762 7 $21,236 4 $26,028 APPLICATIONS DENIED 4 $93,160 146 $53,716 160 $83,620 35 $20,558 9 $54,538 APPLICATIONS WITHDRAWN 2 $103,830 20 $96,466 74 $84,263 8 $39,276 3 $119,950 FILES CLOSED FOR INCOMPLETENESS 0 $0 2 $140,290 27 $83,657 0 $0 2 $67,620
Aggregated Statistics For Year 2000(Based on 6 partial tracts) A) FHA, FSA/RHS & VA B) Conventional C) Refinancings D) Home Improvement Loans F) Non-occupant Loans on Number Average Value Number Average Value Number Average Value Number Average Value Number Average Value
LOANS ORIGINATED 67 $101,151 306 $92,973 117 $89,437 20 $19,412 22 $81,439 APPLICATIONS APPROVED, NOT ACCEPTED 12 $47,985 80 $55,410 42 $72,471 7 $23,726 8 $74,289 APPLICATIONS DENIED 22 $60,050 215 $44,836 124 $64,050 21 $20,454 9 $39,611 APPLICATIONS WITHDRAWN 5 $57,432 15 $145,953 60 $83,271 6 $38,655 2 $15,325 FILES CLOSED FOR INCOMPLETENESS 1 $73,160 5 $113,792 11 $74,917 0 $0 0 $0
Aggregated Statistics For Year 1999(Based on 3 partial tracts) A) FHA, FSA/RHS & VA B) Conventional C) Refinancings D) Home Improvement Loans F) Non-occupant Loans on Number Average Value Number Average Value Number Average Value Number Average Value Number Average Value
LOANS ORIGINATED 35 $95,352 175 $93,033 116 $97,742 9 $28,124 17 $77,471 APPLICATIONS APPROVED, NOT ACCEPTED 0 $0 32 $56,838 27 $55,210 2 $13,650 1 $61,640 APPLICATIONS DENIED 2 $74,845 123 $50,338 78 $77,478 8 $16,040 4 $60,738 APPLICATIONS WITHDRAWN 0 $0 10 $102,713 38 $72,535 2 $69,875 2 $68,030 FILES CLOSED FOR INCOMPLETENESS 0 $0 3 $68,300 14 $73,561 0 $0 0 $0
Detailed HMDA statistics for the following Tracts:
0010.00
,
0011.00 ,
0012.00
Private Mortgage Insurance Companies Aggregated Statistics For Year 2009(Based on 6 partial tracts) A) Conventional B) Refinancings C) Non-occupant Loans on Number Average Value Number Average Value Number Average Value
LOANS ORIGINATED 24 $186,655 27 $195,618 1 $285,450 APPLICATIONS APPROVED, NOT ACCEPTED 2 $175,950 4 $252,915 0 $0 APPLICATIONS DENIED 2 $310,225 6 $297,238 0 $0 APPLICATIONS WITHDRAWN 0 $0 0 $0 0 $0 FILES CLOSED FOR INCOMPLETENESS 1 $111,710 0 $0 0 $0
Aggregated Statistics For Year 2008(Based on 6 partial tracts) A) Conventional B) Refinancings C) Non-occupant Loans on Number Average Value Number Average Value Number Average Value
LOANS ORIGINATED 53 $174,652 34 $173,858 7 $143,159 APPLICATIONS APPROVED, NOT ACCEPTED 11 $152,864 7 $185,381 0 $0 APPLICATIONS DENIED 0 $0 0 $0 0 $0 APPLICATIONS WITHDRAWN 3 $179,927 0 $0 0 $0 FILES CLOSED FOR INCOMPLETENESS 3 $156,573 0 $0 1 $110,720
Aggregated Statistics For Year 2007(Based on 6 partial tracts) A) Conventional B) Refinancings C) Non-occupant Loans on Number Average Value Number Average Value Number Average Value
LOANS ORIGINATED 98 $151,935 34 $146,469 8 $112,269 APPLICATIONS APPROVED, NOT ACCEPTED 10 $195,103 3 $246,160 1 $186,420 APPLICATIONS DENIED 2 $108,250 3 $172,607 0 $0 APPLICATIONS WITHDRAWN 3 $251,010 1 $182,930 0 $0 FILES CLOSED FOR INCOMPLETENESS 2 $157,735 0 $0 0 $0
Aggregated Statistics For Year 2006(Based on 6 partial tracts) A) Conventional B) Refinancings C) Non-occupant Loans on D) Loans On Manufactured Number Average Value Number Average Value Number Average Value Number Average Value
LOANS ORIGINATED 65 $150,409 18 $144,626 6 $79,672 1 $89,840 APPLICATIONS APPROVED, NOT ACCEPTED 7 $110,547 4 $96,605 4 $70,518 0 $0 APPLICATIONS DENIED 0 $0 1 $180,760 0 $0 0 $0 APPLICATIONS WITHDRAWN 4 $165,372 2 $152,660 0 $0 0 $0 FILES CLOSED FOR INCOMPLETENESS 0 $0 0 $0 0 $0 0 $0
Aggregated Statistics For Year 2005(Based on 6 partial tracts) A) Conventional B) Refinancings C) Non-occupant Loans on D) Loans On Manufactured Number Average Value Number Average Value Number Average Value Number Average Value
LOANS ORIGINATED 67 $137,275 25 $149,221 6 $124,422 1 $72,520 APPLICATIONS APPROVED, NOT ACCEPTED 6 $163,372 5 $146,836 0 $0 1 $58,370 APPLICATIONS DENIED 0 $0 0 $0 0 $0 0 $0 APPLICATIONS WITHDRAWN 3 $157,080 2 $188,500 0 $0 0 $0 FILES CLOSED FOR INCOMPLETENESS 1 $130,970 4 $177,812 0 $0 0 $0
Aggregated Statistics For Year 2004(Based on 6 partial tracts) A) Conventional B) Refinancings C) Non-occupant Loans on D) Loans On Manufactured Number Average Value Number Average Value Number Average Value Number Average Value
LOANS ORIGINATED 70 $133,580 32 $145,326 9 $114,883 6 $54,898 APPLICATIONS APPROVED, NOT ACCEPTED 9 $127,982 15 $147,404 2 $185,885 1 $74,440 APPLICATIONS DENIED 0 $0 2 $147,715 1 $91,940 0 $0 APPLICATIONS WITHDRAWN 4 $158,532 7 $153,267 1 $69,200 0 $0 FILES CLOSED FOR INCOMPLETENESS 0 $0 2 $159,660 0 $0 0 $0
Aggregated Statistics For Year 2003(Based on 6 partial tracts) A) Conventional B) Refinancings C) Non-occupant Loans on Number Average Value Number Average Value Number Average Value
LOANS ORIGINATED 55 $135,528 103 $129,678 1 $88,010 APPLICATIONS APPROVED, NOT ACCEPTED 4 $141,485 19 $165,566 1 $64,260 APPLICATIONS DENIED 0 $0 1 $186,980 0 $0 APPLICATIONS WITHDRAWN 2 $96,510 8 $144,234 1 $76,120 FILES CLOSED FOR INCOMPLETENESS 0 $0 0 $0 0 $0
Aggregated Statistics For Year 2002(Based on 6 partial tracts) A) Conventional B) Refinancings C) Non-occupant Loans on Number Average Value Number Average Value Number Average Value
LOANS ORIGINATED 84 $126,811 86 $124,260 6 $103,143 APPLICATIONS APPROVED, NOT ACCEPTED 9 $184,091 16 $118,035 0 $0 APPLICATIONS DENIED 1 $115,670 1 $109,900 0 $0 APPLICATIONS WITHDRAWN 1 $218,620 6 $106,497 0 $0 FILES CLOSED FOR INCOMPLETENESS 0 $0 1 $84,030 0 $0
Aggregated Statistics For Year 2001(Based on 6 partial tracts) A) Conventional B) Refinancings C) Non-occupant Loans on Number Average Value Number Average Value Number Average Value
LOANS ORIGINATED 67 $143,599 62 $123,808 2 $102,550 APPLICATIONS APPROVED, NOT ACCEPTED 7 $139,011 6 $152,583 1 $45,480 APPLICATIONS DENIED 2 $136,580 11 $90,844 2 $111,695 APPLICATIONS WITHDRAWN 0 $0 0 $0 0 $0 FILES CLOSED FOR INCOMPLETENESS 1 $182,890 1 $150,450 0 $0
Aggregated Statistics For Year 2000(Based on 6 partial tracts) A) Conventional B) Refinancings C) Non-occupant Loans on Number Average Value Number Average Value Number Average Value
LOANS ORIGINATED 59 $123,795 7 $118,664 2 $137,910 APPLICATIONS APPROVED, NOT ACCEPTED 4 $79,335 6 $123,740 0 $0 APPLICATIONS DENIED 2 $125,060 1 $90,920 0 $0 APPLICATIONS WITHDRAWN 3 $113,457 0 $0 0 $0 FILES CLOSED FOR INCOMPLETENESS 1 $228,800 0 $0 0 $0
Aggregated Statistics For Year 1999(Based on 3 partial tracts) A) Conventional B) Refinancings C) Non-occupant Loans on Number Average Value Number Average Value Number Average Value
LOANS ORIGINATED 31 $118,628 9 $108,524 1 $23,770 APPLICATIONS APPROVED, NOT ACCEPTED 1 $157,030 1 $192,580 0 $0 APPLICATIONS DENIED 0 $0 0 $0 0 $0 APPLICATIONS WITHDRAWN 0 $0 0 $0 0 $0 FILES CLOSED FOR INCOMPLETENESS 0 $0 0 $0 0 $0
Detailed PMIC statistics for the following Tracts:
0010.00
,
0011.00 ,
0012.00
2004 - 2018 National Fire Incident Reporting System (NFIRS) incidents See full 2006 National Fire Incident Reporting System statistics for zip code 27837, North Carolina
Most common first names in zip code 27837 among deceased individuals Name Count Lived (average)
James 37 70.5 years William 29 69.7 years Mary 21 74.4 years John 18 68.6 years Willie 15 69.2 years Robert 14 71.9 years Charlie 11 68.4 years Jessie 10 80.5 years Dorothy 8 73.8 years Thomas 8 70.9 years
Most common last names in zip code 27837 among deceased individuals Last name Count Lived (average)
Smith 28 72.7 years Buck 22 74.0 years Elks 22 75.6 years Mills 21 73.4 years Wilson 18 67.7 years Dixon 16 73.9 years Hodges 15 77.0 years Hudson 15 81.1 years Jones 15 75.1 years Moore 15 72.5 years


+$538
-$3,231
 Nearest zip codes: 27858, 27879, 27817, 28513, 27884, 28590.
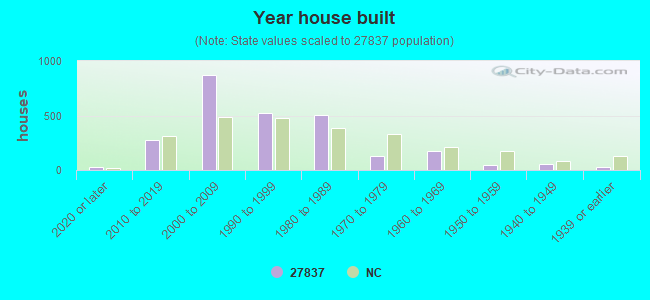


 Based on the data from the years 2004 - 2018 the average number of fire incidents per year is 18. The highest number of fire incidents - 37 took place in 2014, and the least - 4 in 2004. The data has a growing trend.
 When looking into fire subcategories, the most reports belonged to: Structure Fires (59.8%), and Outside Fires (31.2%).