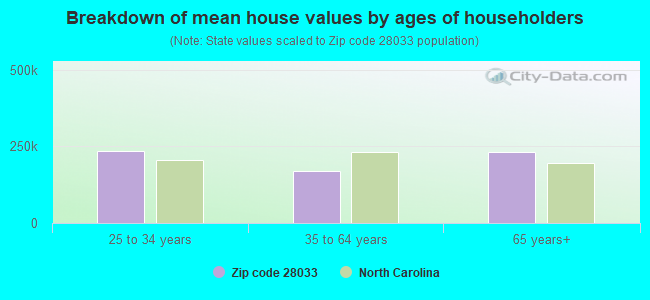
Estimated median house/condo value in 2022: $147,288
28033:
$147,288
North Carolina:
$280,600
According to our research of North Carolina and other state lists, there were 6 registered sex offenders living in 28033 zip code as of April 19, 2024. The ratio of all residents to sex offenders in zip code 28033 is 553 to 1. The ratio of registered sex offenders to all residents in this zip code is near the state average.
Median resident age:
This zip code:
43.4 years
North Carolina median age:
39.2 years
Average household size:
This zip code:
2.3 people
North Carolina:
2.4 people
Averages for the 2020 tax year for zip code 28033, filed in 2021:
Average Adjusted Gross Income (AGI) in 2020: $49,164 (Individual Income Tax Returns)
Here:
$49,164
State:
$70,020
Salary/wage: $44,951 (reported on 85.7% of returns)
Here:
$44,951
State:
$58,387
(% of AGI for various income ranges: 1183.7% for AGIs below $25k, 3745.5% for AGIs $25k-50k, 6294.7% for AGIs $50k-75k, 9398.0% for AGIs $75k-100k, 16984.0% for AGIs $100k-200k)
Taxable interest for individuals: $603 (reported on 21.4% of returns)
This zip code:
$603
North Carolina:
$1,479
(% of AGI for various income ranges: 8.7% for AGIs below $25k, 15.8% for AGIs $25k-50k, 12.4% for AGIs $50k-75k, 19.0% for AGIs $75k-100k, 56.0% for AGIs $100k-200k)
Ordinary dividends: $1,608 (reported on 8.6% of returns)
Here:
$1,608
State:
$7,888
(% of AGI for various income ranges: 14.5% for AGIs $25k-50k, 47.6% for AGIs $50k-75k, 64.0% for AGIs $100k-200k)
Net capital gain/loss in AGI: +$6,864 (reported on 7.9% of returns)
Here:
+$6,864
State:
+$23,652
(% of AGI for various income ranges: 4.2% for AGIs $25k-50k, 24.7% for AGIs $50k-75k, 118.0% for AGIs $75k-100k, 581.0% for AGIs $100k-200k)
Profit/loss from business: +$8,016 (reported on 13.6% of returns)
Here:
+$8,016
State:
+$11,710
(% of AGI for various income ranges: 68.2% for AGIs below $25k, 136.4% for AGIs $25k-50k, 345.0% for AGIs $75k-100k, 469.0% for AGIs $100k-200k)
Taxable individual retirement arrangement distribution: $17,533 (reported on 6.4% of returns)
28033:
$17,533
North Carolina:
$20,247
(% of AGI for various income ranges: 46.3% for AGIs below $25k, 63.0% for AGIs $25k-50k, 362.4% for AGIs $50k-75k, 578.0% for AGIs $100k-200k)
Total itemized deductions: $27,583 (reported on 4.3% of returns)
Here:
$27,583
State:
$34,549
(% of AGI for various income ranges: 185.5% for AGIs $25k-50k, 1043.0% for AGIs $100k-200k)
Charity contributions: $9,000 (reported on 2.9% of returns)
Here:
$9,000
State:
$13,360
(% of AGI for various income ranges: 360.0% for AGIs $100k-200k)
Taxes paid: $7,033 (reported on 4.3% of returns)
28033:
$7,033
State:
$7,586
(% of AGI for various income ranges: 39.4% for AGIs $25k-50k, 292.0% for AGIs $100k-200k)
Earned income credit: $2,241 (reported on 20.7% of returns)
Here:
$2,241
State:
$2,337
(% of AGI for various income ranges: 108.4% for AGIs below $25k, 72.1% for AGIs $25k-50k)
Percentage of individuals using paid preparers for their 2020 taxes: 95.0%
Here:
95%
State:
93%
(% for various income ranges: 95.7% for AGIs below $25k, 92.7% for AGIs $25k-50k, 95.5% for AGIs $50k-75k, 100.0% for AGIs $75k-100k, 94.1% for AGIs $100k-200k)
Averages for the 2012 tax year for zip code 28033, filed in 2013:
Average Adjusted Gross Income (AGI) in 2012: $40,202 (Individual Income Tax Returns)
Here:
$40,202
State:
$54,937
Salary/wage: $37,325 (reported on 87.5% of returns)
Here:
$37,325
State:
$46,336
(% of AGI for various income ranges: 78.6% for AGIs below $25k, 80.6% for AGIs $25k-50k, 79.7% for AGIs $50k-75k, 86.4% for AGIs $75k-100k, 81.3% for AGIs $100k-200k)
Taxable interest for individuals: $461 (reported on 25.8% of returns)
This zip code:
$461
North Carolina:
$1,298
(% of AGI for various income ranges: 0.7% for AGIs below $25k, 0.5% for AGIs $25k-50k, 0.2% for AGIs $50k-75k, 0.1% for AGIs $75k-100k, 0.1% for AGIs $100k-200k)
Ordinary dividends: $892 (reported on 10.0% of returns)
Here:
$892
State:
$6,213
(% of AGI for various income ranges: 0.2% for AGIs below $25k, 0.3% for AGIs $25k-50k, 0.3% for AGIs $50k-75k, 0.3% for AGIs $75k-100k)
Net capital gain/loss in AGI: +$33 (reported on 5.0% of returns)
Here:
+$33
State:
+$12,740
Profit/loss from business: +$7,356 (reported on 13.3% of returns)
Here:
+$7,356
State:
+$10,311
(% of AGI for various income ranges: 7.1% for AGIs below $25k, 2.2% for AGIs $25k-50k, 3.0% for AGIs $50k-75k, 1.3% for AGIs $75k-100k)
Taxable individual retirement arrangement distribution: $10,367 (reported on 7.5% of returns)
28033:
$10,367
North Carolina:
$15,575
(% of AGI for various income ranges: 2.4% for AGIs below $25k, 2.0% for AGIs $25k-50k, 4.6% for AGIs $50k-75k)
Total itemized deductions: $16,765 (24% of AGI, reported on 28.3% of returns)
Here:
$16,765
State:
$23,438
Here:
24.3% of AGI
State:
21.5% of AGI
(% of AGI for various income ranges: 6.0% for AGIs below $25k, 10.0% for AGIs $25k-50k, 11.2% for AGIs $50k-75k, 14.7% for AGIs $75k-100k, 16.3% for AGIs $100k-200k)
Charity contributions: $3,422 (reported on 22.5% of returns)
Here:
$3,422
State:
$4,687
(% of AGI for various income ranges: 0.7% for AGIs below $25k, 1.5% for AGIs $25k-50k, 1.6% for AGIs $50k-75k, 2.4% for AGIs $75k-100k, 3.3% for AGIs $100k-200k)
Taxes paid: $5,247 (reported on 28.3% of returns)
28033:
$5,247
State:
$8,823
(% of AGI for various income ranges: 1.1% for AGIs below $25k, 2.1% for AGIs $25k-50k, 3.2% for AGIs $50k-75k, 5.1% for AGIs $75k-100k, 6.8% for AGIs $100k-200k)
Earned income credit: $2,404 (reported on 23.3% of returns)
Here:
$2,404
State:
$2,376
(% of AGI for various income ranges: 7.6% for AGIs below $25k, 1.5% for AGIs $25k-50k)
Percentage of individuals using paid preparers for their 2012 taxes: 62.5%
Here:
62%
State:
53%
(% for various income ranges: 57.1% for AGIs below $25k, 70.6% for AGIs $25k-50k, 63.2% for AGIs $50k-75k, 60.0% for AGIs $75k-100k, 62.5% for AGIs $100k-200k)
Averages for the 2004 tax year for zip code 28033, filed in 2005:
Average Adjusted Gross Income (AGI) in 2004: $34,460 (Individual Income Tax Returns)
Here:
$34,460
State:
$45,376
Salary/wage: $33,376 (reported on 89.5% of returns)
Here:
$33,376
State:
$39,442
(% of AGI for various income ranges: 90.1% for AGIs below $10k, 82.0% for AGIs $10k-25k, 87.4% for AGIs $25k-50k, 88.6% for AGIs $50k-75k, 90.5% for AGIs $75k-100k, 78.6% for AGIs over 100k)
Taxable interest for individuals: $656 (reported on 33.0% of returns)
This zip code:
$656
North Carolina:
$1,515
(% of AGI for various income ranges: 1.6% for AGIs below $10k, 1.3% for AGIs $10k-25k, 0.7% for AGIs $25k-50k, 0.4% for AGIs $50k-75k, 0.3% for AGIs $75k-100k, 0.3% for AGIs over 100k)
Taxable dividends: $672 (reported on 11.3% of returns)
Here:
$672
State:
$4,016
(% of AGI for various income ranges: 0.4% for AGIs $10k-25k, 0.1% for AGIs $25k-50k, 0.2% for AGIs $50k-75k, 0.2% for AGIs $75k-100k, 0.5% for AGIs over 100k)
Net capital gain/loss: +$5,770 (reported on 6.5% of returns)
Here:
+$5,770
State:
+$11,152
(% of AGI for various income ranges: 0.1% for AGIs $10k-25k, 0.3% for AGIs $25k-50k, 1.1% for AGIs $50k-75k, 7.7% for AGIs over 100k)
Profit/loss from business: +$4,364 (reported on 14.3% of returns)
Here:
+$4,364
State:
+$9,490
(% of AGI for various income ranges: 6.9% for AGIs below $10k, 5.6% for AGIs $10k-25k, 1.2% for AGIs $25k-50k, 1.5% for AGIs $50k-75k, -0.0% for AGIs $75k-100k)
IRA payment deduction: $2,353 (reported on 1.5% of returns)
28033:
$2,353
North Carolina:
$2,967
Total itemized deductions: $14,132 (26% of AGI, reported on 32.7% of returns)
Here:
$14,132
State:
$19,464
Here:
25.8% of AGI
State:
22.7% of AGI
(% of AGI for various income ranges: 14.5% for AGIs below $10k, 8.5% for AGIs $10k-25k, 12.5% for AGIs $25k-50k, 14.4% for AGIs $50k-75k, 17.6% for AGIs $75k-100k, 14.9% for AGIs over 100k)
Charity contributions deductions: $2,757 (5% of AGI, reported on 26.5% of returns)
Here:
$2,757
State:
$4,035
Here:
4.7% of AGI
State:
4.5% of AGI
(% of AGI for various income ranges: 1.0% for AGIs $10k-25k, 1.7% for AGIs $25k-50k, 2.5% for AGIs $50k-75k, 3.1% for AGIs $75k-100k, 3.3% for AGIs over 100k)
Total tax: $3,448 (reported on 70.6% of returns)
28033:
$3,448
State:
$7,257
(% of AGI for various income ranges: 2.1% for AGIs below $10k, 3.5% for AGIs $10k-25k, 5.3% for AGIs $25k-50k, 7.7% for AGIs $50k-75k, 9.9% for AGIs $75k-100k, 14.2% for AGIs over 100k)
Earned income credit: $1,753 (reported on 21.7% of returns)
Here:
$1,753
State:
$1,851
Percentage of individuals using paid preparers for their 2004 taxes: 71.8%
Here:
72%
State:
62%
(% for various income ranges: 65.0% for AGIs below $10k, 78.1% for AGIs $10k-25k, 73.3% for AGIs $25k-50k, 68.4% for AGIs $50k-75k, 59.4% for AGIs $75k-100k, 75.0% for AGIs over 100k)
Household received Food Stamps/SNAP in the past 12 months: 194 Household did not receive Food Stamps/SNAP in the past 12 months: 1,003
Women who had a birth in the past 12 months: 25 (26 now married, 0 unmarried) Women who did not have a birth in the past 12 months: 420 (235 now married, 186 unmarried)
Housing units in zip code 28033 with a mortgage: 472 (10 second mortgage, 11 both second mortgage and home equity loan) Residents with income below the poverty level in 2022:
This zip code:
10.5%
Whole state:
12.8%
Residents with income below 50% of the poverty level in 2022:
This zip code:
8.9%
Whole state:
6.8%
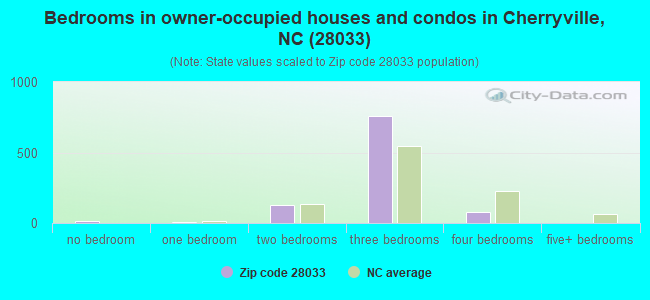
Median number of rooms in houses and condos:
Here:
5.9
State:
6.4
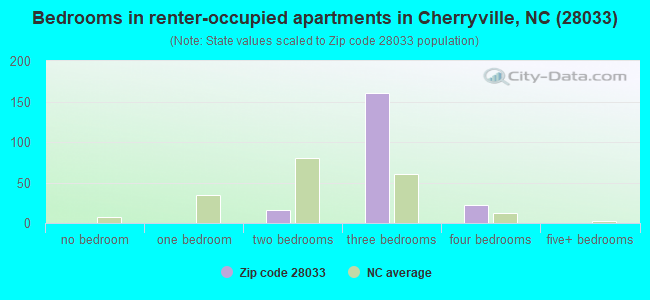
Median number of rooms in apartments:
Here:
5.2
State:
4.4
Notable locations in this zip code not listed on our city pages
Size of family households: 316 2-persons, 178 3-persons, 93 4-persons, 67 5-persons, 45 7-or-more-persons
Size of nonfamily households: 418 1-person, 78 2-persons
429 married couples with children.
86 single-parent households (86 women).
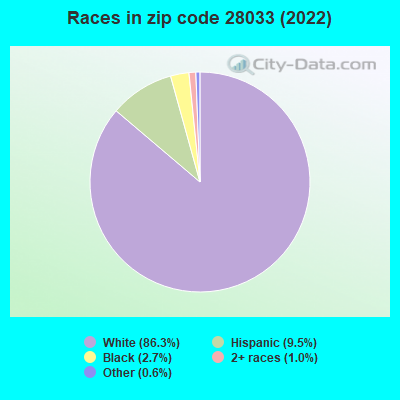
92.9% of residents of 28033 zip code speak English at home.
5.6% of residents speak Spanish at home (59% very well, 41% well).
0.6% of residents speak other Indo-European language at home (100% very well).
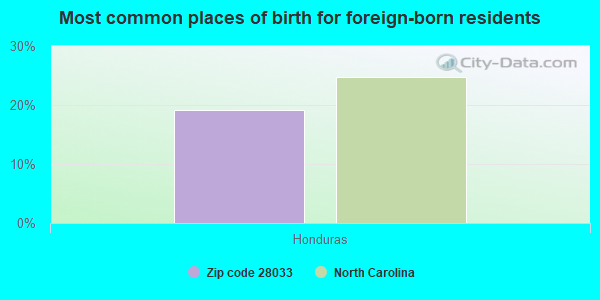
Foreign born population: 55 (2.0%) (100.0% of them are naturalized citizens)
This zip code:
2.0%
Whole state:
8.6%
19%Honduras
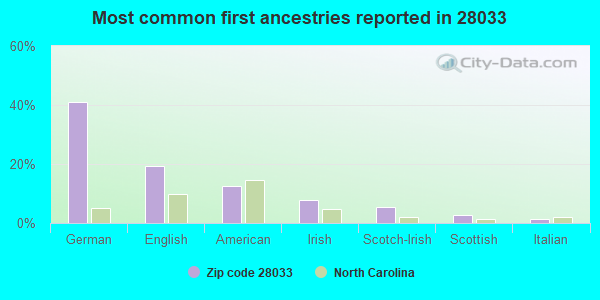
41%German
19%English
12%American
8%Irish
5%Scotch-Irish
3%Scottish
1%Italian
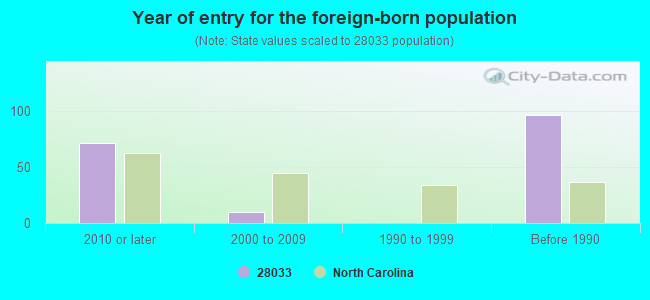
Year of entry for the foreign-born population
712010 or later
102000 to 2009
01990 to 1999
96Before 1990
Housing units lacking complete kitchen facilities: 1.9%
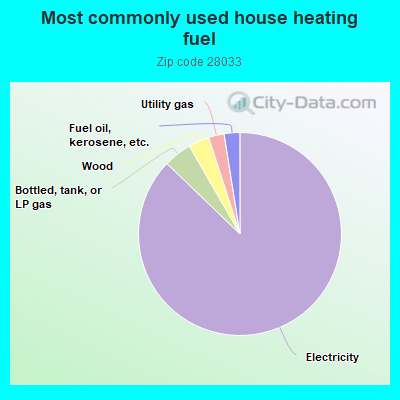
87.3%Electricity
4.5%Bottled, tank, or LP gas
3.3%Wood
2.5%Utility gas
2.5%Fuel oil, kerosene, etc.
Population in 1990: 5,431.
Place of birth for U.S.-born residents:
This state: 1,917
Northeast: 202
Midwest: 31
South: 449
64% of the 28033 zip code residents lived in the same house 5 years ago. Out of people who lived in different houses, 53% lived in this county. Out of people who lived in different counties, 50% lived in North Carolina.
97% of the 28033 zip code residents lived in the same house 1 year ago. Out of people who lived in different houses, 132% moved from different county within same state.
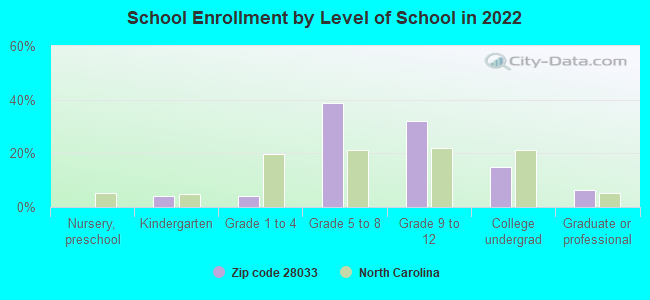
Private vs. public school enrollment:
Students in private schools in grades 1 to 8 (elementary and middle school):
Here:
0.0%
North Carolina:
13.8%
Students in private schools in grades 9 to 12 (high school): 14
Here:
10.0%
North Carolina:
11.9%
Students in private undergraduate colleges: 14
Here:
21.0%
North Carolina:
19.3%
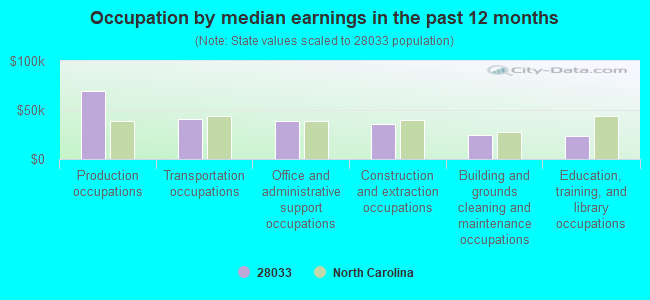
Occupation by median earnings in the past 12 months ($)
69,042Production occupations
40,805Transportation occupations
39,270Office and administrative support occupations
35,638Construction and extraction occupations
24,052Building and grounds cleaning and maintenance occupations
23,777Education, training, and library occupations
Top industries in this zip code by the number of employees in 2005:
Utilities: Electric Power Distribution (50-99 employees: 1 establishment)
Health Care and Social Assistance: Other Individual and Family Services (10-19: 1)
Construction: Plumbing, Heating, and Air-Conditioning Contractors (1-4: 2)
Other Services (except Public Administration): Religious Organizations (1-4: 2)
Construction: Electrical Contractors (1-4: 2)
Finance and Insurance: Securities Brokerage (1-4: 1)
Fatal accident statistics in 2014:
Fatal accident count: 1
Vehicles involved in fatal accidents: 1
Fatal accidents caused by drunken drivers: 0
Fatalities: 1
Persons involved in fatal accidents: 3
Pedestrians involved in fatal accidents: 0
Fatal accident statistics in 2013:
Fatal accident count: 1
Vehicles involved in fatal accidents: 1
Fatal accidents caused by drunken drivers: 1
Fatalities: 1
Persons involved in fatal accidents: 1
Pedestrians involved in fatal accidents: 0
Home Mortgage Disclosure Act Aggregated Statistics For Year 2003 (Based on 2 partial tracts)
A) FHA, FSA/RHS & VA Home Purchase Loans
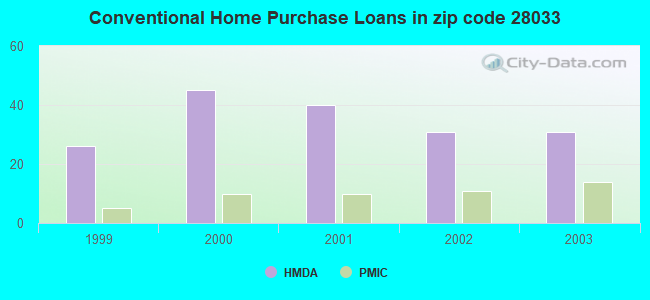
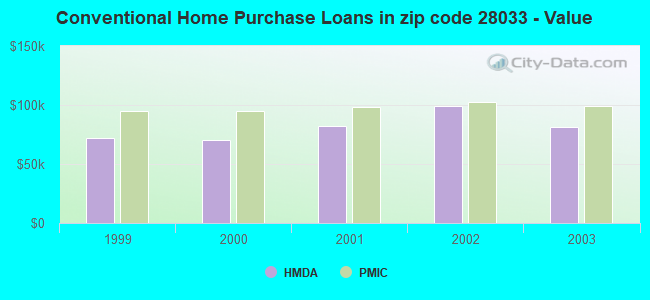
B) Conventional Home Purchase Loans
C) Refinancings
D) Home Improvement Loans
F) Non-occupant Loans on < 5 Family Dwellings (A B C & D)
Number
Average Value
Number
Average Value
Number
Average Value
Number
Average Value
Number
Average Value
LOANS ORIGINATED
5
$99,764
31
$81,715
109
$88,438
3
$8,133
12
$53,994
APPLICATIONS APPROVED, NOT ACCEPTED
1
$36,870
3
$107,173
13
$89,713
1
$6,510
1
$73,200
APPLICATIONS DENIED
1
$121,450
18
$85,126
43
$79,779
6
$17,260
1
$48,260
APPLICATIONS WITHDRAWN
0
$0
7
$117,890
12
$91,135
0
$0
1
$118,200
FILES CLOSED FOR INCOMPLETENESS
0
$0
1
$201,160
5
$90,656
1
$13,560
0
$0
Aggregated Statistics For Year 2002 (Based on 2 partial tracts)
A) FHA, FSA/RHS & VA Home Purchase Loans
B) Conventional Home Purchase Loans
C) Refinancings
D) Home Improvement Loans
F) Non-occupant Loans on < 5 Family Dwellings (A B C & D)
Number
Average Value
Number
Average Value
Number
Average Value
Number
Average Value
Number
Average Value
LOANS ORIGINATED
10
$110,392
31
$99,135
92
$81,501
4
$15,182
7
$52,980
APPLICATIONS APPROVED, NOT ACCEPTED
0
$0
3
$108,800
20
$74,770
2
$12,200
1
$10,840
APPLICATIONS DENIED
2
$82,955
14
$82,299
49
$82,038
3
$14,820
1
$31,990
APPLICATIONS WITHDRAWN
2
$73,470
4
$123,080
17
$85,731
0
$0
0
$0
FILES CLOSED FOR INCOMPLETENESS
0
$0
1
$196,820
7
$78,774
0
$0
0
$0
Aggregated Statistics For Year 2001 (Based on 2 partial tracts)
A) FHA, FSA/RHS & VA Home Purchase Loans
B) Conventional Home Purchase Loans
C) Refinancings
D) Home Improvement Loans
F) Non-occupant Loans on < 5 Family Dwellings (A B C & D)
Number
Average Value
Number
Average Value
Number
Average Value
Number
Average Value
Number
Average Value
LOANS ORIGINATED
9
$90,006
40
$81,845
99
$81,763
7
$17,660
10
$74,010
APPLICATIONS APPROVED, NOT ACCEPTED
0
$0
9
$65,184
19
$77,049
2
$27,925
1
$53,140
APPLICATIONS DENIED
2
$73,740
27
$51,890
54
$81,631
8
$11,319
4
$41,072
APPLICATIONS WITHDRAWN
2
$111,150
5
$90,982
18
$95,548
1
$19,520
1
$34,700
FILES CLOSED FOR INCOMPLETENESS
1
$47,710
1
$127,420
4
$87,295
1
$21,690
1
$21,690
Aggregated Statistics For Year 2000 (Based on 2 partial tracts)
A) FHA, FSA/RHS & VA Home Purchase Loans
B) Conventional Home Purchase Loans
C) Refinancings
D) Home Improvement Loans
F) Non-occupant Loans on < 5 Family Dwellings (A B C & D)
Number
Average Value
Number
Average Value
Number
Average Value
Number
Average Value
Number
Average Value
LOANS ORIGINATED
9
$90,548
45
$70,606
49
$64,854
16
$15,249
10
$42,346
APPLICATIONS APPROVED, NOT ACCEPTED
1
$16,270
18
$58,708
13
$74,282
3
$20,060
2
$42,565
APPLICATIONS DENIED
1
$72,650
43
$53,527
33
$65,360
10
$20,170
4
$58,288
APPLICATIONS WITHDRAWN
2
$114,405
7
$60,881
21
$71,880
1
$13,560
2
$49,880
FILES CLOSED FOR INCOMPLETENESS
0
$0
0
$0
4
$76,450
0
$0
1
$21,690
Aggregated Statistics For Year 1999 (Based on 1 partial tract)
A) FHA, FSA/RHS & VA Home Purchase Loans
B) Conventional Home Purchase Loans
C) Refinancings
D) Home Improvement Loans
F) Non-occupant Loans on < 5 Family Dwellings (A B C & D)
Detailed PMIC statistics for the following Tracts:0704.00
2002 - 2018 National Fire Incident Reporting System (NFIRS) incidents
According to the data from the years 2002 - 2018 the average number of fire incidents per year is 17. The highest number of fires - 39 took place in 2004, and the least - 0 in 2005. The data has an increasing trend.
When looking into fire subcategories, the most incidents belonged to: Structure Fires (43.9%), and Outside Fires (42.6%).
Fire incident types reported to NFIRS in Zip Code 28033


 Nearest zip codes: 28021, 28092, 28016, 28169, 28077, 28034.


 According to the data from the years 2002 - 2018 the average number of fire incidents per year is 17. The highest number of fires - 39 took place in 2004, and the least - 0 in 2005. The data has an increasing trend.
 When looking into fire subcategories, the most incidents belonged to: Structure Fires (43.9%), and Outside Fires (42.6%).