Estimated zip code population in 2022: 8,001 Zip code population in 2010: 7,299 Zip code population in 2000: 6,210
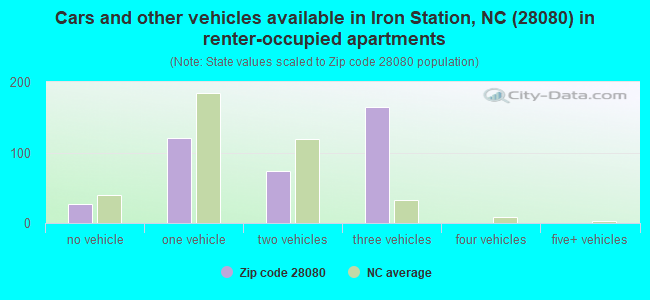
Houses and condos: 3,264 Renter-occupied apartments: 381
% of renters here:
12%
State:
33%
March 2022 cost of living index in zip code 28080: 80.9 (low, U.S. average is 100)
Land area: 39.5 sq. mi. Water area: 0.1 sq. mi.
Population density: 203 people per square mile
(very low).
OSM Map
General Map
Google Map
MSN Map
OSM Map
General Map
Google Map
MSN Map
OSM Map
General Map
Google Map
MSN Map
OSM Map
General Map
Google Map
MSN Map
Please wait while loading the map...
Real estate property taxes paid for housing units in 2022:
This zip code:
0.6% ($1,350)
North Carolina:
0.6% ($1,769)
Median real estate property taxes paid for housing units with mortgages in 2022: $1,406 (0.6%) Median real estate property taxes paid for housing units with no mortgage in 2022: $1,154 (0.6%)
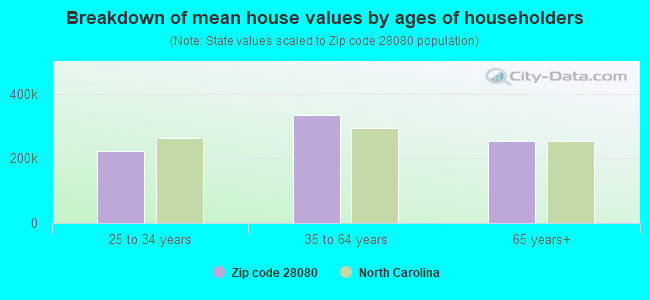
Estimated median house/condo value in 2022: $231,743
28080:
$231,743
North Carolina:
$280,600
According to our research of North Carolina and other state lists, there were 12 registered sex offenders living in 28080 zip code as of April 19, 2024. The ratio of all residents to sex offenders in zip code 28080 is 679 to 1. The ratio of registered sex offenders to all residents in this zip code is lower than the state average.
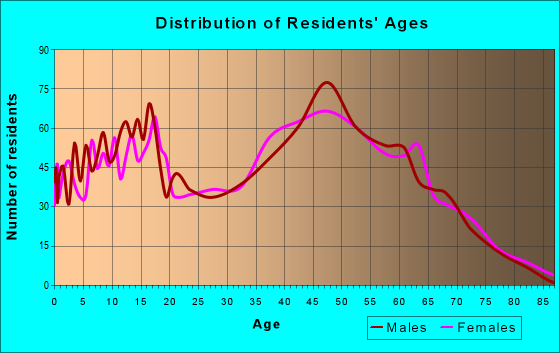
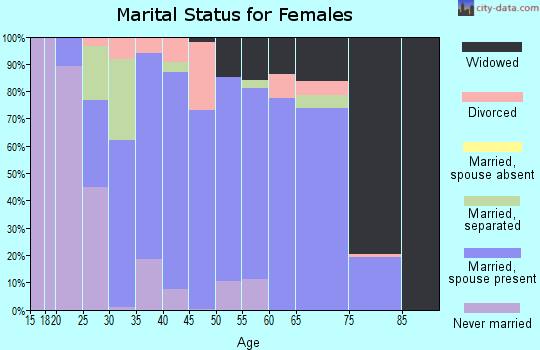
Median resident age:
This zip code:
46.1 years
North Carolina median age:
39.2 years
Average household size:
This zip code:
2.6 people
North Carolina:
2.4 people
Averages for the 2020 tax year for zip code 28080, filed in 2021:
Average Adjusted Gross Income (AGI) in 2020: $70,294 (Individual Income Tax Returns)
Here:
$70,294
State:
$70,020
Salary/wage: $62,108 (reported on 83.6% of returns)
Here:
$62,108
State:
$58,387
(% of AGI for various income ranges: 1151.3% for AGIs below $25k, 3825.5% for AGIs $25k-50k, 6536.7% for AGIs $50k-75k, 10141.5% for AGIs $75k-100k, 18872.5% for AGIs $100k-200k, 72723.3% for AGIs over 200k)
Taxable interest for individuals: $838 (reported on 27.7% of returns)
This zip code:
$838
North Carolina:
$1,479
(% of AGI for various income ranges: 17.9% for AGIs below $25k, 14.9% for AGIs $25k-50k, 33.8% for AGIs $50k-75k, 29.3% for AGIs $75k-100k, 48.9% for AGIs $100k-200k, 420.0% for AGIs over 200k)
Ordinary dividends: $4,247 (reported on 16.6% of returns)
Here:
$4,247
State:
$7,888
(% of AGI for various income ranges: 19.7% for AGIs below $25k, 36.0% for AGIs $25k-50k, 104.0% for AGIs $50k-75k, 48.1% for AGIs $75k-100k, 206.7% for AGIs $100k-200k, 1715.0% for AGIs over 200k)
Net capital gain/loss in AGI: +$15,118 (reported on 15.1% of returns)
Here:
+$15,118
State:
+$23,652
(% of AGI for various income ranges: 29.5% for AGIs $25k-50k, 67.8% for AGIs $50k-75k, 154.8% for AGIs $75k-100k, 545.6% for AGIs $100k-200k, 10295.0% for AGIs over 200k)
Profit/loss from business: +$14,069 (reported on 16.4% of returns)
Here:
+$14,069
State:
+$11,710
(% of AGI for various income ranges: 166.2% for AGIs below $25k, 184.2% for AGIs $25k-50k, 392.7% for AGIs $50k-75k, 244.1% for AGIs $75k-100k, 539.7% for AGIs $100k-200k, 3336.7% for AGIs over 200k)
Taxable individual retirement arrangement distribution: $19,654 (reported on 9.3% of returns)
28080:
$19,654
North Carolina:
$20,247
(% of AGI for various income ranges: 66.7% for AGIs below $25k, 122.7% for AGIs $25k-50k, 279.8% for AGIs $50k-75k, 343.7% for AGIs $75k-100k, 689.4% for AGIs $100k-200k, 1888.3% for AGIs over 200k)
Total itemized deductions: $33,206 (reported on 8.8% of returns)
Here:
$33,206
State:
$34,549
(% of AGI for various income ranges: 78.7% for AGIs below $25k, 233.6% for AGIs $50k-75k, 427.8% for AGIs $75k-100k, 1158.1% for AGIs $100k-200k, 7616.7% for AGIs over 200k)
Charity contributions: $12,687 (reported on 7.6% of returns)
Here:
$12,687
State:
$13,360
(% of AGI for various income ranges: 16.4% for AGIs below $25k, 33.8% for AGIs $50k-75k, 118.9% for AGIs $75k-100k, 331.4% for AGIs $100k-200k, 3331.7% for AGIs over 200k)
Taxes paid: $7,560 (reported on 8.8% of returns)
28080:
$7,560
State:
$7,586
(% of AGI for various income ranges: 9.7% for AGIs below $25k, 43.3% for AGIs $50k-75k, 108.1% for AGIs $75k-100k, 332.8% for AGIs $100k-200k, 1463.3% for AGIs over 200k)
Earned income credit: $2,159 (reported on 14.6% of returns)
Here:
$2,159
State:
$2,337
(% of AGI for various income ranges: 89.2% for AGIs below $25k, 66.4% for AGIs $25k-50k)
Percentage of individuals using paid preparers for their 2020 taxes: 94.2%
Here:
94%
State:
93%
(% for various income ranges: 93.3% for AGIs below $25k, 94.7% for AGIs $25k-50k, 95.2% for AGIs $50k-75k, 92.5% for AGIs $75k-100k, 95.2% for AGIs $100k-200k, 94.7% for AGIs over 200k)
Averages for the 2012 tax year for zip code 28080, filed in 2013:
Average Adjusted Gross Income (AGI) in 2012: $49,497 (Individual Income Tax Returns)
Here:
$49,497
State:
$54,937
Salary/wage: $46,081 (reported on 86.8% of returns)
Here:
$46,081
State:
$46,336
(% of AGI for various income ranges: 69.6% for AGIs below $25k, 83.0% for AGIs $25k-50k, 85.1% for AGIs $50k-75k, 81.0% for AGIs $75k-100k, 84.1% for AGIs $100k-200k, 71.2% for AGIs over 200k)
Taxable interest for individuals: $872 (reported on 28.4% of returns)
This zip code:
$872
North Carolina:
$1,298
(% of AGI for various income ranges: 0.8% for AGIs below $25k, 0.3% for AGIs $25k-50k, 0.4% for AGIs $50k-75k, 0.5% for AGIs $75k-100k, 0.7% for AGIs $100k-200k, 0.2% for AGIs over 200k)
Ordinary dividends: $2,255 (reported on 16.2% of returns)
Here:
$2,255
State:
$6,213
(% of AGI for various income ranges: 1.1% for AGIs below $25k, 0.4% for AGIs $25k-50k, 0.2% for AGIs $50k-75k, 0.7% for AGIs $75k-100k, 0.6% for AGIs $100k-200k, 2.2% for AGIs over 200k)
Net capital gain/loss in AGI: +$2,539 (reported on 9.2% of returns)
Here:
+$2,539
State:
+$12,740
(% of AGI for various income ranges: 0.6% for AGIs $75k-100k, 0.5% for AGIs $100k-200k, 2.6% for AGIs over 200k)
Profit/loss from business: +$9,192 (reported on 15.8% of returns)
Here:
+$9,192
State:
+$10,311
(% of AGI for various income ranges: 9.4% for AGIs below $25k, 3.4% for AGIs $25k-50k, 1.4% for AGIs $50k-75k, 2.7% for AGIs $75k-100k, 2.6% for AGIs $100k-200k)
Taxable individual retirement arrangement distribution: $14,208 (reported on 8.6% of returns)
28080:
$14,208
North Carolina:
$15,575
(% of AGI for various income ranges: 3.7% for AGIs below $25k, 3.0% for AGIs $25k-50k, 2.0% for AGIs $50k-75k, 2.7% for AGIs $75k-100k, 2.8% for AGIs $100k-200k)
Total itemized deductions: $20,250 (24% of AGI, reported on 36.6% of returns)
Here:
$20,250
State:
$23,438
Here:
23.9% of AGI
State:
21.5% of AGI
(% of AGI for various income ranges: 10.8% for AGIs below $25k, 11.0% for AGIs $25k-50k, 14.8% for AGIs $50k-75k, 16.5% for AGIs $75k-100k, 17.7% for AGIs $100k-200k, 16.8% for AGIs over 200k)
Charity contributions: $3,802 (reported on 29.7% of returns)
Here:
$3,802
State:
$4,687
(% of AGI for various income ranges: 1.4% for AGIs below $25k, 1.3% for AGIs $25k-50k, 2.2% for AGIs $50k-75k, 2.6% for AGIs $75k-100k, 3.0% for AGIs $100k-200k, 2.6% for AGIs over 200k)
Taxes paid: $6,955 (reported on 36.0% of returns)
28080:
$6,955
State:
$8,823
(% of AGI for various income ranges: 1.6% for AGIs below $25k, 2.6% for AGIs $25k-50k, 4.1% for AGIs $50k-75k, 5.9% for AGIs $75k-100k, 7.1% for AGIs $100k-200k, 7.8% for AGIs over 200k)
Earned income credit: $2,118 (reported on 19.8% of returns)
Here:
$2,118
State:
$2,376
(% of AGI for various income ranges: 6.6% for AGIs below $25k, 1.2% for AGIs $25k-50k)
Percentage of individuals using paid preparers for their 2012 taxes: 62.0%
Here:
62%
State:
53%
(% for various income ranges: 59.3% for AGIs below $25k, 61.3% for AGIs $25k-50k, 65.9% for AGIs $50k-75k, 65.6% for AGIs $75k-100k, 62.1% for AGIs $100k-200k, 80.0% for AGIs over 200k)
Averages for the 2004 tax year for zip code 28080, filed in 2005:
Average Adjusted Gross Income (AGI) in 2004: $40,803 (Individual Income Tax Returns)
Here:
$40,803
State:
$45,376
Salary/wage: $37,761 (reported on 90.2% of returns)
Here:
$37,761
State:
$39,442
(% of AGI for various income ranges: 102.3% for AGIs below $10k, 82.0% for AGIs $10k-25k, 88.5% for AGIs $25k-50k, 87.3% for AGIs $50k-75k, 91.5% for AGIs $75k-100k, 65.0% for AGIs over 100k)
Taxable interest for individuals: $993 (reported on 33.8% of returns)
This zip code:
$993
North Carolina:
$1,515
(% of AGI for various income ranges: 3.4% for AGIs below $10k, 0.8% for AGIs $10k-25k, 0.5% for AGIs $25k-50k, 0.7% for AGIs $50k-75k, 0.7% for AGIs $75k-100k, 1.3% for AGIs over 100k)
Taxable dividends: $1,260 (reported on 15.2% of returns)
Here:
$1,260
State:
$4,016
(% of AGI for various income ranges: 1.5% for AGIs below $10k, 0.6% for AGIs $10k-25k, 0.3% for AGIs $25k-50k, 0.3% for AGIs $50k-75k, 0.4% for AGIs $75k-100k, 0.8% for AGIs over 100k)
Net capital gain/loss: +$6,988 (reported on 9.1% of returns)
Here:
+$6,988
State:
+$11,152
(% of AGI for various income ranges: -0.7% for AGIs below $10k, -0.0% for AGIs $10k-25k, 0.5% for AGIs $25k-50k, 0.9% for AGIs $50k-75k, 0.3% for AGIs $75k-100k, 5.7% for AGIs over 100k)
Profit/loss from business: +$4,671 (reported on 14.9% of returns)
Here:
+$4,671
State:
+$9,490
(% of AGI for various income ranges: 6.9% for AGIs below $10k, 5.2% for AGIs $10k-25k, 2.2% for AGIs $25k-50k, 1.5% for AGIs $50k-75k, 0.2% for AGIs $75k-100k, 0.4% for AGIs over 100k)
Profit/loss from farming: +$969 (reported on 1.2% of returns)
Here:
+$969
State:
-$3,231
IRA payment deduction: $2,541 (reported on 1.3% of returns)
28080:
$2,541
North Carolina:
$2,967
Total itemized deductions: $16,164 (23% of AGI, reported on 35.9% of returns)
Here:
$16,164
State:
$19,464
Here:
23.2% of AGI
State:
22.7% of AGI
(% of AGI for various income ranges: 15.9% for AGIs below $10k, 8.4% for AGIs $10k-25k, 11.5% for AGIs $25k-50k, 15.8% for AGIs $50k-75k, 17.5% for AGIs $75k-100k, 15.9% for AGIs over 100k)
Charity contributions deductions: $3,318 (4% of AGI, reported on 29.6% of returns)
Here:
$3,318
State:
$4,035
Here:
4.5% of AGI
State:
4.5% of AGI
(% of AGI for various income ranges: 1.6% for AGIs below $10k, 1.2% for AGIs $10k-25k, 1.6% for AGIs $25k-50k, 2.5% for AGIs $50k-75k, 3.2% for AGIs $75k-100k, 3.4% for AGIs over 100k)
Total tax: $5,053 (reported on 73.5% of returns)
28080:
$5,053
State:
$7,257
(% of AGI for various income ranges: 3.4% for AGIs below $10k, 3.8% for AGIs $10k-25k, 5.9% for AGIs $25k-50k, 8.1% for AGIs $50k-75k, 9.7% for AGIs $75k-100k, 17.0% for AGIs over 100k)
Earned income credit: $1,679 (reported on 19.1% of returns)
Here:
$1,679
State:
$1,851
Percentage of individuals using paid preparers for their 2004 taxes: 69.2%
Here:
69%
State:
62%
(% for various income ranges: 63.6% for AGIs below $10k, 74.3% for AGIs $10k-25k, 68.8% for AGIs $25k-50k, 68.9% for AGIs $50k-75k, 64.2% for AGIs $75k-100k, 76.2% for AGIs over 100k)
Household received Food Stamps/SNAP in the past 12 months: 358 Household did not receive Food Stamps/SNAP in the past 12 months: 2,703
Women who had a birth in the past 12 months: 101 (104 now married, 0 unmarried) Women who did not have a birth in the past 12 months: 1,475 (603 now married, 870 unmarried)
Housing units in zip code 28080 with a mortgage: 2,002 (246 second mortgage, 229 both second mortgage and home equity loan) Houses without a mortgage: 127
Median monthly owner costs for units with a mortgage: $1,182 Median monthly owner costs for units without a mortgage: $335
Residents with income below the poverty level in 2022:
This zip code:
3.4%
Whole state:
12.8%
Residents with income below 50% of the poverty level in 2022:
This zip code:
3.0%
Whole state:
6.8%
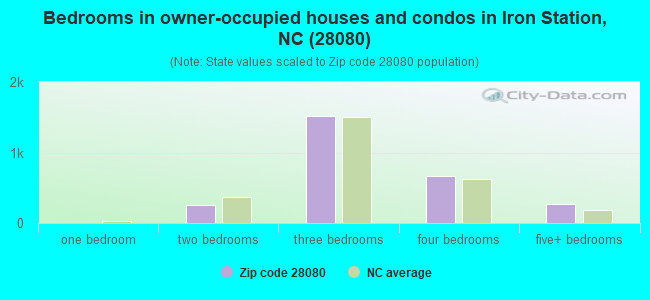
Median number of rooms in houses and condos:
Here:
6.2
State:
6.4
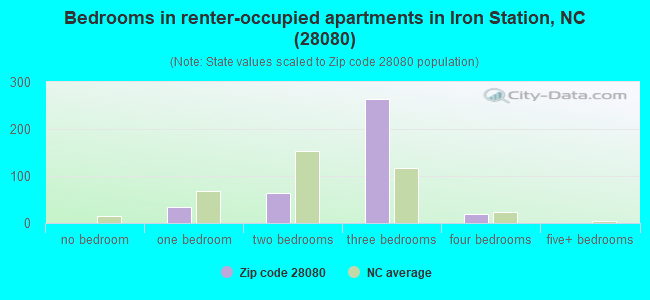
Median number of rooms in apartments:
Here:
5.0
State:
4.4
Notable locations in this zip code not listed on our city pages
Churches in zip code 28080 include: Tuckers Grove Church (A), Machpelah Church (B), Mount Vernon Church (C), New Hope Church (D), Pearl Church (E), Faith Church (F), Sharon Church (G). Display/hide their locations on the map
Streams, rivers, and creeks: Dellinger Branch (A), Crooked Creek (B), Bradshaw Branch (C), Armstrong Branch (D), Snyder Creek (E), Reed Creek (F), McClure Branch (G), Lick Run (H). Display/hide their locations on the map
In group quarters: 4 (-1 institutionalized population)
Size of family households: 1,118 2-persons, 542 3-persons, 316 4-persons, 253 5-persons, 138 6-persons
Size of nonfamily households: 430 1-person, 277 2-persons
1,152 married couples with children.
321 single-parent households (63 men, 258 women).
92.5% of residents of 28080 zip code speak English at home.
5.8% of residents speak Spanish at home (53% very well, 16% well, 11% not well, 21% not at all).
0.1% of residents speak Asian or Pacific Island language at home (100% very well).
0.9% of residents speak other language at home (58% very well, 42% well).
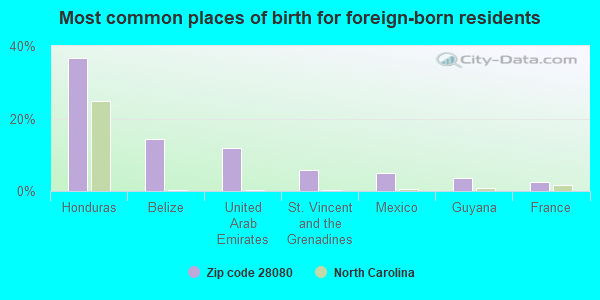
Foreign born population: 377 (4.7%) (48.7% of them are naturalized citizens)
This zip code:
4.7%
Whole state:
8.6%
37%Honduras
14%Belize
12%United Arab Emirates
6%St. Vincent and the Grenadines
5%Mexico
3%Guyana
2%France
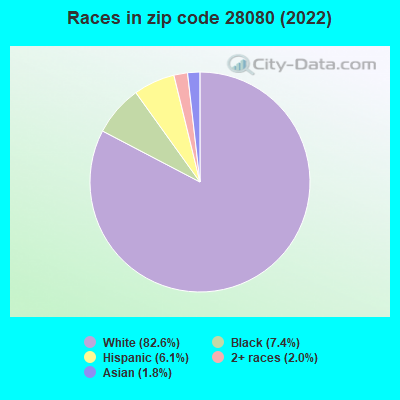
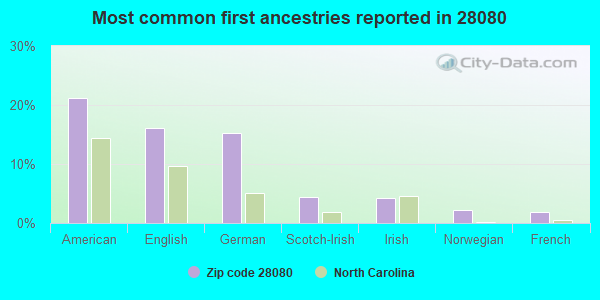
21%American
16%English
15%German
4%Scotch-Irish
4%Irish
2%Norwegian
2%French
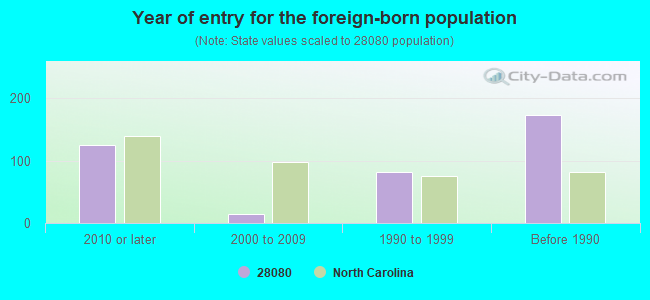
Year of entry for the foreign-born population
1252010 or later
152000 to 2009
811990 to 1999
173Before 1990
Housing units lacking complete plumbing facilities: 3.5% Housing units lacking complete kitchen facilities: 3.4%
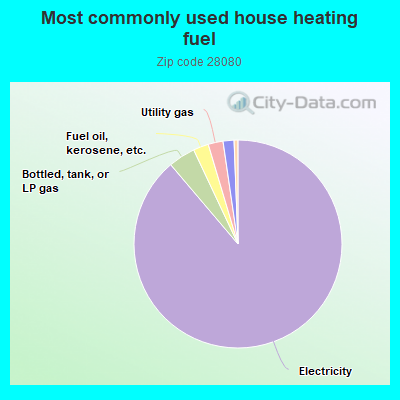
88.8%Electricity
4.2%Bottled, tank, or LP gas
2.4%Fuel oil, kerosene, etc.
2.3%Utility gas
1.7%Wood
0.6%Other fuel
Population in 1990: 9,616.
Place of birth for U.S.-born residents:
This state: 4,836
Northeast: 460
Midwest: 523
South: 1,066
West: 689
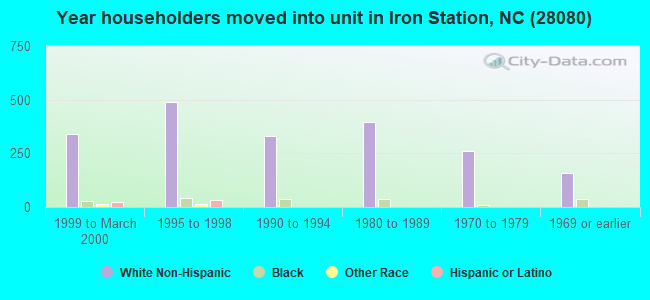
61% of the 28080 zip code residents lived in the same house 5 years ago. Out of people who lived in different houses, 43% lived in this county. Out of people who lived in different counties, 50% lived in North Carolina.
91% of the 28080 zip code residents lived in the same house 1 year ago. Out of people who lived in different houses, 23% moved from this county. Out of people who lived in different houses, 47% moved from different county within same state. Out of people who lived in different houses, 36% moved from different state.
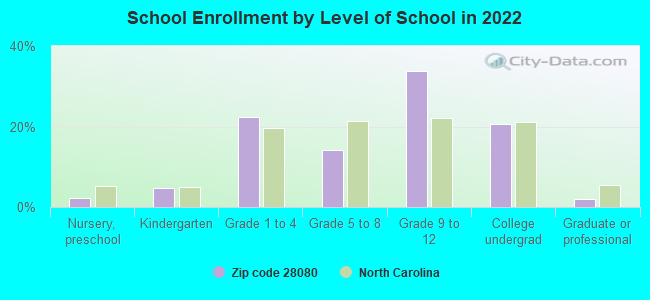
Private vs. public school enrollment:
Students in private schools in grades 1 to 8 (elementary and middle school): 74
Here:
11.0%
North Carolina:
13.8%
Students in private schools in grades 9 to 12 (high school): 130
Here:
20.5%
North Carolina:
11.9%
Students in private undergraduate colleges: 25
Here:
6.7%
North Carolina:
19.3%
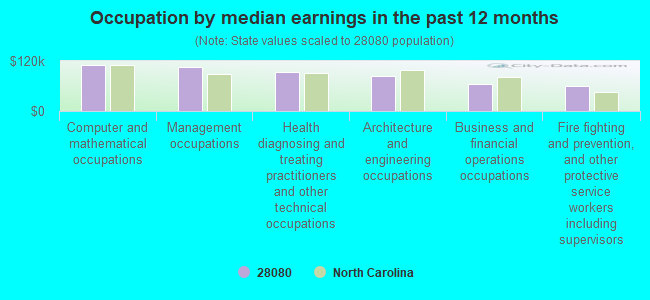
Occupation by median earnings in the past 12 months ($)
110,207Computer and mathematical occupations
105,212Management occupations
93,228Health diagnosing and treating practitioners and other technical occupations
83,978Architecture and engineering occupations
64,192Business and financial operations occupations
58,914Fire fighting and prevention, and other protective service workers including supervisors
Companies with federal contracts located in this zip code:
PINE STATE CLEANERS (612 ENGLEWOOD DRIVE in IRON STATION, NC; small business) : $19,800 in 5 contractsfrom 2003 to 2004
Contracts for Custodial Janitorial Services, Landscaping/Groundskeeping Services by Army Signed by year:2000: $0; 2001: $0; 2002: $0; 2003: $10,600; 2004: $9,200; 2005: $0; 2006: $0.
Biggest contracts:
$9,200 with Army for Custodial Janitorial Services. Signed on 2004-05-01. Completion date: 2005-04-30.
$9,200, same as above.Signed on 2003-05-01. Completion date: 2004-04-30.
$1,400 with Army for Landscaping/Groundskeeping Services. Signed on 2003-05-01. Completion date: 2003-07-31.
$0, same as above.Signed on 2003-05-01. Completion date: 2003-07-31.
Top industries in this zip code by the number of employees in 2005:
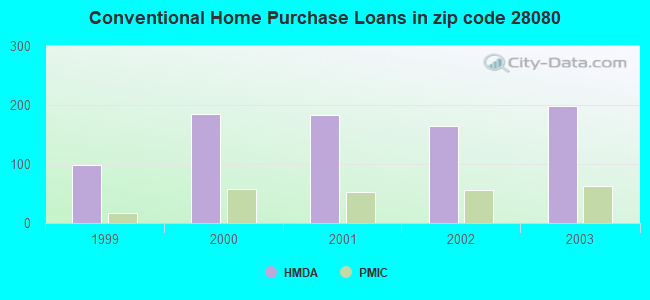
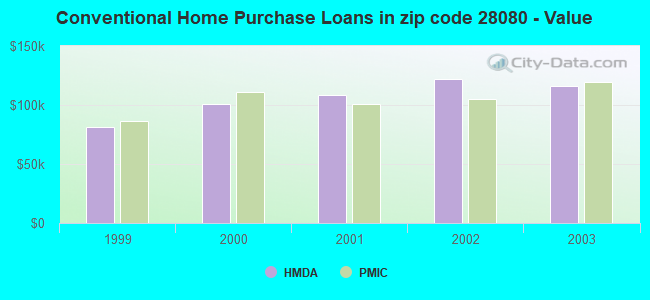
Detailed PMIC statistics for the following Tracts:0709.00
, 0710.00
2003 - 2018 National Fire Incident Reporting System (NFIRS) incidents
According to the data from the years 2003 - 2018 the average number of fire incidents per year is 27. The highest number of reported fire incidents - 55 took place in 2014, and the least - 0 in 2005. The data has a declining trend.
When looking into fire subcategories, the most reports belonged to: Structure Fires (52.9%), and Outside Fires (34.2%).
Fire incident types reported to NFIRS in Zip Code 28080


+$969
-$3,231
 Nearest zip codes: 28006, 28164, 28077, 28037, 28034, 28650.
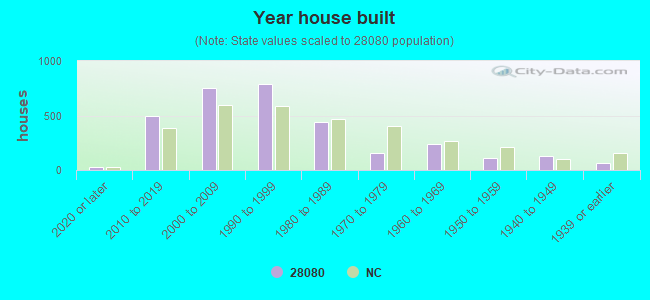


 : $19,800 in 5 contracts from 2003 to 2004
 According to the data from the years 2003 - 2018 the average number of fire incidents per year is 27. The highest number of reported fire incidents - 55 took place in 2014, and the least - 0 in 2005. The data has a declining trend.
 When looking into fire subcategories, the most reports belonged to: Structure Fires (52.9%), and Outside Fires (34.2%).