Estimated zip code population in 2022: 5,624 Zip code population in 2010: 5,864 Zip code population in 2000: 5,513
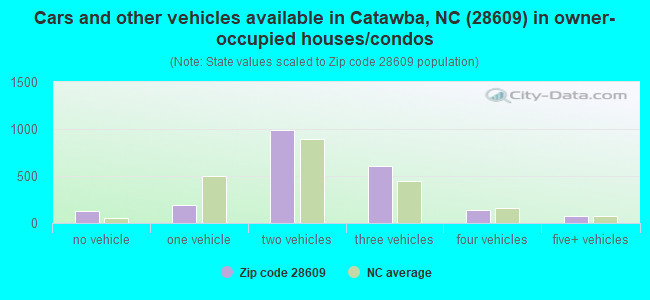
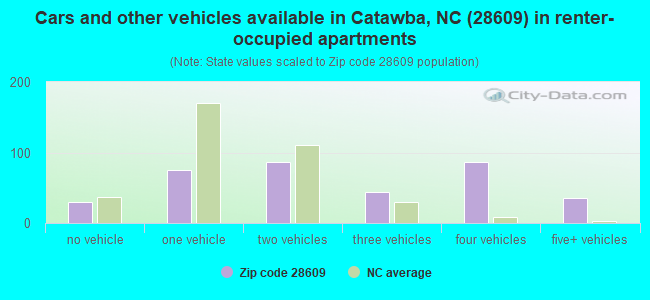
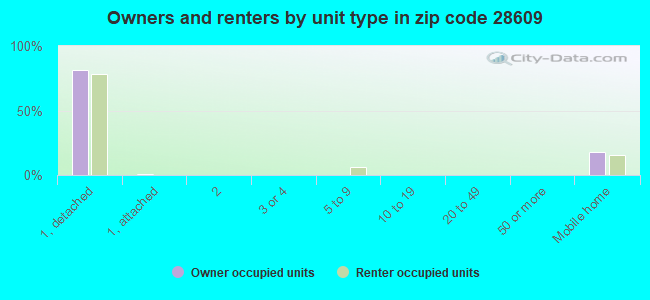
Houses and condos: 2,942 Renter-occupied apartments: 348
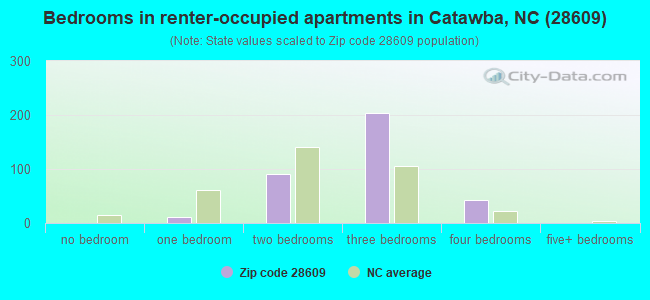
% of renters here:
14%
State:
33%
March 2022 cost of living index in zip code 28609: 81.1 (low, U.S. average is 100)
Land area: 44.5 sq. mi. Water area: 2.0 sq. mi.
Population density: 126 people per square mile
(very low).
OSM Map
General Map
Google Map
MSN Map
OSM Map
General Map
Google Map
MSN Map
OSM Map
General Map
Google Map
MSN Map
OSM Map
General Map
Google Map
MSN Map
Please wait while loading the map...
Real estate property taxes paid for housing units in 2022:
This zip code:
0.5% ($1,220)
North Carolina:
0.6% ($1,769)
Median real estate property taxes paid for housing units with mortgages in 2022: $1,296 (0.5%) Median real estate property taxes paid for housing units with no mortgage in 2022: $992 (0.5%)
Business Search- 14 Million verified businesses
Males: 2,874
(51.1%)
Females: 2,749
(48.9%)
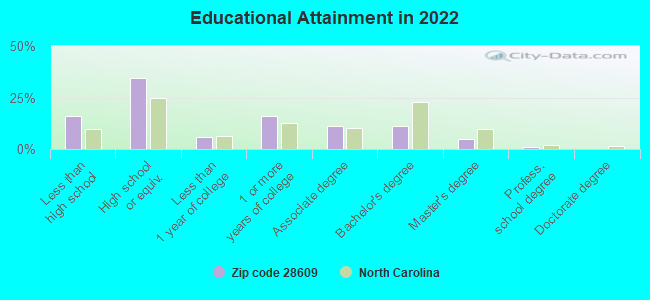
For population 25 years and over in 28609:
High school or higher: 82.3%
Bachelor's degree or higher: 16.9%
Graduate or professional degree: 5.9%
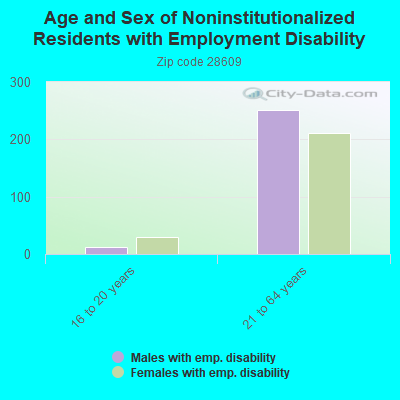
Unemployed: 1.9%
Mean travel time to work (commute): 31.1 minutes
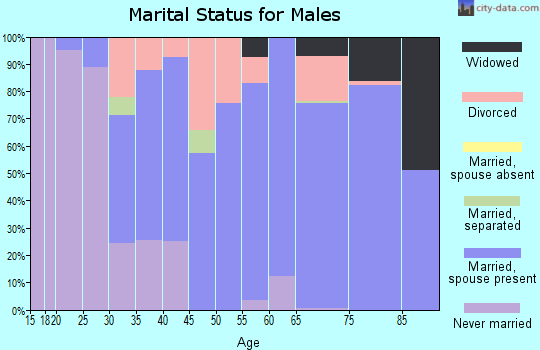
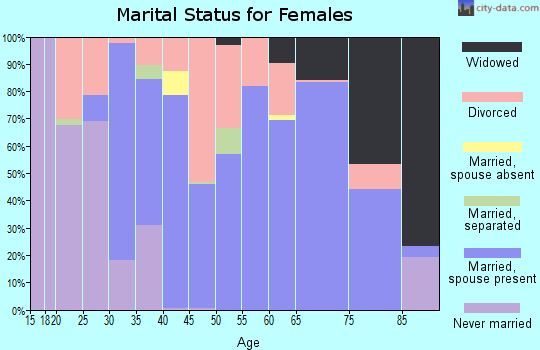
For population 15 years and over in 28609:
Never married: 19.2%
Now married: 58.8%
Separated: 1.8%
Widowed: 7.0%
Divorced: 13.2%
Zip code 28609 compared to state average:
Unemployed percentage below state average.
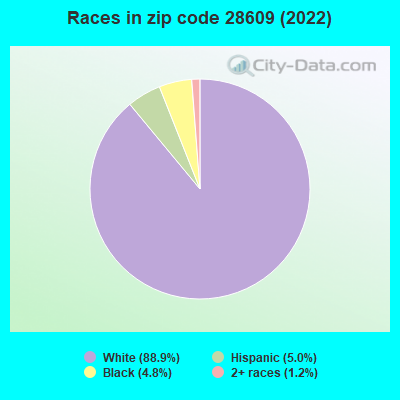
Black race population percentage significantly below state average.
Hispanic race population percentage below state average.
Median age above state average.
Foreign-born population percentage significantly below state average.
Renting percentage significantly below state average.
Length of stay since moving in above state average.
Number of college students below state average.
Percentage of population with a bachelor's degree or higher below state average.
Averages for the 2020 tax year for zip code 28609, filed in 2021:
Average Adjusted Gross Income (AGI) in 2020: $70,600 (Individual Income Tax Returns)
Here:
$70,600
State:
$70,020
Salary/wage: $56,719 (reported on 83.8% of returns)
Here:
$56,719
State:
$58,387
(% of AGI for various income ranges: 1132.4% for AGIs below $25k, 3738.3% for AGIs $25k-50k, 6479.7% for AGIs $50k-75k, 10249.5% for AGIs $75k-100k, 17444.8% for AGIs $100k-200k, 97976.7% for AGIs over 200k)
Taxable interest for individuals: $789 (reported on 28.3% of returns)
This zip code:
$789
North Carolina:
$1,479
(% of AGI for various income ranges: 6.7% for AGIs below $25k, 9.3% for AGIs $25k-50k, 30.0% for AGIs $50k-75k, 31.6% for AGIs $75k-100k, 71.3% for AGIs $100k-200k, 780.0% for AGIs over 200k)
Ordinary dividends: $5,294 (reported on 16.5% of returns)
Here:
$5,294
State:
$7,888
(% of AGI for various income ranges: 18.3% for AGIs below $25k, 23.7% for AGIs $25k-50k, 51.2% for AGIs $50k-75k, 68.4% for AGIs $75k-100k, 374.3% for AGIs $100k-200k, 3856.7% for AGIs over 200k)
Net capital gain/loss in AGI: +$13,907 (reported on 14.8% of returns)
Here:
+$13,907
State:
+$23,652
(% of AGI for various income ranges: 6.7% for AGIs below $25k, 34.2% for AGIs $25k-50k, 53.5% for AGIs $50k-75k, 203.7% for AGIs $75k-100k, 636.5% for AGIs $100k-200k, 12786.7% for AGIs over 200k)
Profit/loss from business: +$10,426 (reported on 14.1% of returns)
Here:
+$10,426
State:
+$11,710
(% of AGI for various income ranges: 119.0% for AGIs below $25k, 120.2% for AGIs $25k-50k, 186.2% for AGIs $50k-75k, 256.3% for AGIs $75k-100k, 217.0% for AGIs $100k-200k, 3980.0% for AGIs over 200k)
Taxable individual retirement arrangement distribution: $21,400 (reported on 10.4% of returns)
28609:
$21,400
North Carolina:
$20,247
(% of AGI for various income ranges: 73.8% for AGIs below $25k, 109.5% for AGIs $25k-50k, 212.9% for AGIs $50k-75k, 512.6% for AGIs $75k-100k, 1004.8% for AGIs $100k-200k, 4826.7% for AGIs over 200k)
Total itemized deductions: $34,989 (reported on 6.1% of returns)
Here:
$34,989
State:
$34,549
(% of AGI for various income ranges: 77.2% for AGIs below $25k, 161.2% for AGIs $50k-75k, 273.7% for AGIs $75k-100k, 989.6% for AGIs $100k-200k, 7993.3% for AGIs over 200k)
Charity contributions: $11,812 (reported on 5.4% of returns)
Here:
$11,812
State:
$13,360
(% of AGI for various income ranges: 70.6% for AGIs $50k-75k, 303.9% for AGIs $100k-200k, 3170.0% for AGIs over 200k)
Taxes paid: $8,317 (reported on 6.1% of returns)
28609:
$8,317
State:
$7,586
(% of AGI for various income ranges: 50.9% for AGIs $50k-75k, 73.7% for AGIs $75k-100k, 279.1% for AGIs $100k-200k, 1806.7% for AGIs over 200k)
Earned income credit: $2,119 (reported on 15.8% of returns)
Here:
$2,119
State:
$2,337
(% of AGI for various income ranges: 84.9% for AGIs below $25k, 65.3% for AGIs $25k-50k)
Percentage of individuals using paid preparers for their 2020 taxes: 94.9%
Here:
95%
State:
93%
(% for various income ranges: 93.8% for AGIs below $25k, 95.9% for AGIs $25k-50k, 95.7% for AGIs $50k-75k, 93.1% for AGIs $75k-100k, 95.0% for AGIs $100k-200k, 100.0% for AGIs over 200k)
Averages for the 2012 tax year for zip code 28609, filed in 2013:
Average Adjusted Gross Income (AGI) in 2012: $46,293 (Individual Income Tax Returns)
Here:
$46,293
State:
$54,937
Salary/wage: $41,914 (reported on 85.9% of returns)
Here:
$41,914
State:
$46,336
(% of AGI for various income ranges: 74.0% for AGIs below $25k, 82.5% for AGIs $25k-50k, 82.8% for AGIs $50k-75k, 78.4% for AGIs $75k-100k, 76.3% for AGIs $100k-200k, 63.3% for AGIs over 200k)
Taxable interest for individuals: $714 (reported on 31.8% of returns)
This zip code:
$714
North Carolina:
$1,298
(% of AGI for various income ranges: 1.3% for AGIs below $25k, 0.3% for AGIs $25k-50k, 0.5% for AGIs $50k-75k, 0.3% for AGIs $75k-100k, 0.4% for AGIs $100k-200k, 0.5% for AGIs over 200k)
Ordinary dividends: $2,614 (reported on 16.9% of returns)
Here:
$2,614
State:
$6,213
(% of AGI for various income ranges: 0.9% for AGIs below $25k, 0.8% for AGIs $25k-50k, 0.5% for AGIs $50k-75k, 0.4% for AGIs $75k-100k, 1.1% for AGIs $100k-200k, 2.8% for AGIs over 200k)
Net capital gain/loss in AGI: +$2,323 (reported on 10.2% of returns)
Here:
+$2,323
State:
+$12,740
(% of AGI for various income ranges: 0.2% for AGIs $25k-50k, 0.1% for AGIs $50k-75k, 0.9% for AGIs $75k-100k, 1.4% for AGIs $100k-200k)
Profit/loss from business: +$6,977 (reported on 13.7% of returns)
Here:
+$6,977
State:
+$10,311
(% of AGI for various income ranges: 5.8% for AGIs below $25k, 1.5% for AGIs $25k-50k, 1.5% for AGIs $50k-75k, 0.6% for AGIs $75k-100k, 3.3% for AGIs $100k-200k)
Taxable individual retirement arrangement distribution: $13,864 (reported on 11.0% of returns)
28609:
$13,864
North Carolina:
$15,575
(% of AGI for various income ranges: 3.8% for AGIs below $25k, 2.6% for AGIs $25k-50k, 2.3% for AGIs $50k-75k, 4.1% for AGIs $75k-100k, 5.4% for AGIs $100k-200k)
Total itemized deductions: $20,339 (24% of AGI, reported on 30.2% of returns)
Here:
$20,339
State:
$23,438
Here:
23.8% of AGI
State:
21.5% of AGI
(% of AGI for various income ranges: 7.2% for AGIs below $25k, 10.3% for AGIs $25k-50k, 11.5% for AGIs $50k-75k, 15.1% for AGIs $75k-100k, 16.8% for AGIs $100k-200k, 18.8% for AGIs over 200k)
Charity contributions: $3,689 (reported on 24.3% of returns)
Here:
$3,689
State:
$4,687
(% of AGI for various income ranges: 0.6% for AGIs below $25k, 1.4% for AGIs $25k-50k, 1.8% for AGIs $50k-75k, 2.3% for AGIs $75k-100k, 2.9% for AGIs $100k-200k, 2.0% for AGIs over 200k)
Taxes paid: $6,664 (reported on 30.2% of returns)
28609:
$6,664
State:
$8,823
(% of AGI for various income ranges: 1.0% for AGIs below $25k, 2.5% for AGIs $25k-50k, 3.1% for AGIs $50k-75k, 5.2% for AGIs $75k-100k, 6.9% for AGIs $100k-200k, 7.3% for AGIs over 200k)
Earned income credit: $2,163 (reported on 20.4% of returns)
Here:
$2,163
State:
$2,376
(% of AGI for various income ranges: 6.5% for AGIs below $25k, 1.3% for AGIs $25k-50k)
Percentage of individuals using paid preparers for their 2012 taxes: 58.0%
Here:
58%
State:
53%
(% for various income ranges: 51.5% for AGIs below $25k, 59.4% for AGIs $25k-50k, 62.5% for AGIs $50k-75k, 60.9% for AGIs $75k-100k, 71.4% for AGIs $100k-200k, 75.0% for AGIs over 200k)
Averages for the 2004 tax year for zip code 28609, filed in 2005:
Average Adjusted Gross Income (AGI) in 2004: $39,446 (Individual Income Tax Returns)
Here:
$39,446
State:
$45,376
Salary/wage: $35,735 (reported on 90.9% of returns)
Here:
$35,735
State:
$39,442
(% of AGI for various income ranges: 129.6% for AGIs below $10k, 84.8% for AGIs $10k-25k, 88.3% for AGIs $25k-50k, 85.9% for AGIs $50k-75k, 84.8% for AGIs $75k-100k, 64.2% for AGIs over 100k)
Taxable interest for individuals: $1,274 (reported on 36.6% of returns)
This zip code:
$1,274
North Carolina:
$1,515
(% of AGI for various income ranges: 4.2% for AGIs below $10k, 1.1% for AGIs $10k-25k, 0.7% for AGIs $25k-50k, 0.5% for AGIs $50k-75k, 0.8% for AGIs $75k-100k, 2.7% for AGIs over 100k)
Taxable dividends: $2,212 (reported on 16.6% of returns)
Here:
$2,212
State:
$4,016
(% of AGI for various income ranges: 2.4% for AGIs below $10k, 0.6% for AGIs $10k-25k, 0.3% for AGIs $25k-50k, 0.3% for AGIs $50k-75k, 0.5% for AGIs $75k-100k, 2.8% for AGIs over 100k)
Net capital gain/loss: +$9,880 (reported on 11.6% of returns)
Here:
+$9,880
State:
+$11,152
(% of AGI for various income ranges: -0.4% for AGIs below $10k, 0.6% for AGIs $10k-25k, 0.4% for AGIs $25k-50k, 0.6% for AGIs $50k-75k, 2.8% for AGIs $75k-100k, 10.3% for AGIs over 100k)
Profit/loss from business: +$6,647 (reported on 13.2% of returns)
Here:
+$6,647
State:
+$9,490
(% of AGI for various income ranges: 12.6% for AGIs below $10k, 3.1% for AGIs $10k-25k, 2.7% for AGIs $25k-50k, 2.1% for AGIs $50k-75k, 2.3% for AGIs $75k-100k, 0.5% for AGIs over 100k)
IRA payment deduction: $2,683 (reported on 1.6% of returns)
28609:
$2,683
North Carolina:
$2,967
Total itemized deductions: $16,072 (23% of AGI, reported on 32.1% of returns)
Here:
$16,072
State:
$19,464
Here:
22.9% of AGI
State:
22.7% of AGI
(% of AGI for various income ranges: 18.4% for AGIs below $10k, 6.6% for AGIs $10k-25k, 10.7% for AGIs $25k-50k, 14.5% for AGIs $50k-75k, 16.8% for AGIs $75k-100k, 15.0% for AGIs over 100k)
Charity contributions deductions: $3,298 (4% of AGI, reported on 26.6% of returns)
Here:
$3,298
State:
$4,035
Here:
4.3% of AGI
State:
4.5% of AGI
(% of AGI for various income ranges: 0.8% for AGIs below $10k, 0.6% for AGIs $10k-25k, 1.4% for AGIs $25k-50k, 2.1% for AGIs $50k-75k, 2.9% for AGIs $75k-100k, 3.8% for AGIs over 100k)
Total tax: $4,871 (reported on 74.4% of returns)
28609:
$4,871
State:
$7,257
(% of AGI for various income ranges: 2.8% for AGIs below $10k, 3.6% for AGIs $10k-25k, 6.2% for AGIs $25k-50k, 8.1% for AGIs $50k-75k, 10.1% for AGIs $75k-100k, 17.1% for AGIs over 100k)
Earned income credit: $1,672 (reported on 17.8% of returns)
Here:
$1,672
State:
$1,851
Percentage of individuals using paid preparers for their 2004 taxes: 67.4%
Here:
67%
State:
62%
(% for various income ranges: 56.0% for AGIs below $10k, 71.4% for AGIs $10k-25k, 67.4% for AGIs $25k-50k, 66.0% for AGIs $50k-75k, 76.1% for AGIs $75k-100k, 79.2% for AGIs over 100k)
Likely homosexual households (counted as self-reported same-sex unmarried-partner households)
Lesbian couples: 0.3% of all households
Gay men: 0.0% of all households
Household received Food Stamps/SNAP in the past 12 months: 220 Household did not receive Food Stamps/SNAP in the past 12 months: 2,243
Women who had a birth in the past 12 months: 28 (2 now married, 24 unmarried) Women who did not have a birth in the past 12 months: 948 (498 now married, 451 unmarried)
Housing units in zip code 28609 with a mortgage: 1,254 (140 second mortgage, 140 both second mortgage and home equity loan) Houses without a mortgage: 11
Median monthly owner costs for units with a mortgage: $1,105 Median monthly owner costs for units without a mortgage: $305
Residents with income below the poverty level in 2022:
This zip code:
11.5%
Whole state:
12.8%
Residents with income below 50% of the poverty level in 2022:
This zip code:
6.4%
Whole state:
6.8%
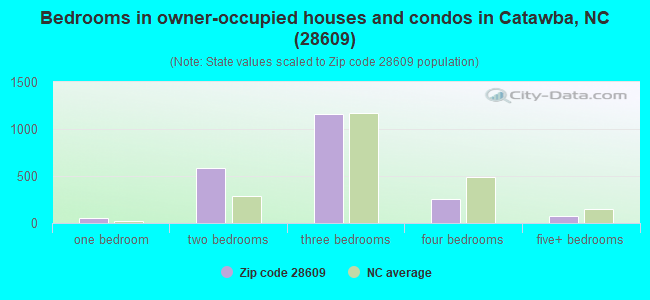
Median number of rooms in houses and condos:
Here:
5.6
State:
6.4
Median number of rooms in apartments:
Here:
5.0
State:
4.4
Notable locations in this zip code not listed on our city pages
Churches in zip code 28609 include: Hudson Chapel (A), Welcome Church (B), Browns Chapel (C), Mount Sinai Church (D), Center Church (E), Olivet Church (F), Concord Church (G), Pisgah Church (H), Pleasant Grove Church (I). Display/hide their locations on the map
Cemeteries: Brooks Cemetery (1), Mount Olive Cemetery (2), Concord Cemetery (3), Providence Memorial Cemetery (4), Smyres Cemetery (5). Display/hide their locations on the map
Reservoirs: Lookout Shoals Lake (A), Elmore Lake (B), Comm Scope Lake (C), Murrays Mill Lake (D), Mathis Chapel (E), Lake Lookout (F). Display/hide their locations on the map
Streams, rivers, and creeks: Battle Run (A), Balls Creek (B), Terrapin Creek (C), South Fork Mountain Creek (D), North Fork Mountain Creek (E), Lyle Creek (F), Gold Mine Creek (G). Display/hide their locations on the map
748 married couples with children.
141 single-parent households (108 men, 33 women).
95.9% of residents of 28609 zip code speak English at home.
2.7% of residents speak Spanish at home (53% very well, 4% well, 28% not well, 15% not at all).
1.2% of residents speak other Indo-European language at home (100% very well).
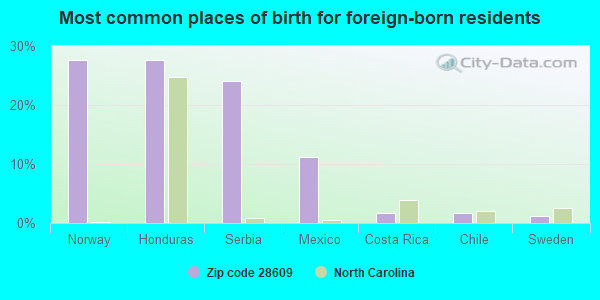
Foreign born population: 172 (3.1%) (61.4% of them are naturalized citizens)
This zip code:
3.1%
Whole state:
8.6%
28%Norway
28%Honduras
24%Serbia
11%Mexico
2%Costa Rica
2%Chile
1%Sweden
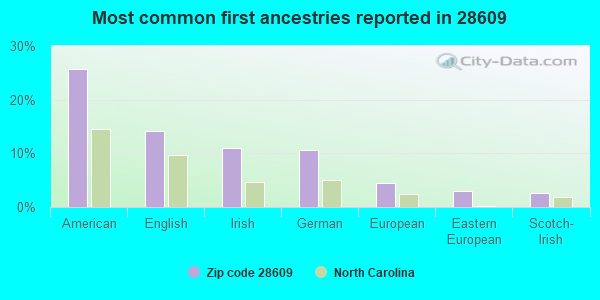
26%American
14%English
11%Irish
11%German
4%European
3%Eastern European
3%Scotch-Irish
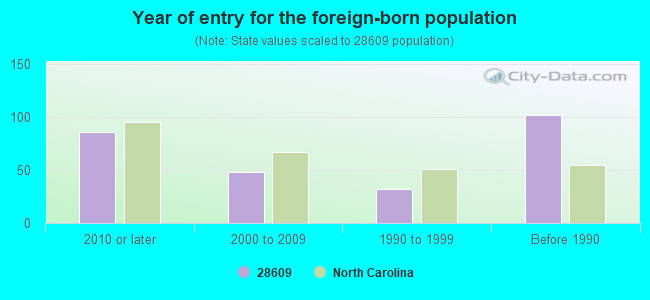
Year of entry for the foreign-born population
862010 or later
482000 to 2009
321990 to 1999
102Before 1990
Facilities with environmental interests located in this zip code:
CATAWBA COUNTY SCHOOLS (5040 EAST BRANDYS ROAD in CATAWBA, NC)
STATE MASTER (North Carolina facility info) - -115DA4YG00NJ6D64FBEM06T099, WASTEWATER FACILITY STATE MASTER (North Carolina facility info) - UNDERGROUND STORAGE TANK PROGRAM (National Center for Education Statistics) - STATE ID-308 National Pollutant Discharge Elimination System NON-MAJOR (Tracking pollutant discharge elimination systems) - permit Business SIC classification: ELEMENTARY AND SECONDARY SCHOOLS; NONCLASSIFIABLE ESTABLISHMENTS Alternative names: BANDYS HIGH SCHOOL, BANDYS HS, CATAWBA CO SCH-BANDYS HIGH SCH, CATAWBA COUNTY SCH BANDYS HS
CATAWBA MIDDLE SCHOOL (403 SIXTH AVENUE SW. in CATAWBA, NC)
STATE MASTER (North Carolina facility info) - UNDERGROUND STORAGE TANK PROGRAM (National Center for Education Statistics) - STATE ID-324 Business SIC classification: NONCLASSIFIABLE ESTABLISHMENTS Organizations: CATAWBA COUNTY SCHOOLS (SCHOOL DISTRICT)
Alternative names: CATAWBA INTERMEDIATE
CATAWBA CO SCH-FRED T FORD HS (STARTOWN HWY in CATAWBA, NC)
AIR MINOR (AIRS/AFS) Business SIC classification: ELEMENTARY AND SECONDARY SCHOOLS
CATAWBA WWTP (SIXTH AVE NW in CATAWBA, NC)
National Pollutant Discharge Elimination System NON-MAJOR (Tracking pollutant discharge elimination systems) - permit Business SIC classification: SEWERAGE SYSTEMS Organizations: CATAWBA, TOWN OF (CONTACT/OWNER)
ALCOA EXTRUSIONS INC (6555 COMMSCOPE ROAD in CATAWBA, NC)
Conditionally Exempt Small Quantity Generators, less than 100 kg/month of hazardous waste (Resource Conservation and Recovery Act (tracking hazardous waste)) - notification TRI REPORTER (Tracking of toxic chemicals releasing facilities) Business SIC classification: ALUMINUM EXTRUDED PRODUCTS; ALUMINUM ROLLING AND DRAWING Organizations: ALCOA EXTRUSIONS INC (CONTACT/OWNER)
Alternative names: ALCOA ENGINEERED PRODS.
CATAWBA CO SCH-BUNKER HILL HS (OXFORD SCHOOL RD in CATAWBA, NC)
AIR MINOR (AIRS/AFS) Business SIC classification: ELEMENTARY AND SECONDARY SCHOOLS
Housing units lacking complete plumbing facilities: 1.9% Housing units lacking complete kitchen facilities: 2.0%
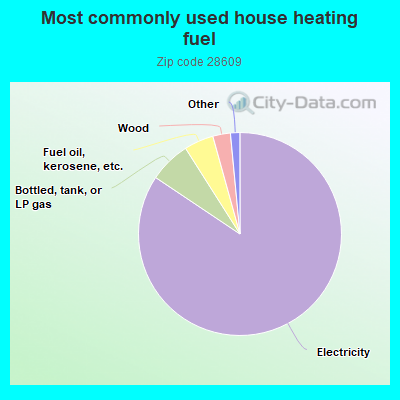
84.4%Electricity
6.6%Bottled, tank, or LP gas
4.7%Fuel oil, kerosene, etc.
2.8%Wood
1.0%No fuel used
0.6%Utility gas
Population in 1990: 1,767. Population change in the 1990s: +3,746 (+212.0%).
Place of birth for U.S.-born residents:
This state: 3,596
Northeast: 806
Midwest: 62
South: 750
West: 105
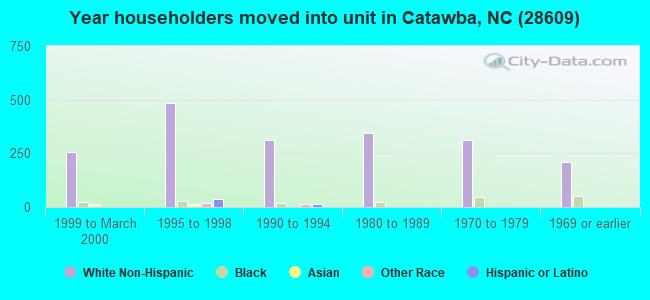
67% of the 28609 zip code residents lived in the same house 5 years ago. Out of people who lived in different houses, 56% lived in this county. Out of people who lived in different counties, 50% lived in North Carolina.
96% of the 28609 zip code residents lived in the same house 1 year ago. Out of people who lived in different houses, 54% moved from this county. Out of people who lived in different houses, 23% moved from different county within same state. Out of people who lived in different houses, 2% moved from different state. Out of people who lived in different houses, 32% moved from abroad.
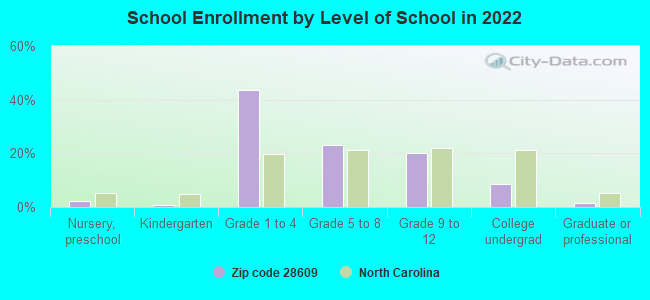
Private vs. public school enrollment:
Students in private schools in grades 1 to 8 (elementary and middle school): 127
Here:
19.8%
North Carolina:
13.8%
Students in private schools in grades 9 to 12 (high school): 40
Here:
20.6%
North Carolina:
11.9%
Students in private undergraduate colleges: 29
Here:
34.4%
North Carolina:
19.3%
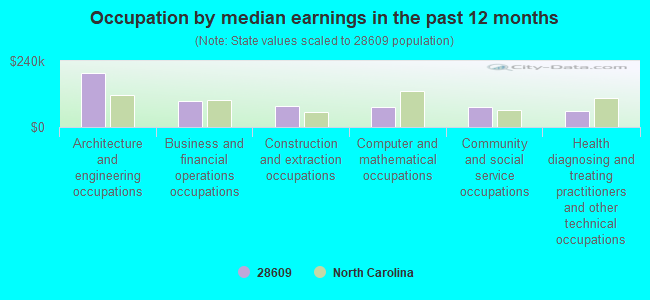
Occupation by median earnings in the past 12 months ($)
195,084Architecture and engineering occupations
94,290Business and financial operations occupations
76,564Construction and extraction occupations
72,419Computer and mathematical occupations
71,490Community and social service occupations
56,933Health diagnosing and treating practitioners and other technical occupations
Top industries in this zip code by the number of employees in 2005:
Administrative and Support and Waste Management and Remediation Services: Landscaping Services (20-49 employees: 1 establishment, 5-9 employees: 1 establishment, 1-4 employees: 4 establishments)
Finance and Insurance: Insurance Agencies and Brokerages (10-19: 1, 1-4: 1)
Fatal accident statistics in 2014:
Fatal accident count: 5
Vehicles involved in fatal accidents: 6
Fatal accidents caused by drunken drivers: 3
Fatalities: 5
Persons involved in fatal accidents: 11
Pedestrians involved in fatal accidents: 1
Fatal accident statistics in 2013:
Fatal accident count: 1
Vehicles involved in fatal accidents: 2
Fatal accidents caused by drunken drivers: 0
Fatalities: 1
Persons involved in fatal accidents: 2
Pedestrians involved in fatal accidents: 0
Home Mortgage Disclosure Act Aggregated Statistics For Year 2009 (Based on 6 partial tracts)
A) FHA, FSA/RHS & VA Home Purchase Loans
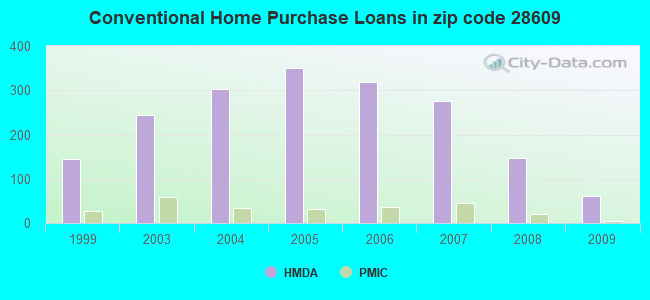
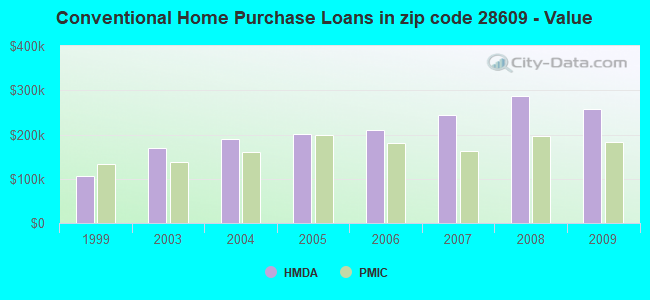
B) Conventional Home Purchase Loans
C) Refinancings
D) Home Improvement Loans
F) Non-occupant Loans on < 5 Family Dwellings (A B C & D)
G) Loans On Manufactured Home Dwelling (A B C & D)
Number
Average Value
Number
Average Value
Number
Average Value
Number
Average Value
Number
Average Value
Number
Average Value
LOANS ORIGINATED
38
$145,751
60
$258,623
463
$228,435
13
$116,148
57
$239,744
29
$90,693
APPLICATIONS APPROVED, NOT ACCEPTED
1
$154,290
6
$227,342
32
$256,166
1
$8,040
7
$204,253
4
$75,158
APPLICATIONS DENIED
6
$105,275
12
$185,086
144
$248,568
4
$25,122
17
$216,662
19
$70,667
APPLICATIONS WITHDRAWN
9
$108,583
11
$316,134
73
$250,667
6
$83,485
12
$231,935
6
$96,140
FILES CLOSED FOR INCOMPLETENESS
0
$0
4
$479,188
33
$200,435
3
$62,923
5
$181,274
4
$49,285
Aggregated Statistics For Year 2008 (Based on 6 partial tracts)
A) FHA, FSA/RHS & VA Home Purchase Loans
B) Conventional Home Purchase Loans
C) Refinancings
D) Home Improvement Loans
E) Loans on Dwellings For 5+ Families
F) Non-occupant Loans on < 5 Family Dwellings (A B C & D)
G) Loans On Manufactured Home Dwelling (A B C & D)
Number
Average Value
Number
Average Value
Number
Average Value
Number
Average Value
Number
Average Value
Number
Average Value
Number
Average Value
LOANS ORIGINATED
41
$121,761
147
$286,118
301
$224,273
24
$141,326
1
$281,550
79
$240,488
47
$94,084
APPLICATIONS APPROVED, NOT ACCEPTED
1
$89,240
10
$239,193
38
$171,968
6
$113,752
0
$0
2
$300,240
6
$90,328
APPLICATIONS DENIED
10
$93,662
30
$306,600
183
$192,461
30
$65,843
0
$0
16
$246,016
39
$103,979
APPLICATIONS WITHDRAWN
6
$240,405
22
$294,182
77
$233,286
8
$54,181
0
$0
9
$220,023
8
$157,525
FILES CLOSED FOR INCOMPLETENESS
2
$110,565
4
$290,262
13
$192,936
0
$0
0
$0
2
$98,870
1
$150,910
Aggregated Statistics For Year 2007 (Based on 6 partial tracts)
A) FHA, FSA/RHS & VA Home Purchase Loans
B) Conventional Home Purchase Loans
C) Refinancings
D) Home Improvement Loans
F) Non-occupant Loans on < 5 Family Dwellings (A B C & D)
G) Loans On Manufactured Home Dwelling (A B C & D)
Number
Average Value
Number
Average Value
Number
Average Value
Number
Average Value
Number
Average Value
Number
Average Value
LOANS ORIGINATED
14
$109,930
275
$244,708
310
$206,698
24
$131,128
90
$219,100
57
$86,369
APPLICATIONS APPROVED, NOT ACCEPTED
0
$0
28
$225,876
61
$172,309
3
$139,873
13
$185,184
12
$68,526
APPLICATIONS DENIED
2
$78,495
43
$194,565
223
$171,156
36
$74,355
16
$219,221
57
$81,609
APPLICATIONS WITHDRAWN
1
$49,120
28
$287,929
89
$238,055
3
$60,187
12
$261,163
8
$109,262
FILES CLOSED FOR INCOMPLETENESS
0
$0
8
$198,704
29
$177,685
0
$0
2
$149,425
3
$115,843
Aggregated Statistics For Year 2006 (Based on 6 partial tracts)
A) FHA, FSA/RHS & VA Home Purchase Loans
B) Conventional Home Purchase Loans
C) Refinancings
D) Home Improvement Loans
F) Non-occupant Loans on < 5 Family Dwellings (A B C & D)
G) Loans On Manufactured Home Dwelling (A B C & D)
Number
Average Value
Number
Average Value
Number
Average Value
Number
Average Value
Number
Average Value
Number
Average Value
LOANS ORIGINATED
19
$116,690
318
$210,980
338
$158,800
34
$51,521
100
$209,490
59
$81,369
APPLICATIONS APPROVED, NOT ACCEPTED
1
$64,870
39
$164,278
63
$142,825
14
$54,216
9
$287,238
17
$83,540
APPLICATIONS DENIED
3
$55,963
65
$154,804
200
$122,417
33
$51,548
19
$122,541
61
$90,088
APPLICATIONS WITHDRAWN
2
$107,960
35
$244,769
81
$150,741
8
$96,594
12
$206,423
11
$86,925
FILES CLOSED FOR INCOMPLETENESS
1
$105,850
9
$258,887
31
$211,993
0
$0
4
$346,765
0
$0
Aggregated Statistics For Year 2005 (Based on 6 partial tracts)
A) FHA, FSA/RHS & VA Home Purchase Loans
B) Conventional Home Purchase Loans
C) Refinancings
D) Home Improvement Loans
E) Loans on Dwellings For 5+ Families
F) Non-occupant Loans on < 5 Family Dwellings (A B C & D)
G) Loans On Manufactured Home Dwelling (A B C & D)
Number
Average Value
Number
Average Value
Number
Average Value
Number
Average Value
Number
Average Value
Number
Average Value
Number
Average Value
LOANS ORIGINATED
15
$112,076
350
$200,274
332
$174,373
38
$66,041
1
$625,040
90
$169,602
53
$75,595
APPLICATIONS APPROVED, NOT ACCEPTED
1
$31,130
34
$201,563
76
$123,550
7
$17,730
0
$0
4
$258,388
20
$76,808
APPLICATIONS DENIED
6
$88,648
69
$151,531
245
$116,350
21
$47,796
0
$0
12
$251,185
74
$80,923
APPLICATIONS WITHDRAWN
6
$123,733
50
$160,876
133
$151,563
12
$123,342
0
$0
11
$207,320
21
$87,675
FILES CLOSED FOR INCOMPLETENESS
0
$0
4
$159,712
33
$170,356
3
$37,247
0
$0
4
$214,840
4
$109,822
Aggregated Statistics For Year 2004 (Based on 6 partial tracts)
A) FHA, FSA/RHS & VA Home Purchase Loans
B) Conventional Home Purchase Loans
C) Refinancings
D) Home Improvement Loans
F) Non-occupant Loans on < 5 Family Dwellings (A B C & D)
G) Loans On Manufactured Home Dwelling (A B C & D)
Number
Average Value
Number
Average Value
Number
Average Value
Number
Average Value
Number
Average Value
Number
Average Value
LOANS ORIGINATED
13
$105,245
303
$190,641
393
$145,356
27
$36,626
90
$161,847
60
$81,642
APPLICATIONS APPROVED, NOT ACCEPTED
1
$46,630
38
$115,398
61
$168,677
10
$27,701
7
$209,600
23
$56,621
APPLICATIONS DENIED
3
$116,553
71
$129,463
233
$110,448
24
$37,033
16
$135,873
82
$78,836
APPLICATIONS WITHDRAWN
2
$70,215
30
$169,849
102
$126,348
5
$98,528
11
$151,756
13
$94,728
FILES CLOSED FOR INCOMPLETENESS
0
$0
11
$196,568
35
$137,715
0
$0
1
$227,600
2
$55,105
Aggregated Statistics For Year 2003 (Based on 6 partial tracts)
A) FHA, FSA/RHS & VA Home Purchase Loans
B) Conventional Home Purchase Loans
C) Refinancings
D) Home Improvement Loans
F) Non-occupant Loans on < 5 Family Dwellings (A B C & D)
Number
Average Value
Number
Average Value
Number
Average Value
Number
Average Value
Number
Average Value
LOANS ORIGINATED
19
$113,095
245
$169,462
813
$148,064
23
$33,427
107
$145,989
APPLICATIONS APPROVED, NOT ACCEPTED
1
$142,170
28
$120,149
113
$129,492
4
$14,620
11
$105,686
APPLICATIONS DENIED
4
$93,410
85
$119,599
255
$117,733
18
$18,522
14
$153,119
APPLICATIONS WITHDRAWN
2
$121,580
31
$155,670
111
$148,605
3
$21,807
16
$125,006
FILES CLOSED FOR INCOMPLETENESS
2
$119,305
11
$120,992
13
$172,789
0
$0
1
$137,400
Aggregated Statistics For Year 1999 (Based on 2 partial tracts)
A) FHA, FSA/RHS & VA Home Purchase Loans
B) Conventional Home Purchase Loans
C) Refinancings
D) Home Improvement Loans
F) Non-occupant Loans on < 5 Family Dwellings (A B C & D)
2002 - 2018 National Fire Incident Reporting System (NFIRS) incidents
Based on the data from the years 2002 - 2018 the average number of fires per year is 50. The highest number of fire incidents - 144 took place in 2007, and the least - 13 in 2017. The data has a dropping trend.
When looking into fire subcategories, the most incidents belonged to: Outside Fires (42.2%), and Structure Fires (33.4%).
Fire incident types reported to NFIRS in Zip Code 28609

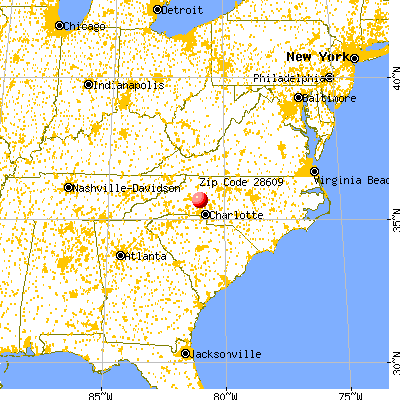


 Nearest zip codes: 28673, 28610, 28682, 28650, 28677, 28678.


 Based on the data from the years 2002 - 2018 the average number of fires per year is 50. The highest number of fire incidents - 144 took place in 2007, and the least - 13 in 2017. The data has a dropping trend.
 When looking into fire subcategories, the most incidents belonged to: Outside Fires (42.2%), and Structure Fires (33.4%).