Estimated zip code population in 2022: 1,764 Zip code population in 2010: 1,364 Zip code population in 2000: 2,386
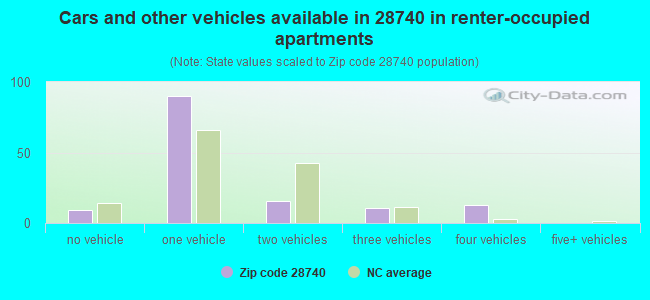
Houses and condos: 1,334 Renter-occupied apartments: 138
% of renters here:
16%
State:
33%
March 2022 cost of living index in zip code 28740: 81.8 (low, U.S. average is 100)
Land area: 55.3 sq. mi. Water area: 0.5 sq. mi.
Population density: 32 people per square mile
(very low).
OSM Map
General Map
Google Map
MSN Map
OSM Map
General Map
Google Map
MSN Map
OSM Map
General Map
Google Map
MSN Map
OSM Map
General Map
Google Map
MSN Map
Please wait while loading the map...
Real estate property taxes paid for housing units in 2022:
This zip code:
0.5% ($1,174)
North Carolina:
0.6% ($1,769)
Median real estate property taxes paid for housing units with mortgages in 2022: $1,218 (0.5%) Median real estate property taxes paid for housing units with no mortgage in 2022: $1,122 (0.5%)
Business Search- 14 Million verified businesses
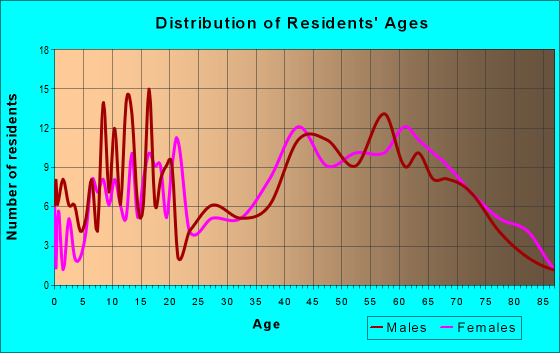
Males: 793
(45.0%)
Females: 971
(55.0%)
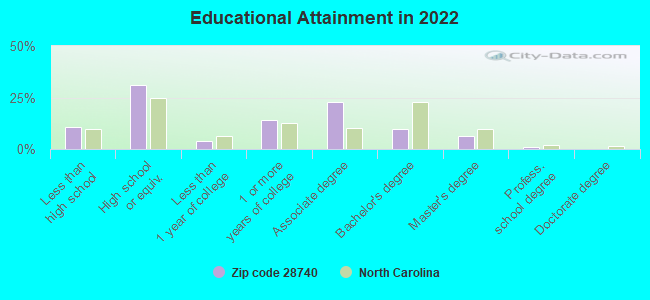
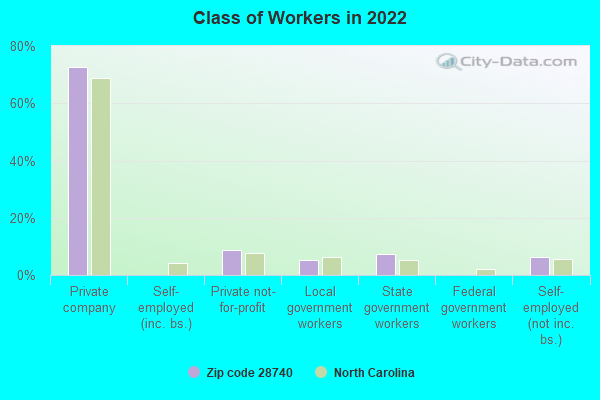
For population 25 years and over in 28740:
High school or higher: 87.0%
Bachelor's degree or higher: 16.5%
Graduate or professional degree: 6.8%
Unemployed: 5.1%
Mean travel time to work (commute): 34.7 minutes
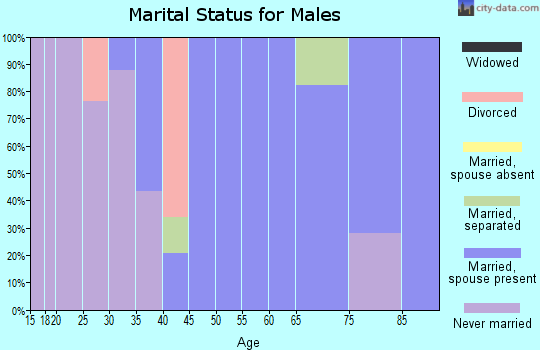
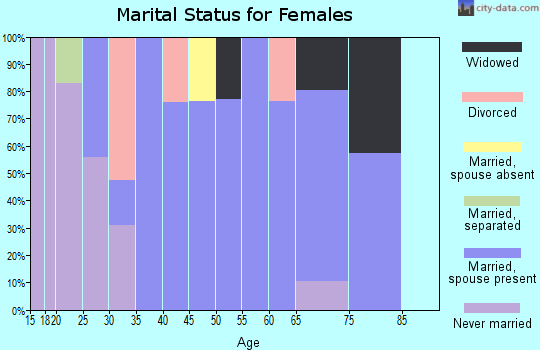
For population 15 years and over in 28740:
Never married: 13.0%
Now married: 70.3%
Separated: 0.3%
Widowed: 9.7%
Divorced: 6.7%
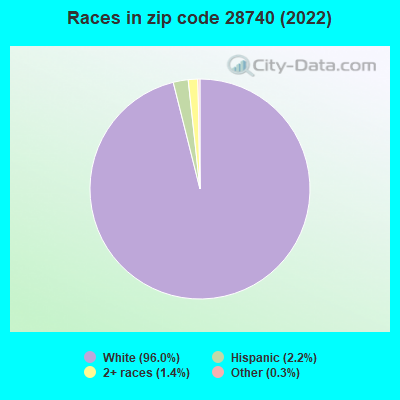
Zip code 28740 compared to state average:
Black race population percentage significantly below state average.
Hispanic race population percentage significantly below state average.
Median age significantly above state average.
Foreign-born population percentage significantly below state average.
Renting percentage below state average.
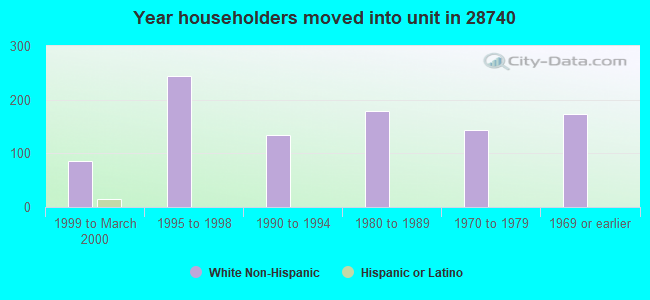
Length of stay since moving in significantly above state average.
House age above state average.
Number of college students significantly below state average.
Percentage of population with a bachelor's degree or higher below state average.
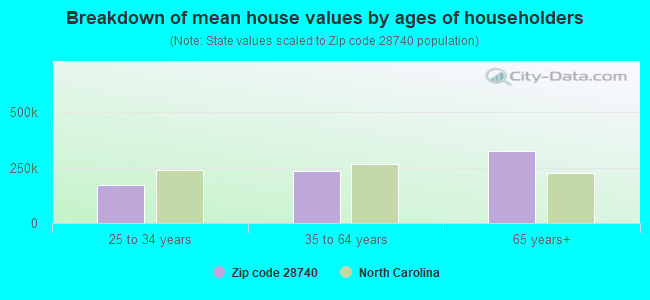
Estimated median house/condo value in 2022: $230,429
28740:
$230,429
North Carolina:
$280,600
According to our research of North Carolina and other state lists, there were 5 registered sex offenders living in 28740 zip code as of April 23, 2024. The ratio of all residents to sex offenders in zip code 28740 is 282 to 1.
Median resident age:
This zip code:
60.1 years
North Carolina median age:
39.2 years
Average household size:
This zip code:
2.1 people
North Carolina:
2.4 people
Averages for the 2020 tax year for zip code 28740, filed in 2021:
Average Adjusted Gross Income (AGI) in 2020: $48,840 (Individual Income Tax Returns)
Here:
$48,840
State:
$70,020
Salary/wage: $43,447 (reported on 79.8% of returns)
Here:
$43,447
State:
$58,387
(% of AGI for various income ranges: 1221.0% for AGIs below $25k, 3651.9% for AGIs $25k-50k, 6470.0% for AGIs $50k-75k, 9552.9% for AGIs $75k-100k, 17096.0% for AGIs $100k-200k)
Taxable interest for individuals: $586 (reported on 29.8% of returns)
This zip code:
$586
North Carolina:
$1,479
(% of AGI for various income ranges: 24.8% for AGIs below $25k, 13.3% for AGIs $25k-50k, 15.5% for AGIs $50k-75k, 18.6% for AGIs $75k-100k, 108.0% for AGIs $100k-200k)
Ordinary dividends: $2,989 (reported on 9.6% of returns)
Here:
$2,989
State:
$7,888
(% of AGI for various income ranges: 29.0% for AGIs below $25k, 141.8% for AGIs $50k-75k, 104.0% for AGIs $100k-200k)
Net capital gain/loss in AGI: +$11,444 (reported on 9.6% of returns)
Here:
+$11,444
State:
+$23,652
(% of AGI for various income ranges: 50.0% for AGIs below $25k, 90.9% for AGIs $50k-75k, 1650.0% for AGIs $100k-200k)
Profit/loss from business: +$5,953 (reported on 18.1% of returns)
Here:
+$5,953
State:
+$11,710
(% of AGI for various income ranges: 173.3% for AGIs below $25k, 164.8% for AGIs $25k-50k, 193.6% for AGIs $50k-75k, 178.0% for AGIs $100k-200k)
Taxable individual retirement arrangement distribution: $12,733 (reported on 6.4% of returns)
28740:
$12,733
North Carolina:
$20,247
(% of AGI for various income ranges: 159.0% for AGIs below $25k, 614.3% for AGIs $75k-100k)
Earned income credit: $2,178 (reported on 19.1% of returns)
Here:
$2,178
State:
$2,337
(% of AGI for various income ranges: 128.1% for AGIs below $25k, 58.6% for AGIs $25k-50k)
Percentage of individuals using paid preparers for their 2020 taxes: 96.8%
Here:
97%
State:
93%
(% for various income ranges: 93.8% for AGIs below $25k, 100.0% for AGIs $25k-50k, 93.8% for AGIs $50k-75k, 100.0% for AGIs $75k-100k, 100.0% for AGIs $100k-200k)
Averages for the 2012 tax year for zip code 28740, filed in 2013:
Average Adjusted Gross Income (AGI) in 2012: $36,428 (Individual Income Tax Returns)
Here:
$36,428
State:
$54,937
Salary/wage: $34,303 (reported on 78.8% of returns)
Here:
$34,303
State:
$46,336
(% of AGI for various income ranges: 70.6% for AGIs below $25k, 79.6% for AGIs $25k-50k, 73.0% for AGIs $50k-75k, 74.6% for AGIs $75k-100k, 67.4% for AGIs $100k-200k)
Taxable interest for individuals: $700 (reported on 36.5% of returns)
This zip code:
$700
North Carolina:
$1,298
(% of AGI for various income ranges: 1.0% for AGIs below $25k, 0.9% for AGIs $25k-50k, 0.8% for AGIs $50k-75k, 0.5% for AGIs $75k-100k)
Ordinary dividends: $1,543 (reported on 8.2% of returns)
Here:
$1,543
State:
$6,213
Net capital gain/loss in AGI: +$678 (reported on 10.6% of returns)
Here:
+$678
State:
+$12,740
(% of AGI for various income ranges: 0.8% for AGIs $25k-50k, 0.2% for AGIs $75k-100k)
Profit/loss from business: +$6,171 (reported on 16.5% of returns)
Here:
+$6,171
State:
+$10,311
(% of AGI for various income ranges: 9.8% for AGIs below $25k, 2.8% for AGIs $25k-50k, 1.6% for AGIs $50k-75k)
Taxable individual retirement arrangement distribution: $8,550 (reported on 9.4% of returns)
28740:
$8,550
North Carolina:
$15,575
(% of AGI for various income ranges: 7.4% for AGIs below $25k, 3.7% for AGIs $50k-75k)
Total itemized deductions: $18,192 (29% of AGI, reported on 15.3% of returns)
Here:
$18,192
State:
$23,438
Here:
28.7% of AGI
State:
21.5% of AGI
(% of AGI for various income ranges: 6.2% for AGIs below $25k, 5.3% for AGIs $25k-50k, 7.7% for AGIs $50k-75k, 19.7% for AGIs $75k-100k)
Charity contributions: $4,127 (reported on 12.9% of returns)
Here:
$4,127
State:
$4,687
(% of AGI for various income ranges: 1.3% for AGIs $25k-50k, 1.6% for AGIs $50k-75k, 4.1% for AGIs $75k-100k)
Taxes paid: $4,431 (reported on 15.3% of returns)
28740:
$4,431
State:
$8,823
(% of AGI for various income ranges: 0.7% for AGIs below $25k, 0.9% for AGIs $25k-50k, 1.8% for AGIs $50k-75k, 6.6% for AGIs $75k-100k)
Earned income credit: $2,043 (reported on 24.7% of returns)
Here:
$2,043
State:
$2,376
(% of AGI for various income ranges: 6.2% for AGIs below $25k, 1.5% for AGIs $25k-50k)
Percentage of individuals using paid preparers for their 2012 taxes: 63.5%
Here:
64%
State:
53%
(% for various income ranges: 61.1% for AGIs below $25k, 65.4% for AGIs $25k-50k, 66.7% for AGIs $50k-75k, 100.0% for AGIs $75k-100k)
Averages for the 2004 tax year for zip code 28740, filed in 2005:
Average Adjusted Gross Income (AGI) in 2004: $29,909 (Individual Income Tax Returns)
Here:
$29,909
State:
$45,376
Salary/wage: $27,397 (reported on 81.3% of returns)
Here:
$27,397
State:
$39,442
(% of AGI for various income ranges: 63.6% for AGIs below $10k, 67.9% for AGIs $10k-25k, 81.5% for AGIs $25k-50k, 79.1% for AGIs $50k-75k, 97.8% for AGIs $75k-100k)
Taxable interest for individuals: $866 (reported on 42.5% of returns)
This zip code:
$866
North Carolina:
$1,515
(% of AGI for various income ranges: 1.5% for AGIs below $10k, 1.8% for AGIs $10k-25k, 1.4% for AGIs $25k-50k, 0.6% for AGIs $50k-75k, 1.7% for AGIs $75k-100k)
Taxable dividends: $1,469 (reported on 11.2% of returns)
Here:
$1,469
State:
$4,016
(% of AGI for various income ranges: 1.6% for AGIs $10k-25k, 0.5% for AGIs $25k-50k, 0.1% for AGIs $50k-75k, 0.3% for AGIs $75k-100k)
Net capital gain/loss: +$5,118 (reported on 10.6% of returns)
Here:
+$5,118
State:
+$11,152
(% of AGI for various income ranges: 0.4% for AGIs $10k-25k, 0.2% for AGIs $25k-50k, 0.2% for AGIs $50k-75k, 15.3% for AGIs $75k-100k)
Profit/loss from business: +$5,938 (reported on 22.3% of returns)
Here:
+$5,938
State:
+$9,490
(% of AGI for various income ranges: 15.0% for AGIs below $10k, 11.6% for AGIs $10k-25k, 3.8% for AGIs $25k-50k, 2.0% for AGIs $50k-75k)
IRA payment deduction: $3,053 (reported on 2.2% of returns)
28740:
$3,053
North Carolina:
$2,967
Total itemized deductions: $14,674 (28% of AGI, reported on 15.4% of returns)
Here:
$14,674
State:
$19,464
Here:
27.8% of AGI
State:
22.7% of AGI
(% of AGI for various income ranges: 6.6% for AGIs $10k-25k, 7.6% for AGIs $25k-50k, 7.3% for AGIs $50k-75k, 8.2% for AGIs $75k-100k, 13.6% for AGIs over 100k)
Charity contributions deductions: $3,495 (6% of AGI, reported on 12.5% of returns)
Here:
$3,495
State:
$4,035
Here:
6.2% of AGI
State:
4.5% of AGI
(% of AGI for various income ranges: 0.6% for AGIs $10k-25k, 1.3% for AGIs $25k-50k, 1.8% for AGIs $50k-75k, 1.6% for AGIs $75k-100k, 3.9% for AGIs over 100k)
Total tax: $2,847 (reported on 74.6% of returns)
28740:
$2,847
State:
$7,257
(% of AGI for various income ranges: 4.0% for AGIs below $10k, 4.8% for AGIs $10k-25k, 5.7% for AGIs $25k-50k, 8.2% for AGIs $50k-75k, 10.4% for AGIs $75k-100k, 13.5% for AGIs over 100k)
Earned income credit: $1,700 (reported on 23.2% of returns)
Here:
$1,700
State:
$1,851
Percentage of individuals using paid preparers for their 2004 taxes: 74.6%
Here:
75%
State:
62%
(% for various income ranges: 68.8% for AGIs below $10k, 78.2% for AGIs $10k-25k, 74.1% for AGIs $25k-50k, 75.7% for AGIs $50k-75k, 75.8% for AGIs $75k-100k, 76.9% for AGIs over 100k)
Likely homosexual households (counted as self-reported same-sex unmarried-partner households)
Lesbian couples: 0.7% of all households
Gay men: 0.0% of all households
Household received Food Stamps/SNAP in the past 12 months: 44 Household did not receive Food Stamps/SNAP in the past 12 months: 790
Women who had a birth in the past 12 months: 6 (6 now married, 0 unmarried) Women who did not have a birth in the past 12 months: 204 (116 now married, 88 unmarried)
Housing units in zip code 28740 with a mortgage: 224 (2 second mortgage) Median monthly owner costs for units with a mortgage: $1,192 Median monthly owner costs for units without a mortgage: $336
Residents with income below the poverty level in 2022:
This zip code:
13.7%
Whole state:
12.8%
Residents with income below 50% of the poverty level in 2022:
This zip code:
4.3%
Whole state:
6.8%
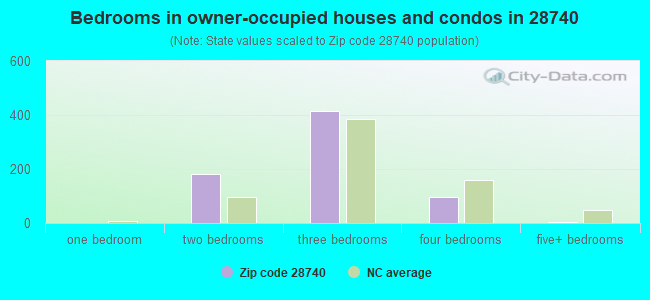
Median number of rooms in houses and condos:
Here:
6.3
State:
6.4
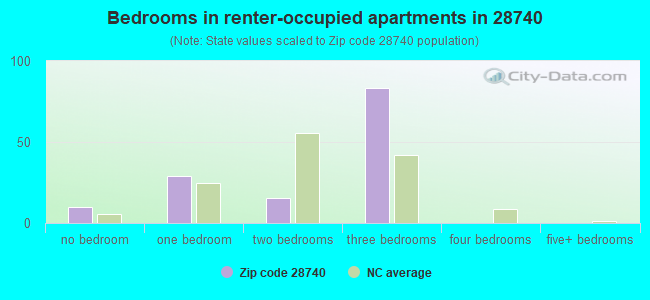
Median number of rooms in apartments:
Here:
4.9
State:
4.4
Notable locations in this zip code not listed on our city pages
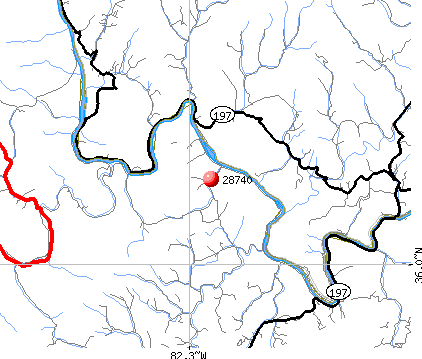
Streams, rivers, and creeks: Hughes Creek (A), Hollow Poplar Creek (B), Pate Creek (C), Flat Branch (D), Cooper Branch (E), Bird Creek (F), North Toe River (G), Brummett Creek (H), Bowling Green Creek (I). Display/hide their locations on the map
In group quarters: 3 (-1 institutionalized population)
Size of family households: 506 2-persons, 46 3-persons, 46 4-persons, 37 5-persons
Size of nonfamily households: 191 1-person, 19 5-persons
157 married couples with children.
9 single-parent households (9 women).
100.5% of residents of 28740 zip code speak English at home.
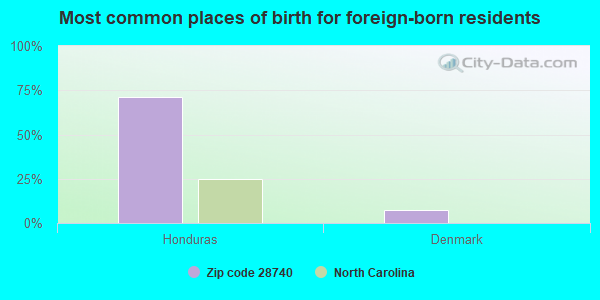
Foreign born population: 15 (0.9%) (93.3% of them are naturalized citizens)
This zip code:
0.9%
Whole state:
8.6%
71%Honduras
7%Denmark
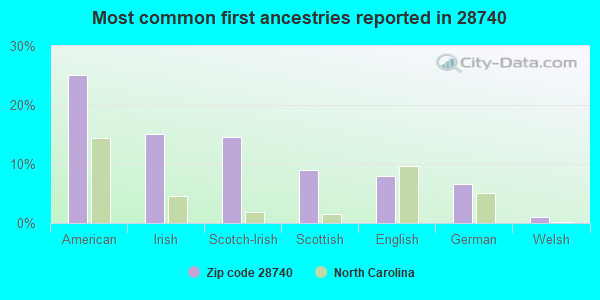
25%American
15%Irish
15%Scotch-Irish
9%Scottish
8%English
7%German
1%Welsh
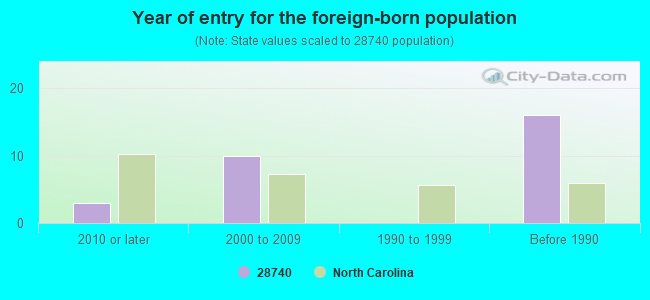
Year of entry for the foreign-born population
32010 or later
102000 to 2009
01990 to 1999
16Before 1990
Facilities with environmental interests located in this zip code:
APPLIED INDUSTRIAL MATERIALS CORP (NC HWY 197 NORTH in GREEN MOUNTAIN, NC)
Conditionally Exempt Small Quantity Generators, less than 100 kg/month of hazardous waste (Resource Conservation and Recovery Act (tracking hazardous waste)) - notification Organizations: APPLIED INDUSTRIAL MATERIALS CORP. (CONTACT/OWNER)
Housing units lacking complete plumbing facilities: 8.2% Housing units lacking complete kitchen facilities: 4.1%
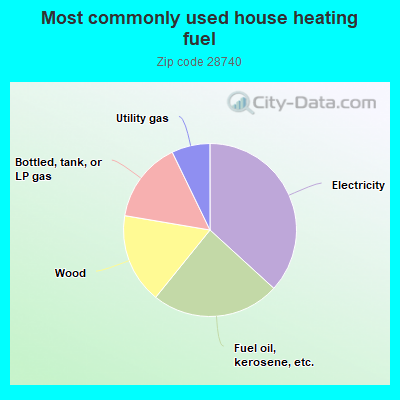
36.9%Electricity
24.1%Fuel oil, kerosene, etc.
16.9%Wood
15.2%Bottled, tank, or LP gas
7.2%Utility gas
Population in 1990: 1,471. Population change in the 1990s: +915 (+62.2%).
Place of birth for U.S.-born residents:
This state: 919
Northeast: 147
Midwest: 170
South: 478
West: 14
71% of the 28740 zip code residents lived in the same house 5 years ago. Out of people who lived in different houses, 43% lived in this county. Out of people who lived in different counties, 50% lived in North Carolina.
99% of the 28740 zip code residents lived in the same house 1 year ago. Out of people who lived in different houses, 192% moved from different county within same state. Out of people who lived in different houses, 25% moved from different state.
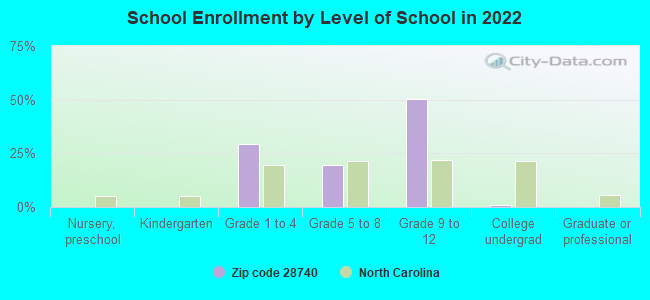
Private vs. public school enrollment:
Students in private schools in grades 1 to 8 (elementary and middle school):
Here:
0.0%
North Carolina:
13.8%
Students in private schools in grades 9 to 12 (high school):
Here:
0.0%
North Carolina:
11.9%
Students in private undergraduate colleges:
Here:
0.0%
North Carolina:
19.3%
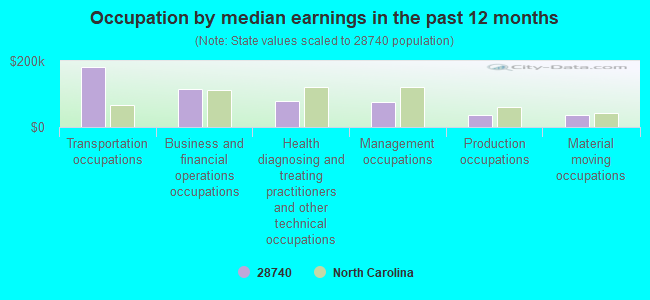
Occupation by median earnings in the past 12 months ($)
181,491Transportation occupations
114,549Business and financial operations occupations
78,438Health diagnosing and treating practitioners and other technical occupations
75,710Management occupations
37,012Production occupations
35,480Material moving occupations
Top industries in this zip code by the number of employees in 2005:
Mining: Clay and Ceramic and Refractory Minerals Mining (10-19: 1)
Construction: New Multifamily Housing Construction (except Operative Builders) (5-9: 1)
Other Services (except Public Administration): Commercial and Industrial Machinery and Equipment (except Automotive and Electronic) Repair and Maintenance (1-4: 1)
Construction: Plumbing, Heating, and Air-Conditioning Contractors (1-4: 1)
Construction: Electrical Contractors (1-4: 1)
Professional, Scientific, and Technical Services: Process, Physical Distribution, and Logistics Consulting Services (1-4: 1)
Fatal accident statistics in 2012:
Fatal accident count: 1
Vehicles involved in fatal accidents: 1
Fatal accidents caused by drunken drivers: 1
Fatalities: 1
Persons involved in fatal accidents: 2
Pedestrians involved in fatal accidents: 0
Fatal accident statistics in 2010:
Fatal accident count: 1
Vehicles involved in fatal accidents: 1
Fatal accidents caused by drunken drivers: 0
Fatalities: 1
Persons involved in fatal accidents: 1
Pedestrians involved in fatal accidents: 0
2002 - 2018 National Fire Incident Reporting System (NFIRS) incidents
Based on the data from the years 2002 - 2018 the average number of fires per year is 7. The highest number of reported fire incidents - 14 took place in 2005, and the least - 2 in 2013. The data has a rising trend.
When looking into fire subcategories, the most incidents belonged to: Structure Fires (43.5%), and Outside Fires (34.7%).
Fire incident types reported to NFIRS in Zip Code 28740
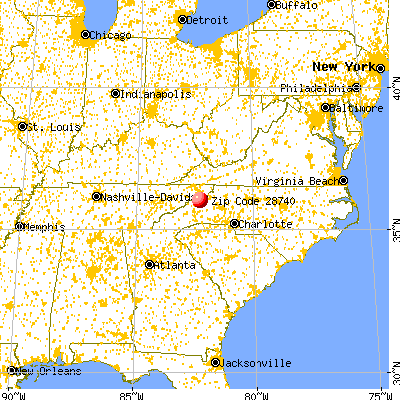


 Nearest zip codes: 37692, 28705, 37650, 37687, 28714, 37682.
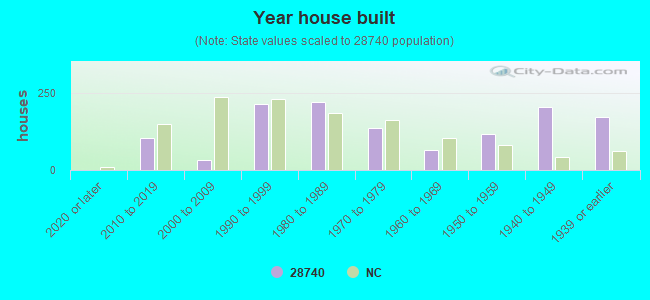


 Based on the data from the years 2002 - 2018 the average number of fires per year is 7. The highest number of reported fire incidents - 14 took place in 2005, and the least - 2 in 2013. The data has a rising trend.
 When looking into fire subcategories, the most incidents belonged to: Structure Fires (43.5%), and Outside Fires (34.7%).